Estimated zip code population in 2022: 4,845 Zip code population in 2010: 4,226 Zip code population in 2000: 3,842
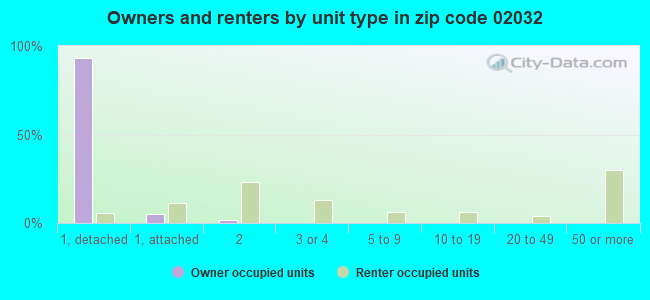
Houses and condos: 1,612 Renter-occupied apartments: 293
% of renters here:
19%
State:
38%
March 2022 cost of living index in zip code 02032: 133.1 (high, U.S. average is 100)
Land area: 2.3 sq. mi. Water area: 0.1 sq. mi.
Population density: 2,071 people per square mile
(low).
OSM Map
Google Map
MSN Map
OSM Map
General Map
Google Map
MSN Map
OSM Map
Google Map
MSN Map
OSM Map
Google Map
MSN Map
Please wait while loading the map...
Real estate property taxes paid for housing units in 2022:
This zip code:
1.1% ($8,132)
Massachusetts:
1.0% ($5,536)
Median real estate property taxes paid for housing units with mortgages in 2022: $8,418 (1.1%) Median real estate property taxes paid for housing units with no mortgage in 2022: $7,738 (1.1%)
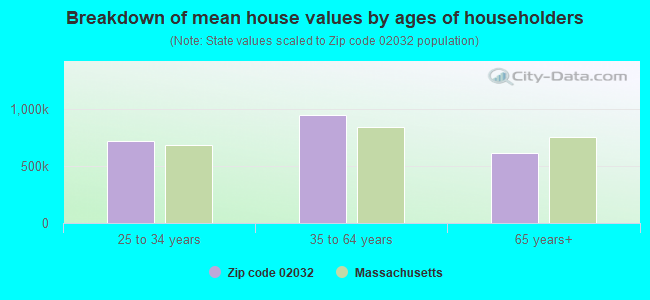
Estimated median house/condo value in 2022: $752,160
02032:
$752,160
Massachusetts:
$534,700
According to our research of Massachusetts and other state lists, there was 1 registered sex offender living in 02032 zip code as of May 23, 2024. The ratio of all residents to sex offenders in zip code 02032 is 4,128 to 1. The ratio of registered sex offenders to all residents in this zip code is much lower than the state average.
Median resident age:
This zip code:
38.2 years
Massachusetts median age:
40.3 years
Average household size:
This zip code:
3.1 people
Massachusetts:
2.4 people
Averages for the 2020 tax year for zip code 02032, filed in 2021:
Average Adjusted Gross Income (AGI) in 2020: $125,170 (Individual Income Tax Returns)
Here:
$125,170
State:
$105,130
Salary/wage: $113,043 (reported on 84.2% of returns)
Here:
$113,043
State:
$82,951
(% of AGI for various income ranges: 1140.0% for AGIs below $25k, 3755.3% for AGIs $25k-50k, 6521.4% for AGIs $50k-75k, 10532.1% for AGIs $75k-100k, 20498.8% for AGIs $100k-200k, 94247.1% for AGIs over 200k)
Taxable interest for individuals: $1,746 (reported on 47.4% of returns)
This zip code:
$1,746
Massachusetts:
$2,361
(% of AGI for various income ranges: 31.9% for AGIs below $25k, 46.3% for AGIs $25k-50k, 42.9% for AGIs $50k-75k, 115.7% for AGIs $75k-100k, 127.2% for AGIs $100k-200k, 855.7% for AGIs over 200k)
Ordinary dividends: $5,802 (reported on 34.0% of returns)
Here:
$5,802
State:
$10,365
(% of AGI for various income ranges: 45.5% for AGIs below $25k, 64.7% for AGIs $25k-50k, 87.6% for AGIs $50k-75k, 241.4% for AGIs $75k-100k, 251.6% for AGIs $100k-200k, 2377.1% for AGIs over 200k)
Net capital gain/loss in AGI: +$21,257 (reported on 30.0% of returns)
Here:
+$21,257
State:
+$48,178
(% of AGI for various income ranges: 40.0% for AGIs below $25k, 104.7% for AGIs $25k-50k, 125.7% for AGIs $50k-75k, 450.0% for AGIs $75k-100k, 555.9% for AGIs $100k-200k, 9317.1% for AGIs over 200k)
Profit/loss from business: +$21,350 (reported on 15.0% of returns)
Here:
+$21,350
State:
+$20,792
(% of AGI for various income ranges: 144.8% for AGIs below $25k, 184.7% for AGIs $25k-50k, 352.4% for AGIs $50k-75k, 427.1% for AGIs $75k-100k, 797.8% for AGIs $100k-200k, 2299.3% for AGIs over 200k)
Taxable individual retirement arrangement distribution: $16,093 (reported on 11.5% of returns)
02032:
$16,093
Massachusetts:
$22,790
(% of AGI for various income ranges: 57.7% for AGIs below $25k, 144.7% for AGIs $25k-50k, 271.0% for AGIs $50k-75k, 410.0% for AGIs $75k-100k, 580.9% for AGIs $100k-200k, 751.4% for AGIs over 200k)
Self-employed (Keogh) retirement plans: $20,100 (reported on 1.2% of returns)
02032:
$20,100
Massachusetts:
$26,868
(% of AGI for various income ranges: 430.7% for AGIs over 200k)
Total itemized deductions: $29,046 (reported on 18.2% of returns)
Here:
$29,046
State:
$36,722
(% of AGI for various income ranges: 208.0% for AGIs $25k-50k, 318.6% for AGIs $50k-75k, 667.1% for AGIs $75k-100k, 1404.7% for AGIs $100k-200k, 4742.1% for AGIs over 200k)
Charity contributions: $5,711 (reported on 14.6% of returns)
Here:
$5,711
State:
$12,529
(% of AGI for various income ranges: 29.5% for AGIs $50k-75k, 55.7% for AGIs $75k-100k, 156.9% for AGIs $100k-200k, 1050.7% for AGIs over 200k)
Taxes paid: $9,322 (reported on 18.2% of returns)
02032:
$9,322
State:
$8,782
(% of AGI for various income ranges: 79.7% for AGIs $25k-50k, 123.3% for AGIs $50k-75k, 255.0% for AGIs $75k-100k, 486.9% for AGIs $100k-200k, 1339.3% for AGIs over 200k)
Earned income credit: $1,410 (reported on 4.0% of returns)
Here:
$1,410
State:
$1,909
(% of AGI for various income ranges: 23.2% for AGIs below $25k, 23.0% for AGIs $25k-50k)
Percentage of individuals using paid preparers for their 2020 taxes: 91.7%
Here:
92%
State:
92%
(% for various income ranges: 90.9% for AGIs below $25k, 90.5% for AGIs $25k-50k, 90.3% for AGIs $50k-75k, 91.7% for AGIs $75k-100k, 93.1% for AGIs $100k-200k, 93.0% for AGIs over 200k)
Averages for the 2012 tax year for zip code 02032, filed in 2013:
Average Adjusted Gross Income (AGI) in 2012: $92,922 (Individual Income Tax Returns)
Here:
$92,922
State:
$81,425
Salary/wage: $87,097 (reported on 85.2% of returns)
Here:
$87,097
State:
$64,752
(% of AGI for various income ranges: 76.8% for AGIs below $25k, 74.2% for AGIs $25k-50k, 73.3% for AGIs $50k-75k, 69.6% for AGIs $75k-100k, 84.5% for AGIs $100k-200k, 80.8% for AGIs over 200k)
Taxable interest for individuals: $1,573 (reported on 56.1% of returns)
This zip code:
$1,573
Massachusetts:
$2,136
(% of AGI for various income ranges: 2.0% for AGIs below $25k, 1.7% for AGIs $25k-50k, 1.5% for AGIs $50k-75k, 1.4% for AGIs $75k-100k, 0.5% for AGIs $100k-200k, 0.9% for AGIs over 200k)
Ordinary dividends: $4,081 (reported on 34.5% of returns)
Here:
$4,081
State:
$9,473
(% of AGI for various income ranges: 1.5% for AGIs below $25k, 1.2% for AGIs $25k-50k, 1.5% for AGIs $50k-75k, 1.6% for AGIs $75k-100k, 0.9% for AGIs $100k-200k, 2.1% for AGIs over 200k)
Net capital gain/loss in AGI: +$4,422 (reported on 26.5% of returns)
Here:
+$4,422
State:
+$31,437
(% of AGI for various income ranges: 0.2% for AGIs $50k-75k, 0.8% for AGIs $75k-100k, 0.4% for AGIs $100k-200k, 2.7% for AGIs over 200k)
Profit/loss from business: +$22,309 (reported on 15.2% of returns)
Here:
+$22,309
State:
+$20,662
(% of AGI for various income ranges: 9.2% for AGIs below $25k, 4.8% for AGIs $25k-50k, 2.5% for AGIs $50k-75k, 4.1% for AGIs $75k-100k, 2.9% for AGIs $100k-200k, 3.7% for AGIs over 200k)
Taxable individual retirement arrangement distribution: $15,657 (reported on 13.5% of returns)
02032:
$15,657
Massachusetts:
$18,892
(% of AGI for various income ranges: 4.4% for AGIs below $25k, 3.9% for AGIs $25k-50k, 4.1% for AGIs $50k-75k, 4.4% for AGIs $75k-100k, 2.4% for AGIs $100k-200k, 0.8% for AGIs over 200k)
Self-employment retirement plans: $21,467 (reported on 1.3% of returns)
02032:
$21,467
Massachusetts:
$20,669
Total itemized deductions: $29,251 (20% of AGI, reported on 53.4% of returns)
Here:
$29,251
State:
$28,907
Here:
19.9% of AGI
State:
18.2% of AGI
(% of AGI for various income ranges: 17.9% for AGIs below $25k, 16.8% for AGIs $25k-50k, 17.1% for AGIs $50k-75k, 20.2% for AGIs $75k-100k, 17.9% for AGIs $100k-200k, 14.9% for AGIs over 200k)
Charity contributions: $2,638 (reported on 44.8% of returns)
Here:
$2,638
State:
$4,208
(% of AGI for various income ranges: 0.6% for AGIs below $25k, 1.1% for AGIs $25k-50k, 1.0% for AGIs $50k-75k, 1.4% for AGIs $75k-100k, 1.0% for AGIs $100k-200k, 1.6% for AGIs over 200k)
Taxes paid: $13,594 (reported on 53.4% of returns)
02032:
$13,594
State:
$13,303
(% of AGI for various income ranges: 5.1% for AGIs below $25k, 5.0% for AGIs $25k-50k, 7.3% for AGIs $50k-75k, 8.2% for AGIs $75k-100k, 8.5% for AGIs $100k-200k, 8.0% for AGIs over 200k)
Earned income credit: $1,823 (reported on 5.8% of returns)
Here:
$1,823
State:
$1,971
(% of AGI for various income ranges: 2.7% for AGIs below $25k, 0.4% for AGIs $25k-50k)
Percentage of individuals using paid preparers for their 2012 taxes: 55.6%
Here:
56%
State:
56%
(% for various income ranges: 49.2% for AGIs below $25k, 53.8% for AGIs $25k-50k, 58.3% for AGIs $50k-75k, 60.9% for AGIs $75k-100k, 58.0% for AGIs $100k-200k, 62.5% for AGIs over 200k)
Averages for the 2004 tax year for zip code 02032, filed in 2005:
Average Adjusted Gross Income (AGI) in 2004: $67,336 (Individual Income Tax Returns)
Here:
$67,336
State:
$62,877
Salary/wage: $61,371 (reported on 83.4% of returns)
Here:
$61,371
State:
$52,969
(% of AGI for various income ranges: 103.2% for AGIs below $10k, 61.6% for AGIs $10k-25k, 74.8% for AGIs $25k-50k, 75.0% for AGIs $50k-75k, 82.8% for AGIs $75k-100k, 75.5% for AGIs over 100k)
Taxable interest for individuals: $1,527 (reported on 71.5% of returns)
This zip code:
$1,527
Massachusetts:
$1,945
(% of AGI for various income ranges: 9.3% for AGIs below $10k, 4.4% for AGIs $10k-25k, 3.0% for AGIs $25k-50k, 1.3% for AGIs $50k-75k, 1.4% for AGIs $75k-100k, 1.2% for AGIs over 100k)
Taxable dividends: $2,246 (reported on 39.3% of returns)
Here:
$2,246
State:
$5,323
(% of AGI for various income ranges: 3.7% for AGIs below $10k, 1.6% for AGIs $10k-25k, 0.9% for AGIs $25k-50k, 1.1% for AGIs $50k-75k, 1.1% for AGIs $75k-100k, 1.4% for AGIs over 100k)
Net capital gain/loss: +$12,685 (reported on 29.7% of returns)
Here:
+$12,685
State:
+$20,377
(% of AGI for various income ranges: -2.9% for AGIs below $10k, -0.2% for AGIs $10k-25k, -0.1% for AGIs $25k-50k, 0.2% for AGIs $50k-75k, -0.5% for AGIs $75k-100k, 9.8% for AGIs over 100k)
Profit/loss from business: +$23,467 (reported on 14.8% of returns)
Here:
+$23,467
State:
+$17,837
(% of AGI for various income ranges: -3.5% for AGIs below $10k, 8.3% for AGIs $10k-25k, 5.7% for AGIs $25k-50k, 4.8% for AGIs $50k-75k, 4.4% for AGIs $75k-100k, 5.2% for AGIs over 100k)
IRA payment deduction: $3,222 (reported on 3.9% of returns)
02032:
$3,222
Massachusetts:
$3,100
(% of AGI for various income ranges: 0.4% for AGIs $25k-50k, 0.2% for AGIs $50k-75k, 0.2% for AGIs $75k-100k, 0.1% for AGIs over 100k)
Self-employed pension: $13,026 (reported on 2.1% of returns)
Here:
$13,026
Massachusetts:
$14,516
Total itemized deductions: $21,941 (21% of AGI, reported on 51.2% of returns)
Here:
$21,941
State:
$22,573
Here:
21.0% of AGI
State:
19.5% of AGI
(% of AGI for various income ranges: 26.9% for AGIs below $10k, 16.3% for AGIs $10k-25k, 16.7% for AGIs $25k-50k, 18.9% for AGIs $50k-75k, 18.3% for AGIs $75k-100k, 15.7% for AGIs over 100k)
Charity contributions deductions: $2,696 (3% of AGI, reported on 48.8% of returns)
Here:
$2,696
State:
$3,295
Here:
2.5% of AGI
State:
2.7% of AGI
(% of AGI for various income ranges: 1.6% for AGIs below $10k, 1.6% for AGIs $10k-25k, 1.5% for AGIs $25k-50k, 1.7% for AGIs $50k-75k, 1.8% for AGIs $75k-100k, 2.2% for AGIs over 100k)
Total tax: $11,340 (reported on 82.9% of returns)
02032:
$11,340
State:
$11,494
(% of AGI for various income ranges: 2.8% for AGIs below $10k, 5.4% for AGIs $10k-25k, 8.6% for AGIs $25k-50k, 9.8% for AGIs $50k-75k, 10.4% for AGIs $75k-100k, 17.5% for AGIs over 100k)
Earned income credit: $1,494 (reported on 4.3% of returns)
Here:
$1,494
State:
$1,518
Percentage of individuals using paid preparers for their 2004 taxes: 56.8%
Here:
57%
State:
58%
(% for various income ranges: 46.4% for AGIs below $10k, 49.3% for AGIs $10k-25k, 56.3% for AGIs $25k-50k, 59.6% for AGIs $50k-75k, 65.1% for AGIs $75k-100k, 65.9% for AGIs over 100k)
Likely homosexual households (counted as self-reported same-sex unmarried-partner households)
Lesbian couples: 0.0% of all households
Gay men: 3.1% of all households
Household received Food Stamps/SNAP in the past 12 months: 90 Household did not receive Food Stamps/SNAP in the past 12 months: 1,449
Women who had a birth in the past 12 months: 28 (14 now married, 12 unmarried) Women who did not have a birth in the past 12 months: 967 (541 now married, 414 unmarried)
Housing units in zip code 02032 with a mortgage: 796 (139 second mortgage, 130 both second mortgage and home equity loan) Median monthly owner costs for units with a mortgage: $3,139 Median monthly owner costs for units without a mortgage: $1,199
Residents with income below the poverty level in 2022:
This zip code:
7.1%
Whole state:
10.4%
Residents with income below 50% of the poverty level in 2022:
This zip code:
4.3%
Whole state:
5.1%
Median number of rooms in houses and condos:
Here:
7.5
State:
6.5
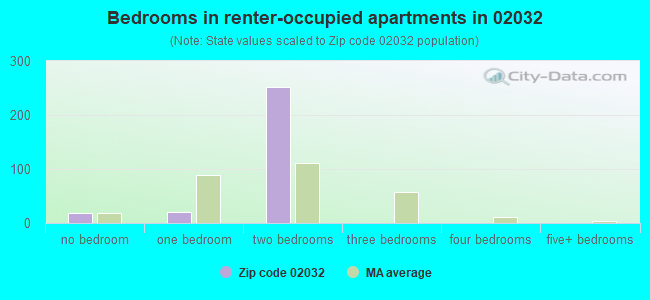
Median number of rooms in apartments:
Here:
3.5
State:
4.0
Notable locations in this zip code not listed on our city pages
1,149 married couples with children.
79 single-parent households (15 men, 64 women).
83.1% of residents of 02032 zip code speak English at home.
5.3% of residents speak Spanish at home (100% very well).
5.6% of residents speak other Indo-European language at home (76% very well, 9% well, 6% not well, 8% not at all).
5.3% of residents speak Asian or Pacific Island language at home (53% very well, 39% well, 8% not well).
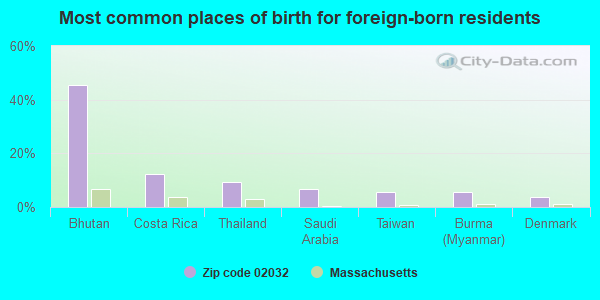
Foreign born population: 383 (7.9%) (71.7% of them are naturalized citizens)
This zip code:
7.9%
Whole state:
18.0%
45%Bhutan
12%Costa Rica
9%Thailand
7%Saudi Arabia
6%Taiwan
5%Burma (Myanmar)
4%Denmark
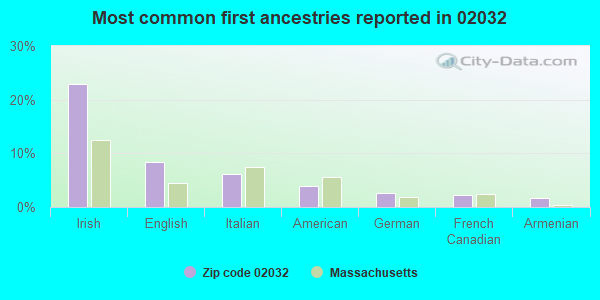
23%Irish
8%English
6%Italian
4%American
3%German
2%French Canadian
2%Armenian
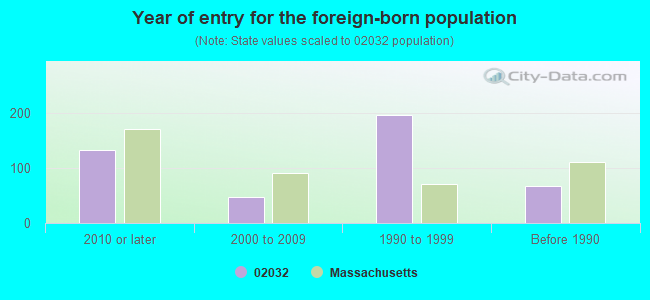
Year of entry for the foreign-born population
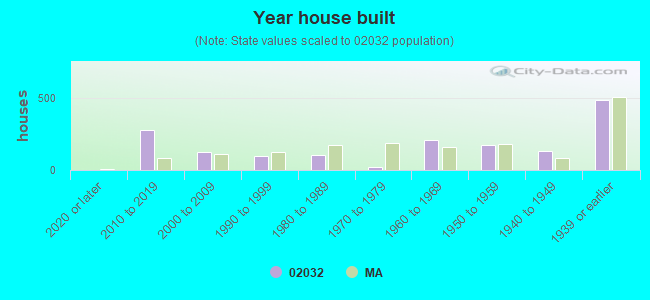
1332010 or later
472000 to 2009
1971990 to 1999
68Before 1990
Facilities with environmental interests located in this zip code:
BAYER HEALTHCARE DIAGNOSTICS DIVISION (333 CONEY ST in EAST WALPOLE, MA)
AIR MINOR (AIRS/AFS) ENFORCEMENT/COMPLIANCE ACTIVITY (Integrated Compliance Information System) - ICIS-01-1999-0184, FORMAL ENFORCEMENT ACTION (Integrated Compliance Information System) - ICIS-01-1999-0184, FORMAL ENFORCEMENT ACTION CRITERIA AND HAZARDOUS AIR POLLUTANT INVENTORY (Inventory of air pollution sources) HAZARDOUS WASTE BIENNIAL REPORTER (Resource Conservation and Recovery Act (tracking hazardous waste)) Large Quantity Generators, more that 1000 kg of hazardous waste/month (Resource Conservation and Recovery Act (tracking hazardous waste)) - notification TRI REPORTER (Tracking of toxic chemicals releasing facilities) Business SIC classification: IN VITRO AND IN VIVO DIAGNOSTIC SUBSTANCES Organizations: BAYER HEALTHCARE LLC (CONTACT/OPERATOR)
Alternative names: BAYER CORP, BAYER CORP., WALPOLE, BAYER DIAGNOSTICS
BIRD MIDDLE (WASHINGTON STREET in EAST WALPOLE, MA)
(National Center for Education Statistics) - STATE ID-307305 Organizations: WALPOLE (SCHOOL DISTRICT)
OLD POST ROAD (99 OLD POST ROAD in EAST WALPOLE, MA)
(National Center for Education Statistics) - STATE ID-307018 Organizations: WALPOLE (SCHOOL DISTRICT)
BIRD INC TECHNICAL CENTER (EAST ST in WALPOLE, MA)
(Resource Conservation and Recovery Act (tracking hazardous waste))
CLAIR ACURA (103 PROVIDENCE HWY in WALPOLE, MA)
Small Quantity Generators, between 100 kg and 1000 kg of hazardous waste/month (Resource Conservation and Recovery Act (tracking hazardous waste)) - notification Organizations: ERNIE CLAIR (CONTACT/OWNER)
LEXUS OF NORWOOD (50 PROVIDENCE HWY in WALPOLE, MA)
Conditionally Exempt Small Quantity Generators, less than 100 kg/month of hazardous waste (Resource Conservation and Recovery Act (tracking hazardous waste)) - notification Business NAICS classification: ALL OTHER MOTOR VEHICLE PARTS MANUFACTURING. Organizations: HERB CHAMBERS (CONTACT/OWNER)
Housing units lacking complete plumbing facilities: 3.4%
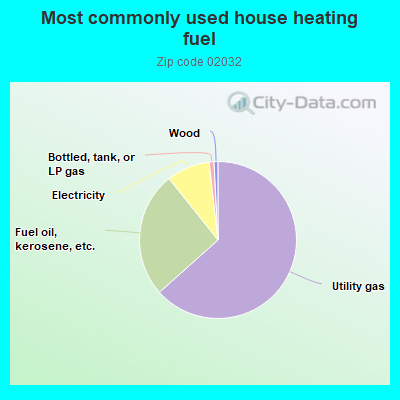
63.4%Utility gas
25.9%Fuel oil, kerosene, etc.
8.9%Electricity
1.0%Bottled, tank, or LP gas
0.8%Wood
Population in 1990: 3,844.
Place of birth for U.S.-born residents:
This state: 3,519
Northeast: 344
Midwest: 194
South: 177
West: 136
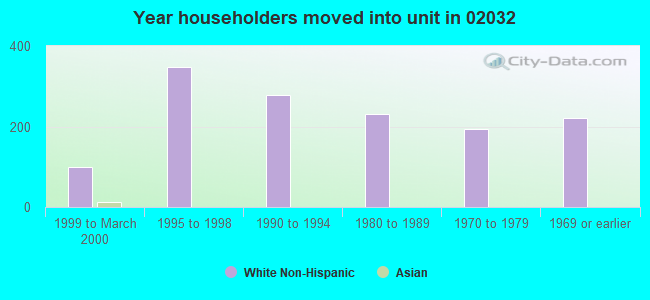
70% of the 02032 zip code residents lived in the same house 5 years ago. Out of people who lived in different houses, 71% lived in this county. Out of people who lived in different counties, 50% lived in Massachusetts.
95% of the 02032 zip code residents lived in the same house 1 year ago. Out of people who lived in different houses, 43% moved from this county. Out of people who lived in different houses, 23% moved from different county within same state. Out of people who lived in different houses, 13% moved from different state. Out of people who lived in different houses, 26% moved from abroad.
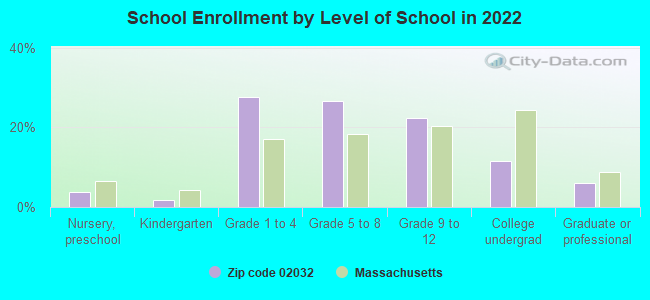
Private vs. public school enrollment:
Students in private schools in grades 1 to 8 (elementary and middle school): 22
Here:
2.6%
Massachusetts:
10.3%
Students in private schools in grades 9 to 12 (high school):
Here:
0.0%
Massachusetts:
12.3%
Students in private undergraduate colleges: 117
Here:
62.7%
Massachusetts:
51.2%
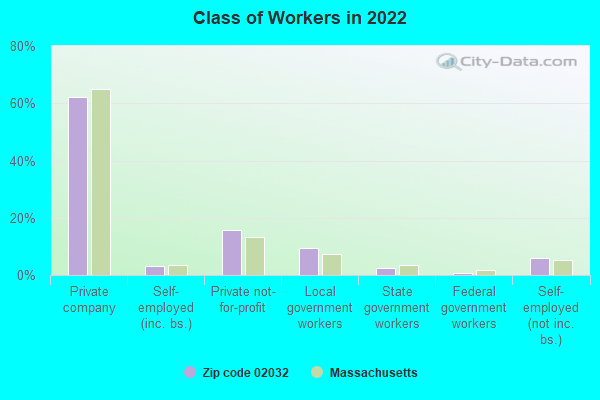
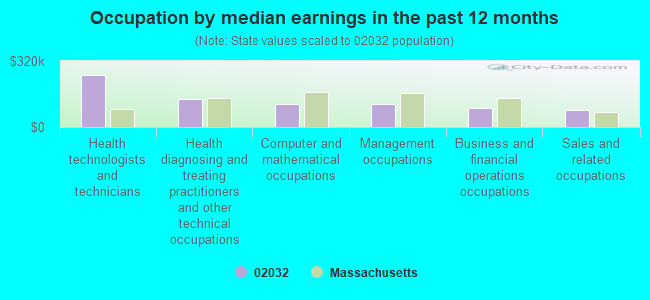
Occupation by median earnings in the past 12 months ($)
250,576Health technologists and technicians
134,584Health diagnosing and treating practitioners and other technical occupations
112,398Computer and mathematical occupations
110,053Management occupations
90,362Business and financial operations occupations
83,030Sales and related occupations
Companies with federal contracts located in this zip code:
EDWARDS, ELIZABETH (54 OLD POST RD in EAST WALPOLE, MA; small business)
$21,105 with Army for Technical Assistance. Signed on 2004-06-04. Completion date: 2005-06-13.
HOLLINGSWORTH & VOSE COMPANY I (112 WASHINGTON ST in EAST WALPOLE, MA; small business) : $0 in 2 contractsfrom 2002 to 2003
$7,550 with Army for Air Purification Equipment. Signed on 2002-02-06. Completion date: 2002-02-28.
-$7,550, same as above.Signed on 2003-06-16. Completion date: 2002-02-28.
Top industries in this zip code by the number of employees in 2005:
Management of Companies and Enterprises: Corporate, Subsidiary, and Regional Managing Offices (100-249 employees: 1 establishment)
Accommodation and Food Services: Snack and Nonalcoholic Beverage Bars (50-99: 1, 5-9: 1)
Educational Services: Elementary and Secondary Schools (50-99: 1)
Accommodation and Food Services: Cafeterias (50-99: 1)
Health Care and Social Assistance: Child Day Care Services (10-19: 3, 5-9: 2, 1-4: 2)
People in group quarters in 2000:
3 people in other group homes
Fatal accident statistics in 2014:
Fatal accident count: 1
Vehicles involved in fatal accidents: 1
Fatal accidents caused by drunken drivers: 1
Fatalities: 1
Persons involved in fatal accidents: 1
Pedestrians involved in fatal accidents: 0
Fatal accident statistics in 2013:
Fatal accident count: 1
Vehicles involved in fatal accidents: 1
Fatal accidents caused by drunken drivers: 1
Fatalities: 1
Persons involved in fatal accidents: 1
Pedestrians involved in fatal accidents: 0
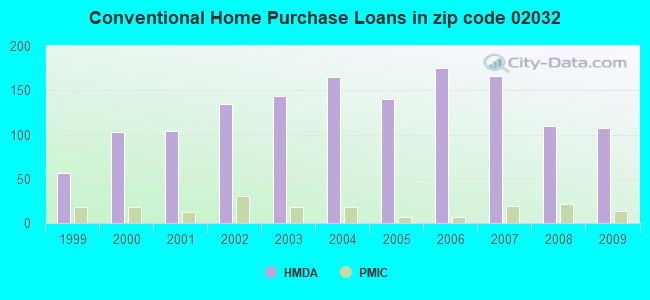
Home Mortgage Disclosure Act Aggregated Statistics For Year 2009 (Based on 2 partial tracts)
A) FHA, FSA/RHS & VA Home Purchase Loans
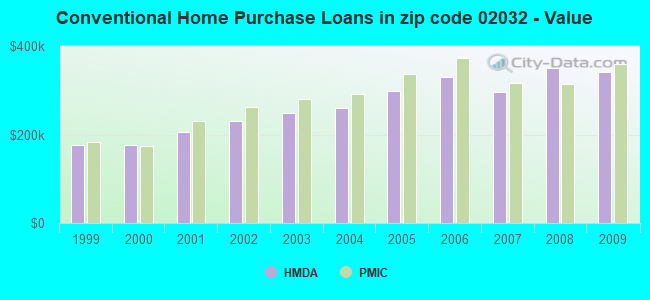
B) Conventional Home Purchase Loans
C) Refinancings
D) Home Improvement Loans
E) Loans on Dwellings For 5+ Families
F) Non-occupant Loans on < 5 Family Dwellings (A B C & D)
Number
Average Value
Number
Average Value
Number
Average Value
Number
Average Value
Number
Average Value
Number
Average Value
LOANS ORIGINATED
22
$297,835
107
$340,513
466
$282,063
21
$177,846
1
$786,340
6
$251,825
APPLICATIONS APPROVED, NOT ACCEPTED
0
$0
26
$421,550
16
$230,116
1
$58,790
0
$0
0
$0
APPLICATIONS DENIED
3
$269,463
15
$390,869
71
$290,834
7
$78,110
0
$0
1
$379,210
APPLICATIONS WITHDRAWN
1
$696,690
7
$451,649
71
$277,937
0
$0
0
$0
1
$293,960
FILES CLOSED FOR INCOMPLETENESS
0
$0
6
$407,870
31
$324,352
0
$0
0
$0
0
$0
Aggregated Statistics For Year 2008 (Based on 2 partial tracts)
A) FHA, FSA/RHS & VA Home Purchase Loans
B) Conventional Home Purchase Loans
C) Refinancings
D) Home Improvement Loans
F) Non-occupant Loans on < 5 Family Dwellings (A B C & D)
Number
Average Value
Number
Average Value
Number
Average Value
Number
Average Value
Number
Average Value
LOANS ORIGINATED
15
$297,977
110
$349,759
172
$269,136
34
$76,343
16
$296,165
APPLICATIONS APPROVED, NOT ACCEPTED
1
$533,540
28
$467,239
16
$321,702
1
$8,820
0
$0
APPLICATIONS DENIED
3
$241,537
9
$322,050
40
$244,575
6
$17,148
0
$0
APPLICATIONS WITHDRAWN
1
$408,600
12
$323,478
28
$249,709
6
$83,533
1
$220,470
FILES CLOSED FOR INCOMPLETENESS
0
$0
0
$0
10
$343,198
0
$0
1
$386,560
Aggregated Statistics For Year 2007 (Based on 2 partial tracts)
A) FHA, FSA/RHS & VA Home Purchase Loans
B) Conventional Home Purchase Loans
C) Refinancings
D) Home Improvement Loans
E) Loans on Dwellings For 5+ Families
F) Non-occupant Loans on < 5 Family Dwellings (A B C & D)
Number
Average Value
Number
Average Value
Number
Average Value
Number
Average Value
Number
Average Value
Number
Average Value
LOANS ORIGINATED
4
$404,562
166
$295,545
182
$252,765
47
$64,609
4
$11,888,110
6
$256,480
APPLICATIONS APPROVED, NOT ACCEPTED
0
$0
16
$384,536
16
$241,782
4
$146,980
0
$0
0
$0
APPLICATIONS DENIED
3
$260,643
18
$303,024
68
$313,889
15
$89,952
0
$0
10
$289,110
APPLICATIONS WITHDRAWN
0
$0
10
$320,563
29
$299,890
4
$169,028
0
$0
3
$279,753
FILES CLOSED FOR INCOMPLETENESS
0
$0
1
$734,900
18
$289,387
1
$77,900
0
$0
1
$339,520
Aggregated Statistics For Year 2006 (Based on 2 partial tracts)
A) FHA, FSA/RHS & VA Home Purchase Loans
B) Conventional Home Purchase Loans
C) Refinancings
D) Home Improvement Loans
E) Loans on Dwellings For 5+ Families
F) Non-occupant Loans on < 5 Family Dwellings (A B C & D)
Number
Average Value
Number
Average Value
Number
Average Value
Number
Average Value
Number
Average Value
Number
Average Value
LOANS ORIGINATED
4
$450,492
175
$330,739
209
$241,329
44
$98,209
1
$41,154,400
16
$386,282
APPLICATIONS APPROVED, NOT ACCEPTED
0
$0
18
$248,151
25
$327,354
3
$78,390
0
$0
1
$35,280
APPLICATIONS DENIED
0
$0
28
$262,884
85
$282,202
15
$103,082
0
$0
9
$194,177
APPLICATIONS WITHDRAWN
0
$0
13
$406,343
60
$256,113
1
$202,830
0
$0
3
$110,233
FILES CLOSED FOR INCOMPLETENESS
0
$0
3
$327,277
22
$259,553
0
$0
0
$0
0
$0
Aggregated Statistics For Year 2005 (Based on 2 partial tracts)
B) Conventional Home Purchase Loans
C) Refinancings
D) Home Improvement Loans
E) Loans on Dwellings For 5+ Families
F) Non-occupant Loans on < 5 Family Dwellings (A B C & D)
Number
Average Value
Number
Average Value
Number
Average Value
Number
Average Value
Number
Average Value
LOANS ORIGINATED
140
$298,180
290
$224,428
43
$93,725
3
$267,013
21
$261,134
APPLICATIONS APPROVED, NOT ACCEPTED
15
$242,125
28
$266,506
7
$131,233
0
$0
0
$0
APPLICATIONS DENIED
10
$400,374
78
$240,746
19
$93,526
0
$0
7
$262,254
APPLICATIONS WITHDRAWN
12
$301,064
56
$257,346
6
$56,342
0
$0
4
$363,408
FILES CLOSED FOR INCOMPLETENESS
3
$194,993
19
$311,443
3
$18,617
0
$0
1
$495,320
Aggregated Statistics For Year 2004 (Based on 2 partial tracts)
B) Conventional Home Purchase Loans
C) Refinancings
D) Home Improvement Loans
E) Loans on Dwellings For 5+ Families
F) Non-occupant Loans on < 5 Family Dwellings (A B C & D)
Number
Average Value
Number
Average Value
Number
Average Value
Number
Average Value
Number
Average Value
LOANS ORIGINATED
165
$260,734
307
$225,325
35
$106,917
1
$918,630
12
$242,149
APPLICATIONS APPROVED, NOT ACCEPTED
16
$275,312
22
$265,232
7
$39,474
0
$0
0
$0
APPLICATIONS DENIED
7
$370,810
56
$228,396
12
$84,513
0
$0
0
$0
APPLICATIONS WITHDRAWN
7
$154,539
68
$223,042
3
$43,113
0
$0
1
$36,740
FILES CLOSED FOR INCOMPLETENESS
4
$261,992
21
$274,363
1
$220,470
0
$0
1
$364,510
Aggregated Statistics For Year 2003 (Based on 2 partial tracts)
A) FHA, FSA/RHS & VA Home Purchase Loans
B) Conventional Home Purchase Loans
C) Refinancings
D) Home Improvement Loans
F) Non-occupant Loans on < 5 Family Dwellings (A B C & D)
Number
Average Value
Number
Average Value
Number
Average Value
Number
Average Value
Number
Average Value
LOANS ORIGINATED
1
$405,660
143
$247,800
844
$196,443
15
$85,543
25
$209,358
APPLICATIONS APPROVED, NOT ACCEPTED
0
$0
6
$274,853
84
$199,193
4
$92,965
1
$183,720
APPLICATIONS DENIED
0
$0
16
$291,204
88
$204,837
7
$113,384
4
$97,375
APPLICATIONS WITHDRAWN
0
$0
18
$225,369
82
$195,788
1
$72,020
1
$146,980
FILES CLOSED FOR INCOMPLETENESS
0
$0
3
$394,397
13
$246,248
4
$40,420
0
$0
Aggregated Statistics For Year 2002 (Based on 2 partial tracts)
A) FHA, FSA/RHS & VA Home Purchase Loans
B) Conventional Home Purchase Loans
C) Refinancings
D) Home Improvement Loans
F) Non-occupant Loans on < 5 Family Dwellings (A B C & D)
Number
Average Value
Number
Average Value
Number
Average Value
Number
Average Value
Number
Average Value
LOANS ORIGINATED
4
$246,560
134
$230,177
578
$173,948
24
$76,001
21
$205,562
APPLICATIONS APPROVED, NOT ACCEPTED
0
$0
6
$170,742
59
$175,379
7
$41,364
3
$126,403
APPLICATIONS DENIED
0
$0
4
$288,448
69
$197,699
10
$92,744
0
$0
APPLICATIONS WITHDRAWN
0
$0
7
$331,124
47
$184,820
4
$51,810
0
$0
FILES CLOSED FOR INCOMPLETENESS
0
$0
4
$235,168
25
$246,515
0
$0
0
$0
Aggregated Statistics For Year 2001 (Based on 2 partial tracts)
A) FHA, FSA/RHS & VA Home Purchase Loans
B) Conventional Home Purchase Loans
C) Refinancings
D) Home Improvement Loans
E) Loans on Dwellings For 5+ Families
F) Non-occupant Loans on < 5 Family Dwellings (A B C & D)
Number
Average Value
Number
Average Value
Number
Average Value
Number
Average Value
Number
Average Value
Number
Average Value
LOANS ORIGINATED
4
$238,475
104
$204,769
389
$181,802
19
$38,524
1
$624,660
15
$213,513
APPLICATIONS APPROVED, NOT ACCEPTED
0
$0
7
$186,034
35
$147,442
1
$36,740
0
$0
0
$0
APPLICATIONS DENIED
0
$0
10
$181,079
46
$150,655
16
$18,648
0
$0
3
$161,677
APPLICATIONS WITHDRAWN
0
$0
3
$120,033
47
$145,948
3
$44,093
0
$0
1
$299,840
FILES CLOSED FOR INCOMPLETENESS
0
$0
1
$146,980
10
$241,635
0
$0
0
$0
1
$257,210
Aggregated Statistics For Year 2000 (Based on 2 partial tracts)
A) FHA, FSA/RHS & VA Home Purchase Loans
B) Conventional Home Purchase Loans
C) Refinancings
D) Home Improvement Loans
F) Non-occupant Loans on < 5 Family Dwellings (A B C & D)
Number
Average Value
Number
Average Value
Number
Average Value
Number
Average Value
Number
Average Value
LOANS ORIGINATED
1
$291,020
103
$176,447
90
$126,811
29
$45,513
3
$115,623
APPLICATIONS APPROVED, NOT ACCEPTED
0
$0
7
$186,034
4
$87,085
15
$29,298
0
$0
APPLICATIONS DENIED
0
$0
1
$182,260
28
$106,088
16
$65,958
0
$0
APPLICATIONS WITHDRAWN
0
$0
3
$279,263
22
$112,774
6
$39,195
0
$0
FILES CLOSED FOR INCOMPLETENESS
0
$0
3
$150,410
3
$147,470
0
$0
0
$0
Aggregated Statistics For Year 1999 (Based on 1 partial tract)
A) FHA, FSA/RHS & VA Home Purchase Loans
B) Conventional Home Purchase Loans
C) Refinancings
D) Home Improvement Loans
F) Non-occupant Loans on < 5 Family Dwellings (A B C & D)


 Nearest zip codes: 02062, 02081, 02067, 02090, 02071, 02021.