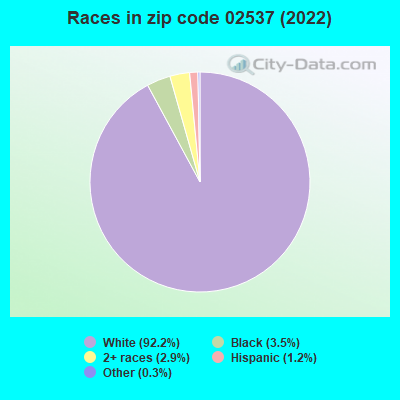
Estimated zip code population in 2022: 6,405 Zip code population in 2010: 6,293 Zip code population in 2000: 5,924
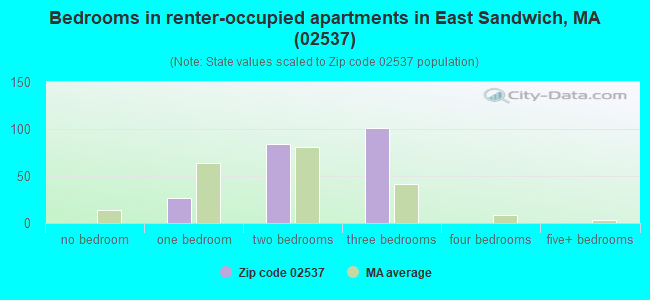
Houses and condos: 3,229 Renter-occupied apartments: 210
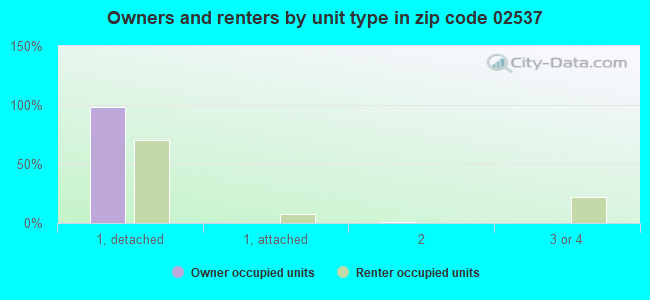
% of renters here:
9%
State:
38%
March 2022 cost of living index in zip code 02537: 115.3 (more than average, U.S. average is 100)
Land area: 12.1 sq. mi. Water area: 0.6 sq. mi.
Population density: 529 people per square mile
(low).
OSM Map
Google Map
MSN Map
OSM Map
General Map
Google Map
MSN Map
OSM Map
Google Map
MSN Map
OSM Map
Google Map
MSN Map
Please wait while loading the map...
Real estate property taxes paid for housing units in 2022:
This zip code:
1.1% ($6,551)
Massachusetts:
1.0% ($5,536)
Median real estate property taxes paid for housing units with mortgages in 2022: $6,635 (1.1%) Median real estate property taxes paid for housing units with no mortgage in 2022: $6,440 (1.2%)
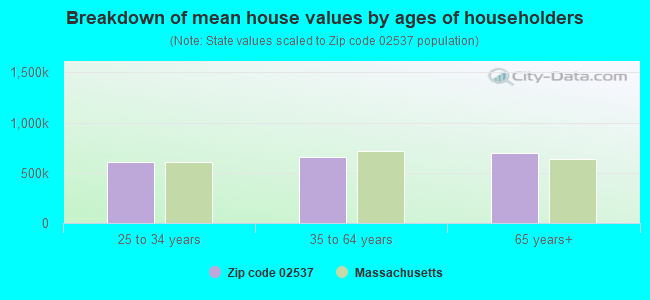
Estimated median house/condo value in 2022: $584,203
02537:
$584,203
Massachusetts:
$534,700
According to our research of Massachusetts and other state lists, there was 1 registered sex offender living in 02537 zip code as of May 28, 2024. The ratio of all residents to sex offenders in zip code 02537 is 6,338 to 1. The ratio of registered sex offenders to all residents in this zip code is much lower than the state average.
Median resident age:
This zip code:
50.7 years
Massachusetts median age:
40.3 years
Average household size:
This zip code:
2.6 people
Massachusetts:
2.4 people
Averages for the 2020 tax year for zip code 02537, filed in 2021:
Average Adjusted Gross Income (AGI) in 2020: $112,992 (Individual Income Tax Returns)
Here:
$112,992
State:
$105,130
Salary/wage: $89,474 (reported on 77.0% of returns)
Here:
$89,474
State:
$82,951
(% of AGI for various income ranges: 1181.1% for AGIs below $25k, 3265.6% for AGIs $25k-50k, 5444.3% for AGIs $50k-75k, 7272.9% for AGIs $75k-100k, 17148.0% for AGIs $100k-200k, 100618.2% for AGIs over 200k)
Taxable interest for individuals: $1,452 (reported on 45.0% of returns)
This zip code:
$1,452
Massachusetts:
$2,361
(% of AGI for various income ranges: 30.0% for AGIs below $25k, 35.6% for AGIs $25k-50k, 87.5% for AGIs $50k-75k, 168.6% for AGIs $75k-100k, 141.7% for AGIs $100k-200k, 655.5% for AGIs over 200k)
Ordinary dividends: $8,973 (reported on 32.9% of returns)
Here:
$8,973
State:
$10,365
(% of AGI for various income ranges: 57.7% for AGIs below $25k, 92.9% for AGIs $25k-50k, 302.9% for AGIs $50k-75k, 272.4% for AGIs $75k-100k, 529.3% for AGIs $100k-200k, 5094.5% for AGIs over 200k)
Net capital gain/loss in AGI: +$26,658 (reported on 29.3% of returns)
Here:
+$26,658
State:
+$48,178
(% of AGI for various income ranges: 24.7% for AGIs below $25k, 29.1% for AGIs $25k-50k, 177.1% for AGIs $50k-75k, 401.0% for AGIs $75k-100k, 700.7% for AGIs $100k-200k, 19483.6% for AGIs over 200k)
Profit/loss from business: +$26,484 (reported on 18.4% of returns)
Here:
+$26,484
State:
+$20,792
(% of AGI for various income ranges: 115.7% for AGIs below $25k, 239.1% for AGIs $25k-50k, 386.8% for AGIs $50k-75k, 364.3% for AGIs $75k-100k, 1076.6% for AGIs $100k-200k, 7760.0% for AGIs over 200k)
Taxable individual retirement arrangement distribution: $25,582 (reported on 16.6% of returns)
02537:
$25,582
Massachusetts:
$22,790
(% of AGI for various income ranges: 113.8% for AGIs below $25k, 259.4% for AGIs $25k-50k, 537.9% for AGIs $50k-75k, 651.0% for AGIs $75k-100k, 1362.2% for AGIs $100k-200k, 3813.6% for AGIs over 200k)
Self-employed (Keogh) retirement plans: $20,200 (reported on 1.8% of returns)
02537:
$20,200
Massachusetts:
$26,868
(% of AGI for various income ranges: 86.3% for AGIs $100k-200k, 780.0% for AGIs over 200k)
Total itemized deductions: $29,773 (reported on 17.8% of returns)
Here:
$29,773
State:
$36,722
(% of AGI for various income ranges: 183.8% for AGIs below $25k, 167.6% for AGIs $25k-50k, 855.7% for AGIs $50k-75k, 962.4% for AGIs $75k-100k, 1088.5% for AGIs $100k-200k, 6592.7% for AGIs over 200k)
Charity contributions: $4,776 (reported on 14.8% of returns)
Here:
$4,776
State:
$12,529
(% of AGI for various income ranges: 22.6% for AGIs $25k-50k, 57.1% for AGIs $50k-75k, 94.8% for AGIs $75k-100k, 129.5% for AGIs $100k-200k, 1248.2% for AGIs over 200k)
Taxes paid: $9,012 (reported on 17.8% of returns)
02537:
$9,012
State:
$8,782
(% of AGI for various income ranges: 40.4% for AGIs below $25k, 65.9% for AGIs $25k-50k, 275.7% for AGIs $50k-75k, 323.3% for AGIs $75k-100k, 349.8% for AGIs $100k-200k, 1834.5% for AGIs over 200k)
Earned income credit: $1,488 (reported on 5.1% of returns)
Here:
$1,488
State:
$1,909
(% of AGI for various income ranges: 31.3% for AGIs below $25k, 31.2% for AGIs $25k-50k)
Percentage of individuals using paid preparers for their 2020 taxes: 92.1%
Here:
92%
State:
92%
(% for various income ranges: 90.5% for AGIs below $25k, 95.8% for AGIs $25k-50k, 91.1% for AGIs $50k-75k, 90.6% for AGIs $75k-100k, 92.3% for AGIs $100k-200k, 93.2% for AGIs over 200k)
Averages for the 2012 tax year for zip code 02537, filed in 2013:
Average Adjusted Gross Income (AGI) in 2012: $80,398 (Individual Income Tax Returns)
Here:
$80,398
State:
$81,425
Salary/wage: $67,968 (reported on 78.4% of returns)
Here:
$67,968
State:
$64,752
(% of AGI for various income ranges: 67.0% for AGIs below $25k, 65.2% for AGIs $25k-50k, 58.8% for AGIs $50k-75k, 62.2% for AGIs $75k-100k, 70.7% for AGIs $100k-200k, 65.4% for AGIs over 200k)
Taxable interest for individuals: $1,194 (reported on 50.6% of returns)
This zip code:
$1,194
Massachusetts:
$2,136
(% of AGI for various income ranges: 1.8% for AGIs below $25k, 1.3% for AGIs $25k-50k, 0.8% for AGIs $50k-75k, 0.7% for AGIs $75k-100k, 0.6% for AGIs $100k-200k, 0.6% for AGIs over 200k)
Ordinary dividends: $5,604 (reported on 32.3% of returns)
Here:
$5,604
State:
$9,473
(% of AGI for various income ranges: 3.7% for AGIs below $25k, 3.0% for AGIs $25k-50k, 2.6% for AGIs $50k-75k, 1.6% for AGIs $75k-100k, 1.8% for AGIs $100k-200k, 2.5% for AGIs over 200k)
Net capital gain/loss in AGI: +$4,952 (reported on 27.1% of returns)
Here:
+$4,952
State:
+$31,437
(% of AGI for various income ranges: 0.5% for AGIs $50k-75k, 1.0% for AGIs $75k-100k, 1.1% for AGIs $100k-200k, 3.7% for AGIs over 200k)
Profit/loss from business: +$22,933 (reported on 20.3% of returns)
Here:
+$22,933
State:
+$20,662
(% of AGI for various income ranges: 9.3% for AGIs below $25k, 8.3% for AGIs $25k-50k, 5.2% for AGIs $50k-75k, 3.6% for AGIs $75k-100k, 4.9% for AGIs $100k-200k, 6.7% for AGIs over 200k)
Taxable individual retirement arrangement distribution: $21,798 (reported on 17.4% of returns)
02537:
$21,798
Massachusetts:
$18,892
(% of AGI for various income ranges: 6.4% for AGIs below $25k, 5.0% for AGIs $25k-50k, 5.1% for AGIs $50k-75k, 5.9% for AGIs $75k-100k, 4.9% for AGIs $100k-200k, 3.8% for AGIs over 200k)
Self-employment retirement plans: $22,100 (reported on 1.3% of returns)
02537:
$22,100
Massachusetts:
$20,669
Total itemized deductions: $26,598 (21% of AGI, reported on 53.2% of returns)
Here:
$26,598
State:
$28,907
Here:
21.2% of AGI
State:
18.2% of AGI
(% of AGI for various income ranges: 24.2% for AGIs below $25k, 17.7% for AGIs $25k-50k, 20.3% for AGIs $50k-75k, 19.5% for AGIs $75k-100k, 18.3% for AGIs $100k-200k, 14.5% for AGIs over 200k)
Charity contributions: $2,605 (reported on 45.5% of returns)
Here:
$2,605
State:
$4,208
(% of AGI for various income ranges: 1.2% for AGIs below $25k, 1.1% for AGIs $25k-50k, 1.3% for AGIs $50k-75k, 1.4% for AGIs $75k-100k, 1.4% for AGIs $100k-200k, 1.8% for AGIs over 200k)
Taxes paid: $12,009 (reported on 53.2% of returns)
02537:
$12,009
State:
$13,303
(% of AGI for various income ranges: 7.9% for AGIs below $25k, 5.9% for AGIs $25k-50k, 7.8% for AGIs $50k-75k, 7.7% for AGIs $75k-100k, 8.6% for AGIs $100k-200k, 7.9% for AGIs over 200k)
Earned income credit: $1,945 (reported on 7.1% of returns)
Here:
$1,945
State:
$1,971
(% of AGI for various income ranges: 3.1% for AGIs below $25k, 0.6% for AGIs $25k-50k)
Percentage of individuals using paid preparers for their 2012 taxes: 57.4%
Here:
57%
State:
56%
(% for various income ranges: 50.0% for AGIs below $25k, 54.9% for AGIs $25k-50k, 60.0% for AGIs $50k-75k, 54.5% for AGIs $75k-100k, 65.1% for AGIs $100k-200k, 73.9% for AGIs over 200k)
Averages for the 2004 tax year for zip code 02537, filed in 2005:
Average Adjusted Gross Income (AGI) in 2004: $71,638 (Individual Income Tax Returns)
Here:
$71,638
State:
$62,877
Salary/wage: $59,552 (reported on 79.9% of returns)
Here:
$59,552
State:
$52,969
(% of AGI for various income ranges: 179.4% for AGIs below $10k, 63.0% for AGIs $10k-25k, 65.7% for AGIs $25k-50k, 66.7% for AGIs $50k-75k, 73.9% for AGIs $75k-100k, 63.6% for AGIs over 100k)
Taxable interest for individuals: $1,609 (reported on 66.6% of returns)
This zip code:
$1,609
Massachusetts:
$1,945
(% of AGI for various income ranges: 8.8% for AGIs below $10k, 4.6% for AGIs $10k-25k, 2.7% for AGIs $25k-50k, 2.1% for AGIs $50k-75k, 1.0% for AGIs $75k-100k, 1.0% for AGIs over 100k)
Taxable dividends: $3,571 (reported on 40.7% of returns)
Here:
$3,571
State:
$5,323
(% of AGI for various income ranges: 7.5% for AGIs below $10k, 4.0% for AGIs $10k-25k, 2.4% for AGIs $25k-50k, 2.2% for AGIs $50k-75k, 1.5% for AGIs $75k-100k, 1.9% for AGIs over 100k)
Net capital gain/loss: +$7,702 (reported on 33.6% of returns)
Here:
+$7,702
State:
+$20,377
(% of AGI for various income ranges: -4.7% for AGIs below $10k, -0.3% for AGIs $10k-25k, 1.1% for AGIs $25k-50k, 1.5% for AGIs $50k-75k, 0.8% for AGIs $75k-100k, 5.6% for AGIs over 100k)
Profit/loss from business: +$18,953 (reported on 21.4% of returns)
Here:
+$18,953
State:
+$17,837
(% of AGI for various income ranges: -15.7% for AGIs below $10k, 9.3% for AGIs $10k-25k, 7.2% for AGIs $25k-50k, 6.6% for AGIs $50k-75k, 6.8% for AGIs $75k-100k, 4.9% for AGIs over 100k)
IRA payment deduction: $3,629 (reported on 5.4% of returns)
02537:
$3,629
Massachusetts:
$3,100
(% of AGI for various income ranges: 0.7% for AGIs $10k-25k, 0.8% for AGIs $25k-50k, 0.4% for AGIs $50k-75k, 0.3% for AGIs $75k-100k, 0.1% for AGIs over 100k)
Self-employed pension: $10,549 (reported on 2.4% of returns)
Here:
$10,549
Massachusetts:
$14,516
Total itemized deductions: $23,062 (21% of AGI, reported on 58.4% of returns)
Here:
$23,062
State:
$22,573
Here:
21.5% of AGI
State:
19.5% of AGI
(% of AGI for various income ranges: 40.6% for AGIs below $10k, 25.6% for AGIs $10k-25k, 25.0% for AGIs $25k-50k, 25.4% for AGIs $50k-75k, 21.9% for AGIs $75k-100k, 14.9% for AGIs over 100k)
Charity contributions deductions: $2,376 (2% of AGI, reported on 54.1% of returns)
Here:
$2,376
State:
$3,295
Here:
2.1% of AGI
State:
2.7% of AGI
(% of AGI for various income ranges: 1.3% for AGIs below $10k, 1.9% for AGIs $10k-25k, 2.0% for AGIs $25k-50k, 2.1% for AGIs $50k-75k, 1.9% for AGIs $75k-100k, 1.7% for AGIs over 100k)
Total tax: $11,868 (reported on 82.8% of returns)
02537:
$11,868
State:
$11,494
(% of AGI for various income ranges: 5.0% for AGIs below $10k, 5.4% for AGIs $10k-25k, 7.4% for AGIs $25k-50k, 8.7% for AGIs $50k-75k, 10.1% for AGIs $75k-100k, 17.4% for AGIs over 100k)
Earned income credit: $1,419 (reported on 5.4% of returns)
Here:
$1,419
State:
$1,518
Percentage of individuals using paid preparers for their 2004 taxes: 59.2%
Here:
59%
State:
58%
(% for various income ranges: 44.7% for AGIs below $10k, 53.6% for AGIs $10k-25k, 62.4% for AGIs $25k-50k, 65.0% for AGIs $50k-75k, 61.9% for AGIs $75k-100k, 67.4% for AGIs over 100k)
Household received Food Stamps/SNAP in the past 12 months: 204 Household did not receive Food Stamps/SNAP in the past 12 months: 2,197
Women who had a birth in the past 12 months: 21 (22 now married, 0 unmarried) Women who did not have a birth in the past 12 months: 1,126 (538 now married, 580 unmarried)
Housing units in zip code 02537 with a mortgage: 1,244 (247 second mortgage, 7 home equity loan, 200 both second mortgage and home equity loan) Houses without a mortgage: 41
Median monthly owner costs for units with a mortgage: $2,652 Median monthly owner costs for units without a mortgage: $993
Residents with income below the poverty level in 2022:
This zip code:
7.5%
Whole state:
10.4%
Residents with income below 50% of the poverty level in 2022:
This zip code:
4.3%
Whole state:
5.1%
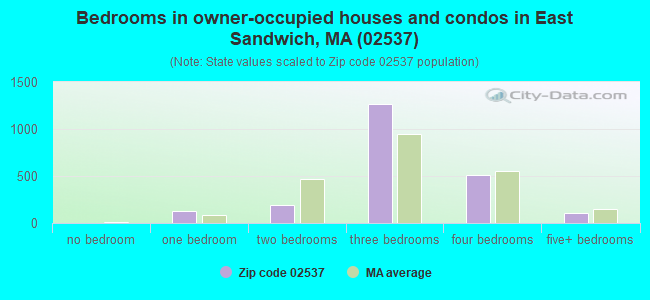
Median number of rooms in houses and condos:
Here:
6.9
State:
6.5
Median number of rooms in apartments:
Here:
6.6
State:
4.0
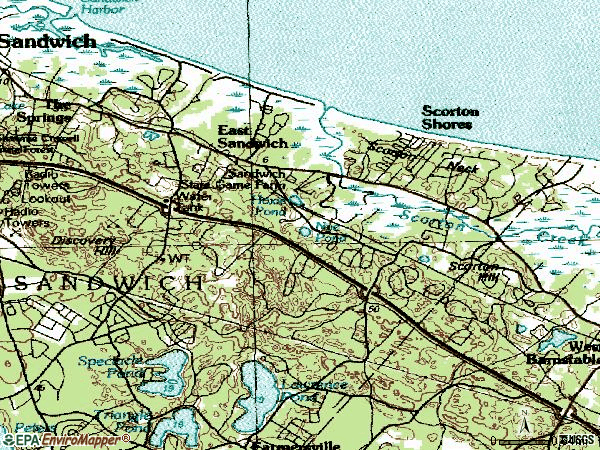
Notable locations in this zip code not listed on our city pages
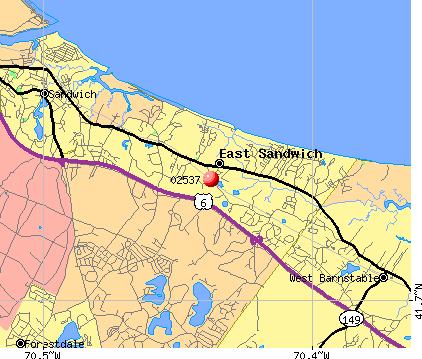
Notable locations in zip code 02537: Camp Hayward (A), Massachusetts State Fish Hatchery (B), East Sandwich Station (C), Sandwich Fire Department Station 2 (D), Sandwich High School Library (E), Rehabilitation Hospital of the Cape and Islands Medical Library (F), Oak Ridge School Library (G), Green Briar Jam Kitchen (H), Wing Family House (I), Nye Family House (J). Display/hide their locations on the map
Lakes and swamps: Spectacle Pond (A), Nye Pond (B), Hoxie Pond (C), Scorton Creek Marshes (D), Sandwich Harbor Marshes (E). Display/hide their locations on the map
In group quarters: 30 (-1 institutionalized population)
Size of family households: 788 2-persons, 265 3-persons, 395 4-persons, 225 5-persons, 28 6-persons
Size of nonfamily households: 673 1-person, 46 2-persons
905 married couples with children.
216 single-parent households (33 men, 183 women).
94.3% of residents of 02537 zip code speak English at home.
0.6% of residents speak Spanish at home (88% well, 12% not at all).
5.0% of residents speak other Indo-European language at home (91% very well, 9% well).
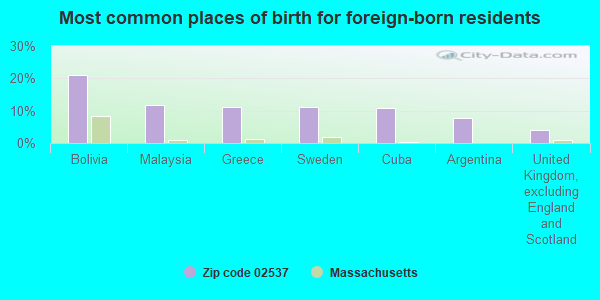
Foreign born population: 302 (4.7%) (75.9% of them are naturalized citizens)
This zip code:
4.7%
Whole state:
18.0%
45%Cuba
21%Bolivia
13%Greece
7%United Kingdom, excluding England and Scotland
6%Sweden
5%Germany
4%Austria
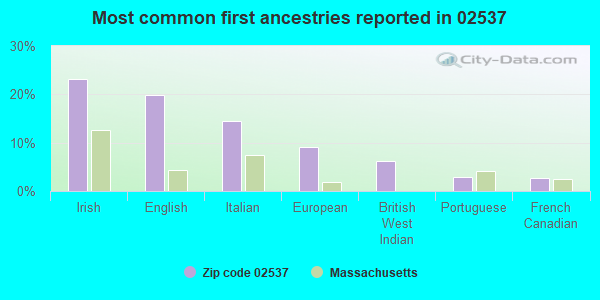
23%Irish
20%English
14%Italian
9%European
6%British West Indian
3%Portuguese
3%French Canadian
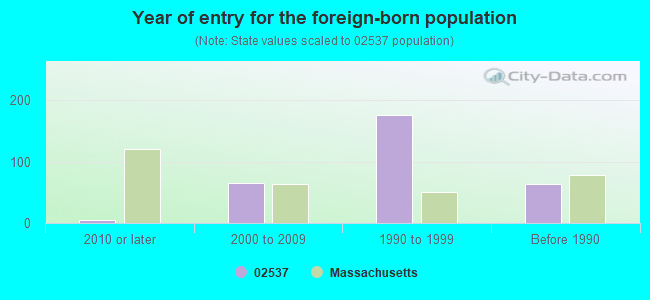
Year of entry for the foreign-born population
52010 or later
662000 to 2009
1761990 to 1999
64Before 1990
Facilities with environmental interests located in this zip code:
OAK RIDGE (260 QUAKER MTG HS RD in EAST SANDWICH, MA)
(National Center for Education Statistics) - STATE ID-261025 Organizations: SANDWICH (SCHOOL DISTRICT)
Housing units lacking complete plumbing facilities: 0.7% Housing units lacking complete kitchen facilities: 0.7%
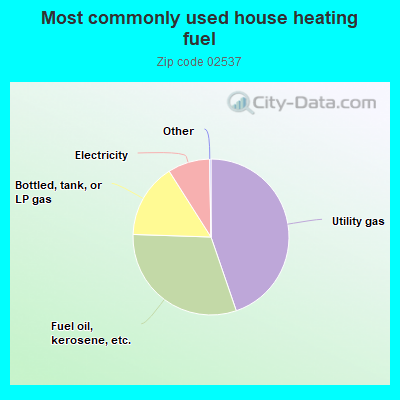
46.2%Utility gas
34.7%Fuel oil, kerosene, etc.
11.2%Bottled, tank, or LP gas
8.0%Electricity
Population in 1990: 7,254.
Place of birth for U.S.-born residents:
This state: 4,361
Northeast: 913
Midwest: 283
South: 349
West: 145
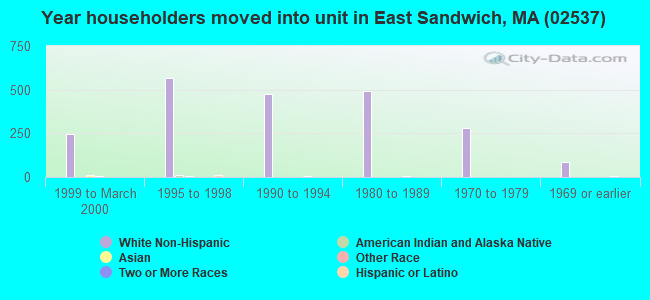
64% of the 02537 zip code residents lived in the same house 5 years ago. Out of people who lived in different houses, 48% lived in this county. Out of people who lived in different counties, 50% lived in Massachusetts.
91% of the 02537 zip code residents lived in the same house 1 year ago. Out of people who lived in different houses, 20% moved from this county. Out of people who lived in different houses, 16% moved from different county within same state. Out of people who lived in different houses, 18% moved from different state. Out of people who lived in different houses, 57% moved from abroad.
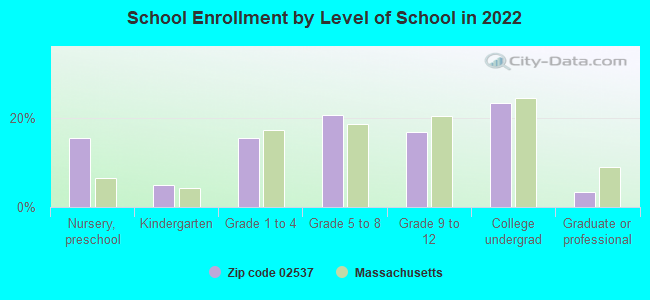
Private vs. public school enrollment:
Students in private schools in grades 1 to 8 (elementary and middle school): 54
Here:
10.9%
Massachusetts:
10.3%
Students in private schools in grades 9 to 12 (high school): 30
Here:
12.9%
Massachusetts:
12.3%
Students in private undergraduate colleges: 98
Here:
30.3%
Massachusetts:
51.2%
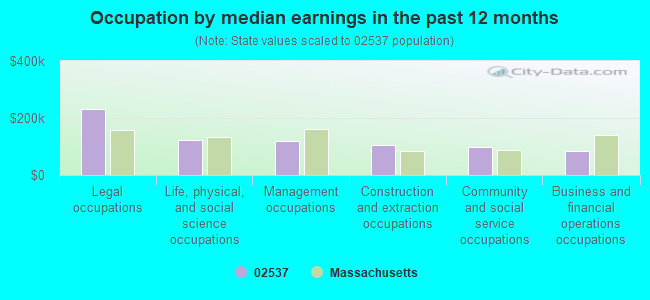
Occupation by median earnings in the past 12 months ($)
240,064Legal occupations
148,494Computer and mathematical occupations
134,537Life, physical, and social science occupations
118,335Management occupations
96,455Business and financial operations occupations
93,468Construction and extraction occupations
Companies with federal contracts located in this zip code:
CASELLA WASTE MANAGEMENT OF CA (295 SERVICE RD in EAST SANDWICH, MA) : $31,692 in 3 contractsfrom 2003 to 2005
$10,696 with U.S. Army Corps of Engineers - civil program financing only for Trash/Garbage Collection Services - Including Portable Sanitation Services. Signed on 2003-03-27. Completion date: 2004-03-31.
$10,498 with Army for Trash/Garbage Collection Services - Including Portable Sanitation Services. Signed on 2005-02-04. Completion date: 2006-03-31.
$10,498 with U.S. Army Corps of Engineers - civil program financing only for Trash/Garbage Collection Services - Including Portable Sanitation Services. Signed on 2005-02-04. Completion date: 2006-03-31.
Top industries in this zip code by the number of employees in 2005:
Health Care and Social Assistance: Specialty (except Psychiatric and Substance Abuse) Hospitals (250-499 employees: 1 establishment)
Educational Services: Elementary and Secondary Schools (100-249: 1, 1-4: 1)
Accommodation and Food Services: Full-Service Restaurants (20-49: 2, 10-19: 1)
Accommodation and Food Services: Food Service Contractors (20-49: 1, 10-19: 1)
Health Care and Social Assistance: Child Day Care Services (10-19: 1, 5-9: 1, 1-4: 1)
Other Services (except Public Administration): Religious Organizations (10-19: 1, 5-9: 1)
Construction: New Single-Family Housing Construction (except Operative Builders) (5-9: 2)
Construction: Painting and Wall Covering Contractors (5-9: 1, 1-4: 2)
People in group quarters in 2010:
168 people in residential schools for people with disabilities
7 people in in-patient hospice facilities
People in group quarters in 2000:
6 people in homes for the mentally retarded
3 people in religious group quarters
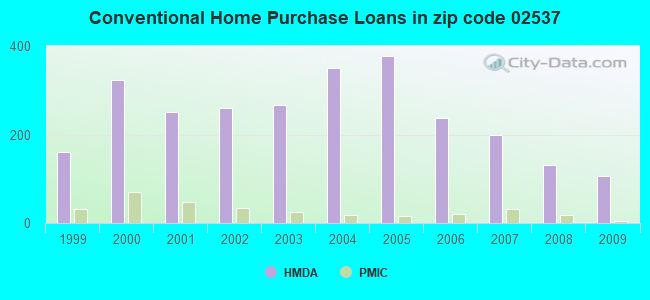
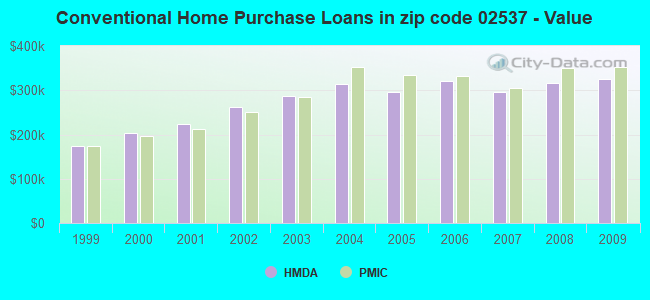
Home Mortgage Disclosure Act Aggregated Statistics For Year 2009 (Based on 4 partial tracts)
A) FHA, FSA/RHS & VA Home Purchase Loans
B) Conventional Home Purchase Loans
C) Refinancings
D) Home Improvement Loans
F) Non-occupant Loans on < 5 Family Dwellings (A B C & D)
G) Loans On Manufactured Home Dwelling (A B C & D)
Number
Average Value
Number
Average Value
Number
Average Value
Number
Average Value
Number
Average Value
Number
Average Value
LOANS ORIGINATED
45
$271,264
107
$326,182
681
$270,037
43
$165,615
134
$343,341
0
$0
APPLICATIONS APPROVED, NOT ACCEPTED
0
$0
6
$423,262
45
$331,882
1
$18,170
10
$411,432
0
$0
APPLICATIONS DENIED
1
$129,930
10
$374,520
125
$324,712
7
$168,116
11
$317,145
1
$13,630
APPLICATIONS WITHDRAWN
0
$0
18
$494,036
72
$285,175
2
$49,975
18
$408,374
0
$0
FILES CLOSED FOR INCOMPLETENESS
0
$0
4
$220,478
28
$269,390
1
$140,830
4
$144,838
0
$0
Aggregated Statistics For Year 2008 (Based on 4 partial tracts)
A) FHA, FSA/RHS & VA Home Purchase Loans
B) Conventional Home Purchase Loans
C) Refinancings
D) Home Improvement Loans
F) Non-occupant Loans on < 5 Family Dwellings (A B C & D)
G) Loans On Manufactured Home Dwelling (A B C & D)
Number
Average Value
Number
Average Value
Number
Average Value
Number
Average Value
Number
Average Value
Number
Average Value
LOANS ORIGINATED
21
$283,372
131
$316,618
296
$275,683
23
$135,475
93
$307,976
0
$0
APPLICATIONS APPROVED, NOT ACCEPTED
0
$0
10
$273,125
44
$331,638
7
$100,573
7
$367,723
0
$0
APPLICATIONS DENIED
3
$229,130
12
$269,155
118
$327,531
19
$53,139
9
$438,654
2
$314,105
APPLICATIONS WITHDRAWN
1
$157,190
13
$242,757
55
$278,451
6
$351,620
10
$358,324
0
$0
FILES CLOSED FOR INCOMPLETENESS
1
$131,750
3
$207,160
21
$283,639
1
$3,630
3
$151,653
0
$0
Aggregated Statistics For Year 2007 (Based on 4 partial tracts)
A) FHA, FSA/RHS & VA Home Purchase Loans
B) Conventional Home Purchase Loans
C) Refinancings
D) Home Improvement Loans
F) Non-occupant Loans on < 5 Family Dwellings (A B C & D)
Number
Average Value
Number
Average Value
Number
Average Value
Number
Average Value
Number
Average Value
LOANS ORIGINATED
2
$253,955
199
$296,615
393
$299,914
64
$119,766
84
$370,570
APPLICATIONS APPROVED, NOT ACCEPTED
1
$318,920
15
$194,449
52
$296,806
8
$118,212
6
$269,397
APPLICATIONS DENIED
0
$0
35
$317,179
174
$345,911
27
$60,146
30
$522,001
APPLICATIONS WITHDRAWN
0
$0
11
$347,715
72
$302,088
11
$318,741
4
$827,852
FILES CLOSED FOR INCOMPLETENESS
0
$0
2
$486,640
27
$359,917
3
$18,173
4
$588,392
Aggregated Statistics For Year 2006 (Based on 4 partial tracts)
A) FHA, FSA/RHS & VA Home Purchase Loans
B) Conventional Home Purchase Loans
C) Refinancings
D) Home Improvement Loans
F) Non-occupant Loans on < 5 Family Dwellings (A B C & D)
G) Loans On Manufactured Home Dwelling (A B C & D)
Number
Average Value
Number
Average Value
Number
Average Value
Number
Average Value
Number
Average Value
Number
Average Value
LOANS ORIGINATED
3
$290,450
238
$321,554
528
$293,619
121
$101,393
118
$368,441
2
$35,390
APPLICATIONS APPROVED, NOT ACCEPTED
0
$0
25
$310,674
76
$263,885
16
$167,592
10
$320,597
0
$0
APPLICATIONS DENIED
0
$0
31
$337,794
186
$286,574
35
$53,521
32
$323,073
2
$39,815
APPLICATIONS WITHDRAWN
1
$270,760
8
$403,455
109
$247,766
8
$93,402
12
$222,527
0
$0
FILES CLOSED FOR INCOMPLETENESS
0
$0
3
$383,493
33
$354,280
3
$34,450
0
$0
0
$0
Aggregated Statistics For Year 2005 (Based on 4 partial tracts)
A) FHA, FSA/RHS & VA Home Purchase Loans
B) Conventional Home Purchase Loans
C) Refinancings
D) Home Improvement Loans
F) Non-occupant Loans on < 5 Family Dwellings (A B C & D)
G) Loans On Manufactured Home Dwelling (A B C & D)
Number
Average Value
Number
Average Value
Number
Average Value
Number
Average Value
Number
Average Value
Number
Average Value
LOANS ORIGINATED
4
$288,480
377
$295,503
600
$272,838
97
$215,777
125
$330,837
1
$36,340
APPLICATIONS APPROVED, NOT ACCEPTED
0
$0
34
$274,466
57
$241,781
15
$85,935
12
$169,676
0
$0
APPLICATIONS DENIED
2
$292,570
49
$344,725
162
$323,026
38
$100,390
29
$370,751
0
$0
APPLICATIONS WITHDRAWN
0
$0
47
$268,214
191
$293,414
21
$209,854
18
$281,708
0
$0
FILES CLOSED FOR INCOMPLETENESS
0
$0
6
$194,665
23
$307,290
3
$42,963
1
$371,620
1
$372,530
Aggregated Statistics For Year 2004 (Based on 4 partial tracts)
A) FHA, FSA/RHS & VA Home Purchase Loans
B) Conventional Home Purchase Loans
C) Refinancings
D) Home Improvement Loans
F) Non-occupant Loans on < 5 Family Dwellings (A B C & D)
Number
Average Value
Number
Average Value
Number
Average Value
Number
Average Value
Number
Average Value
LOANS ORIGINATED
1
$278,030
351
$314,215
653
$258,736
70
$124,041
126
$348,945
APPLICATIONS APPROVED, NOT ACCEPTED
1
$127,200
36
$316,933
60
$281,514
8
$60,438
13
$342,635
APPLICATIONS DENIED
3
$215,473
47
$345,935
124
$293,138
24
$136,937
12
$584,007
APPLICATIONS WITHDRAWN
0
$0
29
$294,221
159
$259,996
22
$90,387
8
$297,208
FILES CLOSED FOR INCOMPLETENESS
0
$0
13
$212,952
44
$266,330
4
$93,422
4
$315,745
Aggregated Statistics For Year 2003 (Based on 4 partial tracts)
A) FHA, FSA/RHS & VA Home Purchase Loans
B) Conventional Home Purchase Loans
C) Refinancings
D) Home Improvement Loans
E) Loans on Dwellings For 5+ Families
F) Non-occupant Loans on < 5 Family Dwellings (A B C & D)
Number
Average Value
Number
Average Value
Number
Average Value
Number
Average Value
Number
Average Value
Number
Average Value
LOANS ORIGINATED
5
$247,474
267
$286,262
1,735
$206,379
32
$82,866
4
$409,220
184
$201,909
APPLICATIONS APPROVED, NOT ACCEPTED
0
$0
37
$244,774
199
$203,415
11
$33,677
0
$0
24
$210,734
APPLICATIONS DENIED
0
$0
29
$194,164
200
$233,613
22
$65,145
0
$0
19
$223,668
APPLICATIONS WITHDRAWN
0
$0
21
$255,261
196
$211,689
4
$34,980
0
$0
10
$175,309
FILES CLOSED FOR INCOMPLETENESS
1
$155,370
4
$234,205
25
$217,769
0
$0
0
$0
6
$220,672
Aggregated Statistics For Year 2002 (Based on 4 partial tracts)
A) FHA, FSA/RHS & VA Home Purchase Loans
B) Conventional Home Purchase Loans
C) Refinancings
D) Home Improvement Loans
F) Non-occupant Loans on < 5 Family Dwellings (A B C & D)
Number
Average Value
Number
Average Value
Number
Average Value
Number
Average Value
Number
Average Value
LOANS ORIGINATED
3
$204,737
261
$261,063
1,308
$197,684
59
$51,639
177
$243,671
APPLICATIONS APPROVED, NOT ACCEPTED
0
$0
30
$215,964
106
$210,012
22
$63,265
14
$152,192
APPLICATIONS DENIED
0
$0
14
$176,711
134
$186,465
29
$56,357
12
$206,243
APPLICATIONS WITHDRAWN
0
$0
19
$206,616
143
$278,467
15
$40,080
12
$199,424
FILES CLOSED FOR INCOMPLETENESS
0
$0
6
$223,427
21
$177,979
3
$62,253
1
$84,500
Aggregated Statistics For Year 2001 (Based on 4 partial tracts)
A) FHA, FSA/RHS & VA Home Purchase Loans
B) Conventional Home Purchase Loans
C) Refinancings
D) Home Improvement Loans
E) Loans on Dwellings For 5+ Families
F) Non-occupant Loans on < 5 Family Dwellings (A B C & D)
Number
Average Value
Number
Average Value
Number
Average Value
Number
Average Value
Number
Average Value
Number
Average Value
LOANS ORIGINATED
7
$175,671
251
$223,759
1,009
$179,767
61
$37,304
4
$377,810
110
$194,634
APPLICATIONS APPROVED, NOT ACCEPTED
2
$134,490
19
$259,777
70
$170,268
13
$39,429
0
$0
8
$204,081
APPLICATIONS DENIED
0
$0
17
$288,439
84
$171,862
31
$64,100
0
$0
9
$288,466
APPLICATIONS WITHDRAWN
0
$0
18
$215,765
115
$165,253
14
$55,329
0
$0
6
$222,962
FILES CLOSED FOR INCOMPLETENESS
0
$0
2
$238,895
16
$170,563
3
$131,363
0
$0
3
$195,607
Aggregated Statistics For Year 2000 (Based on 4 partial tracts)
A) FHA, FSA/RHS & VA Home Purchase Loans
B) Conventional Home Purchase Loans
C) Refinancings
D) Home Improvement Loans
E) Loans on Dwellings For 5+ Families
F) Non-occupant Loans on < 5 Family Dwellings (A B C & D)
Number
Average Value
Number
Average Value
Number
Average Value
Number
Average Value
Number
Average Value
Number
Average Value
LOANS ORIGINATED
7
$154,333
323
$202,967
219
$147,742
84
$33,104
0
$0
68
$195,772
APPLICATIONS APPROVED, NOT ACCEPTED
0
$0
31
$189,779
27
$151,758
21
$49,579
0
$0
11
$199,818
APPLICATIONS DENIED
2
$131,745
16
$164,604
75
$118,821
37
$36,335
0
$0
4
$163,688
APPLICATIONS WITHDRAWN
0
$0
18
$227,278
81
$108,246
4
$57,822
1
$11,810
3
$319,910
FILES CLOSED FOR INCOMPLETENESS
0
$0
4
$157,532
11
$233,450
2
$15,925
0
$0
2
$244,205
Aggregated Statistics For Year 1999 (Based on 2 partial tracts)
A) FHA, FSA/RHS & VA Home Purchase Loans
B) Conventional Home Purchase Loans
C) Refinancings
D) Home Improvement Loans
F) Non-occupant Loans on < 5 Family Dwellings (A B C & D)
Detailed PMIC statistics for the following Tracts:0134.00
, 0135.00
2002 - 2018 National Fire Incident Reporting System (NFIRS) incidents
According to the data from the years 2002 - 2018 the average number of fire incidents per year is 31. The highest number of reported fires - 46 took place in 2005, and the least - 8 in 2015. The data has a declining trend.
When looking into fire subcategories, the most incidents belonged to: Structure Fires (60.1%), and Outside Fires (26.8%).
Fire incident types reported to NFIRS in Zip Code 02537


 Nearest zip codes: 02563, 02648, 02668, 02644, 02635, 02655.


 According to the data from the years 2002 - 2018 the average number of fire incidents per year is 31. The highest number of reported fires - 46 took place in 2005, and the least - 8 in 2015. The data has a declining trend.
 When looking into fire subcategories, the most incidents belonged to: Structure Fires (60.1%), and Outside Fires (26.8%).