Estimated zip code population in 2022: 4,404 Zip code population in 2010: 3,754 Zip code population in 2000: 3,196
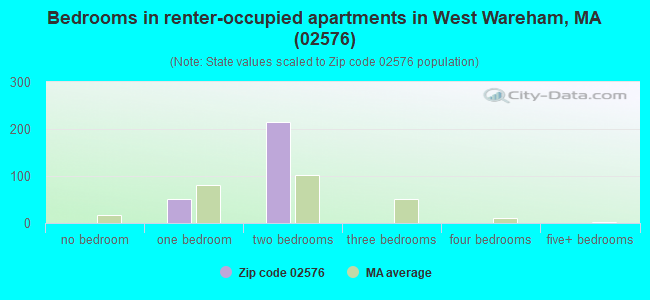
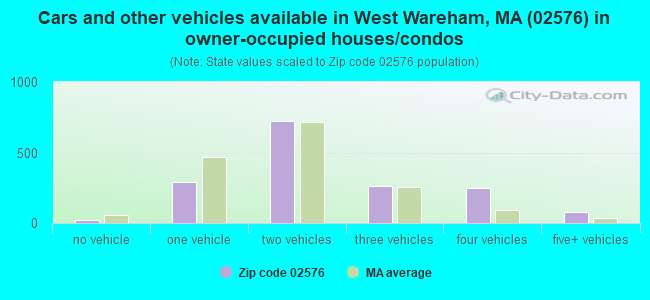
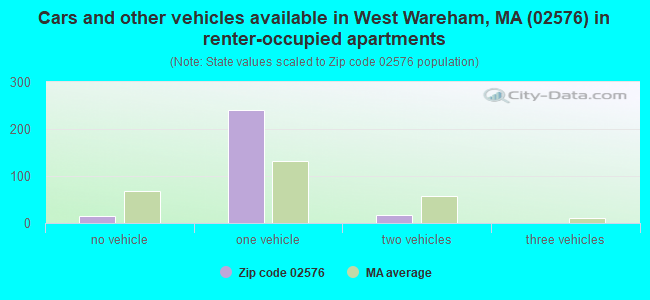
Houses and condos: 2,034 Renter-occupied apartments: 268
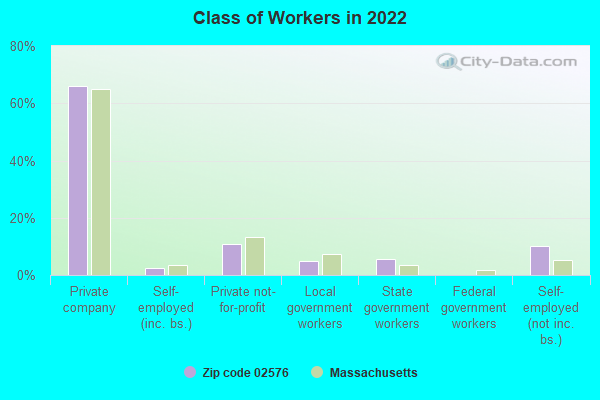
% of renters here:
14%
State:
38%
March 2022 cost of living index in zip code 02576: 133.1 (high, U.S. average is 100)
Land area: 9.8 sq. mi. Water area: 0.4 sq. mi.
Population density: 451 people per square mile
(low).
OSM Map
Google Map
MSN Map
OSM Map
General Map
Google Map
MSN Map
OSM Map
Google Map
MSN Map
OSM Map
Google Map
MSN Map
Please wait while loading the map...
Real estate property taxes paid for housing units in 2022:
This zip code:
1.2% ($4,219)
Massachusetts:
1.0% ($5,536)
Median real estate property taxes paid for housing units with mortgages in 2022: $4,217 (1.0%) Median real estate property taxes paid for housing units with no mortgage in 2022: $4,224 (2.0%)
Business Search- 14 Million verified businesses
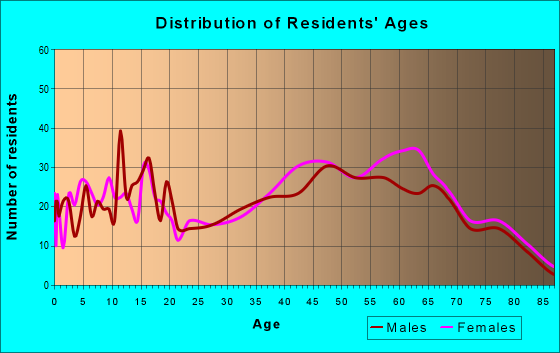
Males: 1,934
(43.9%)
Females: 2,470
(56.1%)
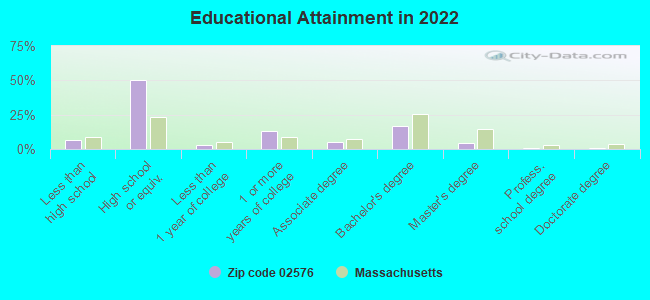
For population 25 years and over in 02576:
High school or higher: 92.5%
Bachelor's degree or higher: 21.7%
Graduate or professional degree: 5.2%
Unemployed: 2.2%
Mean travel time to work (commute): 29.1 minutes
For population 15 years and over in 02576:
Never married: 36.5%
Now married: 39.4%
Separated: 0.6%
Widowed: 10.1%
Divorced: 13.4%
Zip code 02576 compared to state average:
Median household income below state average.
Median house value below state average.
Unemployed percentage below state average.
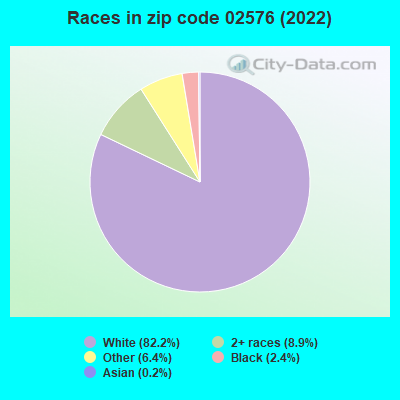
Black race population percentage below state average.
Hispanic race population percentage significantly below state average.
Median age significantly above state average.
Foreign-born population percentage below state average.
Renting percentage significantly below state average.
House age below state average.
Percentage of population with a bachelor's degree or higher below state average.
Estimated median house/condo value in 2022: $349,174
02576:
$349,174
Massachusetts:
$534,700
According to our research of Massachusetts and other state lists, there were 2 registered sex offenders living in 02576 zip code as of May 28, 2024. The ratio of all residents to sex offenders in zip code 02576 is 2,650 to 1. The ratio of registered sex offenders to all residents in this zip code is lower than the state average.
Median resident age:
This zip code:
49.3 years
Massachusetts median age:
40.3 years
Average household size:
This zip code:
2.3 people
Massachusetts:
2.4 people
Averages for the 2020 tax year for zip code 02576, filed in 2021:
Average Adjusted Gross Income (AGI) in 2020: $61,481 (Individual Income Tax Returns)
Here:
$61,481
State:
$105,130
Salary/wage: $54,818 (reported on 78.6% of returns)
Here:
$54,818
State:
$82,951
(% of AGI for various income ranges: 1081.4% for AGIs below $25k, 3356.0% for AGIs $25k-50k, 5992.1% for AGIs $50k-75k, 8751.2% for AGIs $75k-100k, 18095.0% for AGIs $100k-200k, 57310.0% for AGIs over 200k)
Taxable interest for individuals: $785 (reported on 29.8% of returns)
This zip code:
$785
Massachusetts:
$2,361
(% of AGI for various income ranges: 19.3% for AGIs below $25k, 20.0% for AGIs $25k-50k, 12.8% for AGIs $50k-75k, 28.1% for AGIs $75k-100k, 85.0% for AGIs $100k-200k, 565.0% for AGIs over 200k)
Ordinary dividends: $2,930 (reported on 15.5% of returns)
Here:
$2,930
State:
$10,365
(% of AGI for various income ranges: 34.3% for AGIs below $25k, 22.7% for AGIs $25k-50k, 59.3% for AGIs $50k-75k, 43.1% for AGIs $75k-100k, 99.1% for AGIs $100k-200k, 1860.0% for AGIs over 200k)
Net capital gain/loss in AGI: +$5,077 (reported on 12.6% of returns)
Here:
+$5,077
State:
+$48,178
(% of AGI for various income ranges: 18.4% for AGIs below $25k, 30.9% for AGIs $25k-50k, 52.4% for AGIs $50k-75k, 136.2% for AGIs $75k-100k, 239.1% for AGIs $100k-200k, 2035.0% for AGIs over 200k)
Profit/loss from business: +$18,313 (reported on 12.6% of returns)
Here:
+$18,313
State:
+$20,792
(% of AGI for various income ranges: 67.3% for AGIs below $25k, 224.2% for AGIs $25k-50k, 265.2% for AGIs $50k-75k, 311.2% for AGIs $75k-100k, 1328.2% for AGIs $100k-200k)
Taxable individual retirement arrangement distribution: $16,496 (reported on 9.7% of returns)
02576:
$16,496
Massachusetts:
$22,790
(% of AGI for various income ranges: 72.3% for AGIs below $25k, 128.9% for AGIs $25k-50k, 260.0% for AGIs $50k-75k, 188.8% for AGIs $75k-100k, 836.4% for AGIs $100k-200k)
Total itemized deductions: $24,678 (reported on 9.7% of returns)
Here:
$24,678
State:
$36,722
(% of AGI for various income ranges: 118.7% for AGIs $25k-50k, 451.7% for AGIs $50k-75k, 605.6% for AGIs $75k-100k, 995.9% for AGIs $100k-200k, 3360.0% for AGIs over 200k)
Charity contributions: $2,606 (reported on 6.7% of returns)
Here:
$2,606
State:
$12,529
(% of AGI for various income ranges: 21.4% for AGIs $50k-75k, 31.2% for AGIs $75k-100k, 138.6% for AGIs $100k-200k)
Taxes paid: $7,713 (reported on 9.7% of returns)
02576:
$7,713
State:
$8,782
(% of AGI for various income ranges: 29.5% for AGIs below $25k, 111.7% for AGIs $50k-75k, 230.6% for AGIs $75k-100k, 343.6% for AGIs $100k-200k, 975.0% for AGIs over 200k)
Earned income credit: $1,848 (reported on 9.7% of returns)
Here:
$1,848
State:
$1,909
(% of AGI for various income ranges: 50.5% for AGIs below $25k, 45.1% for AGIs $25k-50k)
Percentage of individuals using paid preparers for their 2020 taxes: 93.3%
Here:
93%
State:
92%
(% for various income ranges: 92.5% for AGIs below $25k, 93.4% for AGIs $25k-50k, 92.9% for AGIs $50k-75k, 91.3% for AGIs $75k-100k, 94.9% for AGIs $100k-200k, 100.0% for AGIs over 200k)
Averages for the 2012 tax year for zip code 02576, filed in 2013:
Average Adjusted Gross Income (AGI) in 2012: $52,940 (Individual Income Tax Returns)
Here:
$52,940
State:
$81,425
Salary/wage: $46,568 (reported on 83.2% of returns)
Here:
$46,568
State:
$64,752
(% of AGI for various income ranges: 69.0% for AGIs below $25k, 75.1% for AGIs $25k-50k, 74.4% for AGIs $50k-75k, 82.1% for AGIs $75k-100k, 82.5% for AGIs $100k-200k, 37.9% for AGIs over 200k)
Taxable interest for individuals: $678 (reported on 33.6% of returns)
This zip code:
$678
Massachusetts:
$2,136
(% of AGI for various income ranges: 0.9% for AGIs below $25k, 0.4% for AGIs $25k-50k, 0.3% for AGIs $50k-75k, 0.2% for AGIs $100k-200k, 1.3% for AGIs over 200k)
Ordinary dividends: $1,518 (reported on 17.8% of returns)
Here:
$1,518
State:
$9,473
(% of AGI for various income ranges: 0.9% for AGIs below $25k, 0.6% for AGIs $25k-50k, 0.2% for AGIs $50k-75k, 0.3% for AGIs $75k-100k, 0.4% for AGIs $100k-200k, 1.0% for AGIs over 200k)
Net capital gain/loss in AGI: +$4,005 (reported on 10.3% of returns)
Here:
+$4,005
State:
+$31,437
(% of AGI for various income ranges: 2.9% for AGIs $100k-200k)
Profit/loss from business: +$13,631 (reported on 13.6% of returns)
Here:
+$13,631
State:
+$20,662
(% of AGI for various income ranges: 7.2% for AGIs below $25k, 4.2% for AGIs $25k-50k, 3.6% for AGIs $50k-75k, 3.4% for AGIs $75k-100k, 3.4% for AGIs $100k-200k)
Taxable individual retirement arrangement distribution: $13,452 (reported on 9.8% of returns)
02576:
$13,452
Massachusetts:
$18,892
(% of AGI for various income ranges: 3.7% for AGIs below $25k, 2.4% for AGIs $25k-50k, 3.1% for AGIs $50k-75k, 4.4% for AGIs $100k-200k)
Total itemized deductions: $20,167 (22% of AGI, reported on 35.0% of returns)
Here:
$20,167
State:
$28,907
Here:
21.9% of AGI
State:
18.2% of AGI
(% of AGI for various income ranges: 8.4% for AGIs below $25k, 10.1% for AGIs $25k-50k, 14.0% for AGIs $50k-75k, 15.4% for AGIs $75k-100k, 16.5% for AGIs $100k-200k, 10.5% for AGIs over 200k)
Charity contributions: $1,486 (reported on 26.2% of returns)
Here:
$1,486
State:
$4,208
(% of AGI for various income ranges: 0.6% for AGIs below $25k, 0.7% for AGIs $25k-50k, 0.7% for AGIs $50k-75k, 0.8% for AGIs $75k-100k, 0.9% for AGIs $100k-200k, 0.5% for AGIs over 200k)
Taxes paid: $7,904 (reported on 35.0% of returns)
02576:
$7,904
State:
$13,303
(% of AGI for various income ranges: 2.5% for AGIs below $25k, 3.1% for AGIs $25k-50k, 4.7% for AGIs $50k-75k, 6.1% for AGIs $75k-100k, 7.2% for AGIs $100k-200k, 5.3% for AGIs over 200k)
Earned income credit: $1,900 (reported on 12.6% of returns)
Here:
$1,900
State:
$1,971
(% of AGI for various income ranges: 3.7% for AGIs below $25k, 0.9% for AGIs $25k-50k)
Percentage of individuals using paid preparers for their 2012 taxes: 59.3%
Here:
59%
State:
56%
(% for various income ranges: 53.3% for AGIs below $25k, 58.9% for AGIs $25k-50k, 61.8% for AGIs $50k-75k, 71.4% for AGIs $75k-100k, 66.7% for AGIs $100k-200k, 50.0% for AGIs over 200k)
Averages for the 2004 tax year for zip code 02576, filed in 2005:
Average Adjusted Gross Income (AGI) in 2004: $43,902 (Individual Income Tax Returns)
Here:
$43,902
State:
$62,877
Salary/wage: $40,201 (reported on 84.8% of returns)
Here:
$40,201
State:
$52,969
(% of AGI for various income ranges: 110.2% for AGIs below $10k, 68.6% for AGIs $10k-25k, 79.9% for AGIs $25k-50k, 82.1% for AGIs $50k-75k, 85.5% for AGIs $75k-100k, 67.3% for AGIs over 100k)
Taxable interest for individuals: $827 (reported on 52.4% of returns)
This zip code:
$827
Massachusetts:
$1,945
(% of AGI for various income ranges: 7.5% for AGIs below $10k, 2.4% for AGIs $10k-25k, 1.2% for AGIs $25k-50k, 0.8% for AGIs $50k-75k, 0.3% for AGIs $75k-100k, 0.6% for AGIs over 100k)
Taxable dividends: $982 (reported on 20.2% of returns)
Here:
$982
State:
$5,323
(% of AGI for various income ranges: 3.8% for AGIs below $10k, 1.0% for AGIs $10k-25k, 0.3% for AGIs $25k-50k, 0.4% for AGIs $50k-75k, 0.7% for AGIs $75k-100k, 0.1% for AGIs over 100k)
Net capital gain/loss: +$7,391 (reported on 12.2% of returns)
Here:
+$7,391
State:
+$20,377
(% of AGI for various income ranges: 3.1% for AGIs below $10k, 0.0% for AGIs $10k-25k, 0.3% for AGIs $25k-50k, -0.1% for AGIs $50k-75k, 1.0% for AGIs $75k-100k, 7.1% for AGIs over 100k)
Profit/loss from business: +$13,747 (reported on 14.4% of returns)
Here:
+$13,747
State:
+$17,837
(% of AGI for various income ranges: 15.1% for AGIs below $10k, 5.3% for AGIs $10k-25k, 5.1% for AGIs $25k-50k, 5.6% for AGIs $50k-75k, 3.1% for AGIs $75k-100k, 3.1% for AGIs over 100k)
IRA payment deduction: $2,556 (reported on 2.8% of returns)
02576:
$2,556
Massachusetts:
$3,100
Total itemized deductions: $16,372 (23% of AGI, reported on 39.5% of returns)
Here:
$16,372
State:
$22,573
Here:
22.7% of AGI
State:
19.5% of AGI
(% of AGI for various income ranges: 22.5% for AGIs below $10k, 8.1% for AGIs $10k-25k, 12.7% for AGIs $25k-50k, 17.2% for AGIs $50k-75k, 17.2% for AGIs $75k-100k, 14.5% for AGIs over 100k)
Charity contributions deductions: $1,332 (2% of AGI, reported on 34.8% of returns)
Here:
$1,332
State:
$3,295
Here:
1.8% of AGI
State:
2.7% of AGI
(% of AGI for various income ranges: 1.4% for AGIs below $10k, 0.5% for AGIs $10k-25k, 0.9% for AGIs $25k-50k, 1.4% for AGIs $50k-75k, 1.4% for AGIs $75k-100k, 0.9% for AGIs over 100k)
Total tax: $5,734 (reported on 82.9% of returns)
02576:
$5,734
State:
$11,494
(% of AGI for various income ranges: 4.1% for AGIs below $10k, 4.6% for AGIs $10k-25k, 8.3% for AGIs $25k-50k, 9.5% for AGIs $50k-75k, 10.4% for AGIs $75k-100k, 17.1% for AGIs over 100k)
Earned income credit: $1,556 (reported on 9.3% of returns)
Here:
$1,556
State:
$1,518
Percentage of individuals using paid preparers for their 2004 taxes: 60.3%
Here:
60%
State:
58%
(% for various income ranges: 48.1% for AGIs below $10k, 60.7% for AGIs $10k-25k, 60.5% for AGIs $25k-50k, 66.0% for AGIs $50k-75k, 64.8% for AGIs $75k-100k, 66.9% for AGIs over 100k)
Household received Food Stamps/SNAP in the past 12 months: 615 Household did not receive Food Stamps/SNAP in the past 12 months: 1,340
Women who had a birth in the past 12 months: 19 (0 now married, 16 unmarried) Women who did not have a birth in the past 12 months: 921 (171 now married, 760 unmarried)
Housing units in zip code 02576 with a mortgage: 919 (93 second mortgage, 89 both second mortgage and home equity loan) Houses without a mortgage: 19
Median monthly owner costs for units with a mortgage: $2,076 Median monthly owner costs for units without a mortgage: $768
Residents with income below the poverty level in 2022:
This zip code:
11.6%
Whole state:
10.4%
Residents with income below 50% of the poverty level in 2022:
This zip code:
5.7%
Whole state:
5.1%
Median number of rooms in houses and condos:
Here:
5.2
State:
6.5
Median number of rooms in apartments:
Here:
4.4
State:
4.0
Notable locations in this zip code not listed on our city pages
Reservoirs and swamps: Tremont Mill Pond (A), Rose Brook Reservoir (B), Horseshoe Pond (C), Blackmore Pond (D), Sippican River Marshes (E). Display/hide their locations on the map
In group quarters: 2 (-1 institutionalized population)
Size of family households: 604 2-persons, 311 3-persons, 287 4-persons, 71 5-persons, 13 6-persons
Size of nonfamily households: 512 1-person, 77 2-persons, 10 3-persons
222 married couples with children.
332 single-parent households (70 men, 262 women).
90.6% of residents of 02576 zip code speak English at home.
8.9% of residents speak other Indo-European language at home (94% very well, 6% well).
0.2% of residents speak Asian or Pacific Island language at home (100% very well).
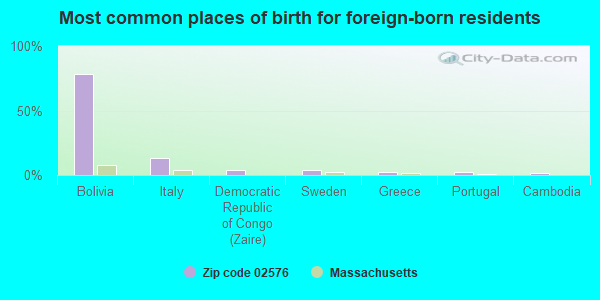
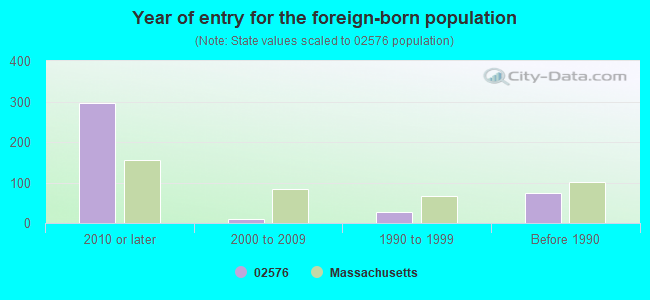
Foreign born population: 382 (8.7%) (74.8% of them are naturalized citizens)
This zip code:
8.7%
Whole state:
18.0%
79%Bolivia
13%Italy
4%Democratic Republic of Congo (Zaire)
4%Sweden
3%Greece
3%Portugal
2%Cambodia
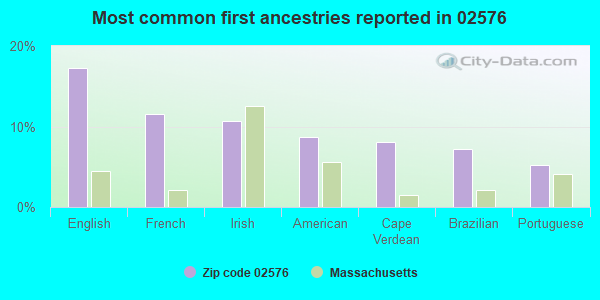
17%English
11%French
11%Irish
9%American
8%Cape Verdean
7%Brazilian
5%Portuguese
Year of entry for the foreign-born population
2962010 or later
92000 to 2009
281990 to 1999
73Before 1990
Facilities with environmental interests located in this zip code:
CAPE COD CARTAGE INC (2381 CRANBERRY HIGHWAY in WEST WAREHAM, MA)
(Resource Conservation and Recovery Act (tracking hazardous waste)) Small Quantity Generators, between 100 kg and 1000 kg of hazardous waste/month (Resource Conservation and Recovery Act (tracking hazardous waste)) - notification Organizations: GAULT TRANSPORTATION INC (CONTACT/OWNER)
, LAWRENCE F NOONAN PRES (CONTACT/OWNER)
Alternative names: GAULT TRANSPORTATION INC
7 ELEVEN INC (2196 CRANBERRY HWY in WEST WAREHAM, MA)
Conditionally Exempt Small Quantity Generators, less than 100 kg/month of hazardous waste (Resource Conservation and Recovery Act (tracking hazardous waste)) - notification Organizations: 7-ELEVEN INC (CONTACT/OPERATOR)
, CHRISTYS MARKET INC (CONTACT/OWNER)
Alternative names: 7 ELEVEN 32566
AUTO CENTER (2343 CRANBERRY HWY in WEST WAREHAM, MA)
Conditionally Exempt Small Quantity Generators, less than 100 kg/month of hazardous waste (Resource Conservation and Recovery Act (tracking hazardous waste)) - notification Organizations: DAVIED W RUTLEDGE (CONTACT/OWNER)
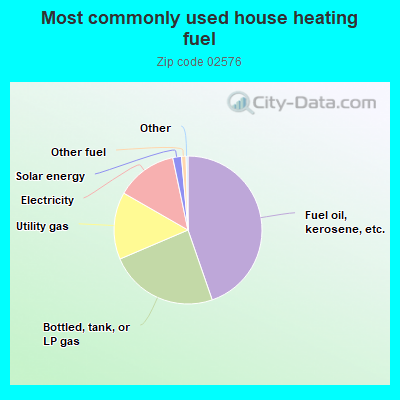
44.7%Fuel oil, kerosene, etc.
23.9%Bottled, tank, or LP gas
14.7%Utility gas
13.4%Electricity
1.9%Solar energy
1.0%Other fuel
Population in 1990: 3,919.
Place of birth for U.S.-born residents:
This state: 3,440
Northeast: 330
Midwest: 68
South: 82
West: 73
69% of the 02576 zip code residents lived in the same house 5 years ago. Out of people who lived in different houses, 53% lived in this county. Out of people who lived in different counties, 50% lived in Massachusetts.
83% of the 02576 zip code residents lived in the same house 1 year ago. Out of people who lived in different houses, 82% moved from this county. Out of people who lived in different houses, 4% moved from different county within same state. Out of people who lived in different houses, 5% moved from different state.
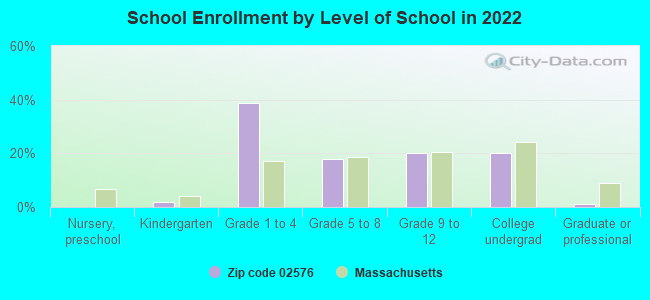
Private vs. public school enrollment:
Students in private schools in grades 1 to 8 (elementary and middle school):
Here:
0.0%
Massachusetts:
10.3%
Students in private schools in grades 9 to 12 (high school):
Here:
0.0%
Massachusetts:
12.3%
Students in private undergraduate colleges: 42
Here:
24.4%
Massachusetts:
51.2%
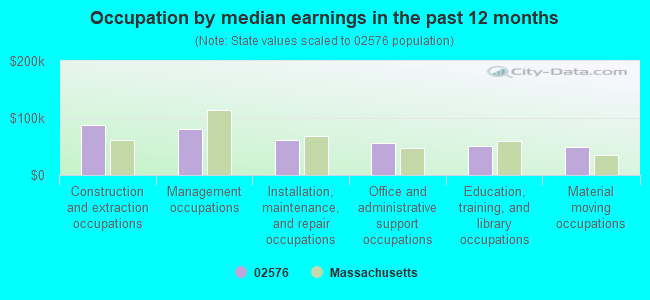
Occupation by median earnings in the past 12 months ($)
87,350Construction and extraction occupations
80,284Management occupations
61,452Installation, maintenance, and repair occupations
55,994Office and administrative support occupations
50,530Education, training, and library occupations
49,051Material moving occupations
Companies with federal contracts located in this zip code:
PHOENIX INNOVATION, INC (20 PATTERSON BROOK ROAD in WEST WAREHAM, MA; small business) : $2,856,195 in 12 contractsfrom 2000 to 2004
Contracts for Other Defense -- Operational Systems Development (R&D), Engineering -- Basic Research (R&D), Defense Aircraft -- Management and Support (R&D), Defense Aircraft -- Applied Research and Exploratory Development (R&D), and moreby Navy, Air Force Signed by year:2000: $64,614; 2001: $509,700; 2002: $1,362,238; 2003: $99,980; 2004: $819,663; 2005: $0; 2006: $0.
Biggest contracts:
$749,749 with Navy for Other Defense -- Operational Systems Development (R&D). Signed on 2004-03-15. Completion date: 2006-03-14.
$746,390 with Navy for Engineering -- Basic Research (R&D). Signed on 2002-09-20. Completion date: 2004-09-19.
$377,999 with Air Force for Defense Aircraft -- Management and Support (R&D). Signed on 2002-08-06. Completion date: 2004-11-30.
$310,364 with Air Force for Defense Aircraft -- Applied Research and Exploratory Development (R&D). Signed on 2001-06-27. Completion date: 2003-08-30.
CAPEWAY FRAME & TRAILER, INC (2381 CRANBERRY HWY in WEST WAREHAM, MA; small business) : $264,950 in 22 contractsfrom 2000 to 2006
Contracts for Ground Effect Vehicles, Maintenance, Repair or Alteration of Real Property -- EPG Facilities - Geothermal, Miscellaneous Vehicular Components, Modification of Equipment -- Special Industry Machinery, and moreby Army Signed by year:2000: $47,180; 2001: $0; 2002: $0; 2003: $0; 2004: $114,996; 2005: $98,710; 2006: $4,064.
Biggest contracts:
$91,000 with Army for Ground Effect Vehicles. Signed on 2005-07-27. Completion date: 2005-09-30.
$47,180 with Army for Maintenance, Repair or Alteration of Real Property -- EPG Facilities - Geothermal. Signed on 2000-04-18. Completion date: 2000-12-31.
$12,500 with Army for Miscellaneous Vehicular Components. Signed on 2004-09-27. Completion date: 2004-09-30.
$10,710, same as above.Signed on 2004-12-10. Completion date: 2005-09-30.
EUROPEAN CUSTOM YACHTS LTD (2358 CRANBERRY HIGHWAY in WEST WAREHAM, MA; small business) : $128,269 in 2 contractsin 2000
$84,165 with Navy for Non-nuclear Ship Repair (East) Ship repair (including overhauls and conversions) performed on non-nuclear propelled and nonpropelled ships east of the 108th meridian. Signed on 2000-05-31. Completion date: 2000-07-31.
$44,104, same as above.Signed on 2000-08-02. Completion date: 2000-11-01.
Top industries in this zip code by the number of employees in 2005:
Wholesale Trade: Metal Service Centers and Other Metal Merchant Wholesalers (50-99 employees: 1 establishment, 5-9 employees: 1 establishment)
Wholesale Trade: Transportation Equipment and Supplies (except Motor Vehicle) Merchant Wholesalers (50-99: 1)
Accommodation and Food Services: Snack and Nonalcoholic Beverage Bars (20-49: 1)
Accommodation and Food Services: Full-Service Restaurants (20-49: 1)
Professional, Scientific, and Technical Services: Environmental Consulting Services (20-49: 1)
Fatal accident statistics in 2014:
Fatal accident count: 1
Vehicles involved in fatal accidents: 1
Fatal accidents caused by drunken drivers: 0
Fatalities: 1
Persons involved in fatal accidents: 2
Pedestrians involved in fatal accidents: 0
Fatal accident statistics in 2010:
Fatal accident count: 1
Vehicles involved in fatal accidents: 1
Fatal accidents caused by drunken drivers: 0
Fatalities: 1
Persons involved in fatal accidents: 1
Pedestrians involved in fatal accidents: 0
Home Mortgage Disclosure Act Aggregated Statistics For Year 2009 (Based on 2 partial tracts)
A) FHA, FSA/RHS & VA Home Purchase Loans
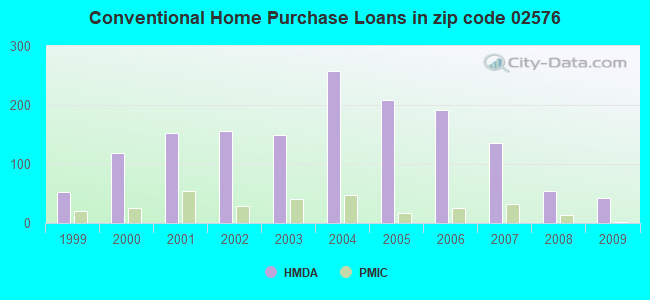
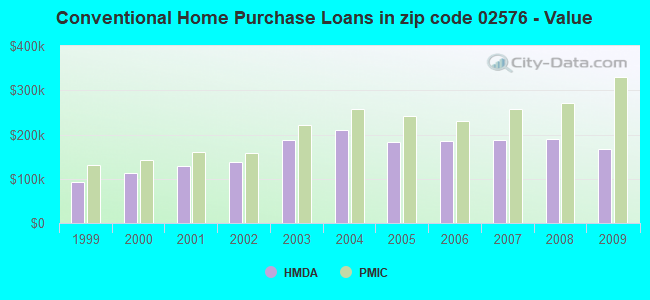
B) Conventional Home Purchase Loans
C) Refinancings
D) Home Improvement Loans
F) Non-occupant Loans on < 5 Family Dwellings (A B C & D)
G) Loans On Manufactured Home Dwelling (A B C & D)
Number
Average Value
Number
Average Value
Number
Average Value
Number
Average Value
Number
Average Value
Number
Average Value
LOANS ORIGINATED
46
$206,900
43
$167,407
231
$200,777
17
$147,685
26
$232,618
1
$34,730
APPLICATIONS APPROVED, NOT ACCEPTED
1
$225,080
3
$106,983
15
$258,613
0
$0
1
$275,100
1
$45,850
APPLICATIONS DENIED
18
$194,130
8
$207,368
61
$230,435
8
$122,615
4
$188,958
1
$131,990
APPLICATIONS WITHDRAWN
4
$196,252
10
$131,715
33
$227,735
3
$61,597
6
$201,232
0
$0
FILES CLOSED FOR INCOMPLETENESS
1
$220,910
0
$0
14
$196,699
0
$0
0
$0
0
$0
Aggregated Statistics For Year 2008 (Based on 2 partial tracts)
A) FHA, FSA/RHS & VA Home Purchase Loans
B) Conventional Home Purchase Loans
C) Refinancings
D) Home Improvement Loans
F) Non-occupant Loans on < 5 Family Dwellings (A B C & D)
G) Loans On Manufactured Home Dwelling (A B C & D)
Number
Average Value
Number
Average Value
Number
Average Value
Number
Average Value
Number
Average Value
Number
Average Value
LOANS ORIGINATED
11
$228,619
54
$189,705
142
$206,326
22
$50,460
26
$194,302
14
$45,949
APPLICATIONS APPROVED, NOT ACCEPTED
1
$261,210
14
$125,145
25
$201,574
8
$28,482
3
$219,990
10
$54,048
APPLICATIONS DENIED
8
$228,382
8
$143,281
76
$232,615
25
$25,343
10
$253,288
1
$62,520
APPLICATIONS WITHDRAWN
4
$184,790
4
$145,888
42
$226,075
0
$0
3
$181,087
3
$44,923
FILES CLOSED FOR INCOMPLETENESS
0
$0
1
$277,880
7
$227,861
0
$0
1
$377,920
0
$0
Aggregated Statistics For Year 2007 (Based on 2 partial tracts)
A) FHA, FSA/RHS & VA Home Purchase Loans
B) Conventional Home Purchase Loans
C) Refinancings
D) Home Improvement Loans
F) Non-occupant Loans on < 5 Family Dwellings (A B C & D)
G) Loans On Manufactured Home Dwelling (A B C & D)
Number
Average Value
Number
Average Value
Number
Average Value
Number
Average Value
Number
Average Value
Number
Average Value
LOANS ORIGINATED
4
$269,890
136
$188,478
224
$185,566
49
$104,375
47
$206,548
11
$57,724
APPLICATIONS APPROVED, NOT ACCEPTED
1
$369,580
22
$205,126
40
$225,048
4
$37,860
7
$282,446
4
$46,198
APPLICATIONS DENIED
3
$257,503
42
$228,093
165
$225,992
21
$117,702
18
$199,765
4
$33,345
APPLICATIONS WITHDRAWN
0
$0
29
$219,094
46
$214,904
4
$85,100
8
$220,915
0
$0
FILES CLOSED FOR INCOMPLETENESS
0
$0
8
$239,150
22
$235,251
1
$41,680
1
$250,090
0
$0
Aggregated Statistics For Year 2006 (Based on 2 partial tracts)
A) FHA, FSA/RHS & VA Home Purchase Loans
B) Conventional Home Purchase Loans
C) Refinancings
D) Home Improvement Loans
F) Non-occupant Loans on < 5 Family Dwellings (A B C & D)
G) Loans On Manufactured Home Dwelling (A B C & D)
Number
Average Value
Number
Average Value
Number
Average Value
Number
Average Value
Number
Average Value
Number
Average Value
LOANS ORIGINATED
7
$251,481
192
$186,006
320
$195,193
79
$69,259
43
$177,876
24
$53,955
APPLICATIONS APPROVED, NOT ACCEPTED
0
$0
31
$234,047
56
$146,036
14
$67,088
11
$192,369
6
$49,092
APPLICATIONS DENIED
0
$0
64
$142,891
214
$230,829
36
$103,047
25
$160,726
7
$49,820
APPLICATIONS WITHDRAWN
1
$357,080
13
$215,892
136
$240,714
1
$20,840
8
$289,690
1
$70,860
FILES CLOSED FOR INCOMPLETENESS
0
$0
3
$233,883
24
$201,231
4
$130,950
3
$264,450
0
$0
Aggregated Statistics For Year 2005 (Based on 2 partial tracts)
A) FHA, FSA/RHS & VA Home Purchase Loans
B) Conventional Home Purchase Loans
C) Refinancings
D) Home Improvement Loans
F) Non-occupant Loans on < 5 Family Dwellings (A B C & D)
G) Loans On Manufactured Home Dwelling (A B C & D)
Number
Average Value
Number
Average Value
Number
Average Value
Number
Average Value
Number
Average Value
Number
Average Value
LOANS ORIGINATED
1
$280,660
208
$181,998
395
$193,436
67
$100,700
46
$230,278
24
$52,566
APPLICATIONS APPROVED, NOT ACCEPTED
0
$0
14
$134,673
44
$189,306
11
$63,786
3
$166,727
1
$20,840
APPLICATIONS DENIED
0
$0
46
$155,341
196
$220,057
29
$65,062
6
$197,295
4
$39,598
APPLICATIONS WITHDRAWN
1
$294,550
43
$170,896
183
$205,373
22
$151,697
11
$151,445
4
$56,618
FILES CLOSED FOR INCOMPLETENESS
0
$0
4
$142,065
28
$262,200
1
$36,120
3
$257,967
0
$0
Aggregated Statistics For Year 2004 (Based on 2 partial tracts)
A) FHA, FSA/RHS & VA Home Purchase Loans
B) Conventional Home Purchase Loans
C) Refinancings
D) Home Improvement Loans
F) Non-occupant Loans on < 5 Family Dwellings (A B C & D)
G) Loans On Manufactured Home Dwelling (A B C & D)
Number
Average Value
Number
Average Value
Number
Average Value
Number
Average Value
Number
Average Value
Number
Average Value
LOANS ORIGINATED
10
$232,030
257
$210,291
406
$176,635
44
$87,153
36
$186,180
17
$46,994
APPLICATIONS APPROVED, NOT ACCEPTED
0
$0
28
$159,086
58
$196,001
13
$39,438
1
$151,440
0
$0
APPLICATIONS DENIED
0
$0
42
$131,728
150
$185,346
25
$56,465
7
$143,506
11
$52,418
APPLICATIONS WITHDRAWN
0
$0
18
$234,963
217
$190,162
11
$65,807
3
$185,253
0
$0
FILES CLOSED FOR INCOMPLETENESS
1
$314,000
6
$78,038
26
$233,953
0
$0
0
$0
0
$0
Aggregated Statistics For Year 2003 (Based on 2 partial tracts)
A) FHA, FSA/RHS & VA Home Purchase Loans
B) Conventional Home Purchase Loans
C) Refinancings
D) Home Improvement Loans
E) Loans on Dwellings For 5+ Families
F) Non-occupant Loans on < 5 Family Dwellings (A B C & D)
Number
Average Value
Number
Average Value
Number
Average Value
Number
Average Value
Number
Average Value
Number
Average Value
LOANS ORIGINATED
22
$209,105
150
$187,856
831
$143,732
31
$59,655
1
$1,667,280
58
$125,573
APPLICATIONS APPROVED, NOT ACCEPTED
8
$178,364
17
$175,391
72
$150,904
4
$135,120
0
$0
7
$114,526
APPLICATIONS DENIED
1
$301,500
26
$115,213
170
$157,795
25
$39,237
0
$0
13
$144,712
APPLICATIONS WITHDRAWN
1
$273,710
13
$186,179
186
$154,208
3
$15,283
0
$0
1
$187,570
FILES CLOSED FOR INCOMPLETENESS
1
$326,510
4
$287,952
19
$168,922
0
$0
0
$0
1
$263,990
Aggregated Statistics For Year 2002 (Based on 2 partial tracts)
A) FHA, FSA/RHS & VA Home Purchase Loans
B) Conventional Home Purchase Loans
C) Refinancings
D) Home Improvement Loans
F) Non-occupant Loans on < 5 Family Dwellings (A B C & D)
Number
Average Value
Number
Average Value
Number
Average Value
Number
Average Value
Number
Average Value
LOANS ORIGINATED
17
$165,012
156
$136,802
479
$128,831
40
$24,662
38
$129,397
APPLICATIONS APPROVED, NOT ACCEPTED
6
$173,212
14
$162,461
65
$114,593
10
$31,400
8
$138,245
APPLICATIONS DENIED
0
$0
19
$115,613
101
$123,423
29
$45,419
1
$162,560
APPLICATIONS WITHDRAWN
1
$308,450
8
$147,798
131
$135,769
11
$33,851
6
$105,827
FILES CLOSED FOR INCOMPLETENESS
1
$143,110
1
$150,060
14
$130,107
6
$23,157
4
$131,645
Aggregated Statistics For Year 2001 (Based on 2 partial tracts)
A) FHA, FSA/RHS & VA Home Purchase Loans
B) Conventional Home Purchase Loans
C) Refinancings
D) Home Improvement Loans
F) Non-occupant Loans on < 5 Family Dwellings (A B C & D)
Number
Average Value
Number
Average Value
Number
Average Value
Number
Average Value
Number
Average Value
LOANS ORIGINATED
36
$157,620
153
$128,933
435
$116,853
36
$30,721
42
$118,628
APPLICATIONS APPROVED, NOT ACCEPTED
4
$141,372
15
$156,724
58
$117,021
8
$47,240
1
$83,360
APPLICATIONS DENIED
4
$163,255
33
$88,964
69
$111,313
25
$28,177
13
$92,983
APPLICATIONS WITHDRAWN
0
$0
15
$116,525
104
$107,238
13
$26,078
3
$110,227
FILES CLOSED FOR INCOMPLETENESS
0
$0
0
$0
8
$107,331
0
$0
0
$0
Aggregated Statistics For Year 2000 (Based on 2 partial tracts)
A) FHA, FSA/RHS & VA Home Purchase Loans
B) Conventional Home Purchase Loans
C) Refinancings
D) Home Improvement Loans
E) Loans on Dwellings For 5+ Families
F) Non-occupant Loans on < 5 Family Dwellings (A B C & D)
Number
Average Value
Number
Average Value
Number
Average Value
Number
Average Value
Number
Average Value
Number
Average Value
LOANS ORIGINATED
22
$131,677
119
$112,378
138
$88,448
40
$28,379
1
$544,640
18
$151,908
APPLICATIONS APPROVED, NOT ACCEPTED
3
$119,027
17
$91,946
24
$93,090
17
$31,302
0
$0
3
$120,413
APPLICATIONS DENIED
4
$125,740
19
$67,715
69
$85,700
29
$34,016
0
$0
4
$44,112
APPLICATIONS WITHDRAWN
4
$136,855
18
$131,298
110
$71,541
8
$44,635
0
$0
0
$0
FILES CLOSED FOR INCOMPLETENESS
0
$0
1
$31,960
7
$89,120
0
$0
0
$0
0
$0
Aggregated Statistics For Year 1999 (Based on 1 partial tract)
A) FHA, FSA/RHS & VA Home Purchase Loans
B) Conventional Home Purchase Loans
C) Refinancings
D) Home Improvement Loans
E) Loans on Dwellings For 5+ Families
F) Non-occupant Loans on < 5 Family Dwellings (A B C & D)
Detailed PMIC statistics for the following Tracts:5451.00
2002 - 2018 National Fire Incident Reporting System (NFIRS) incidents
Based on the data from the years 2002 - 2018 the average number of fire incidents per year is 15. The highest number of fire incidents - 28 took place in 2004, and the least - 3 in 2015. The data has a decreasing trend.
When looking into fire subcategories, the most reports belonged to: Structure Fires (41.5%), and Outside Fires (30.0%).
Fire incident types reported to NFIRS in Zip Code 02576


 Nearest zip codes: 02571, 02738, 02770, 02330, 02558, 02739.
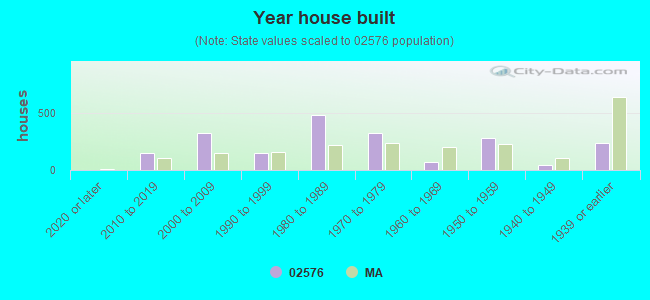


 Based on the data from the years 2002 - 2018 the average number of fire incidents per year is 15. The highest number of fire incidents - 28 took place in 2004, and the least - 3 in 2015. The data has a decreasing trend.
 When looking into fire subcategories, the most reports belonged to: Structure Fires (41.5%), and Outside Fires (30.0%).