Estimated zip code population in 2022: 915 Zip code population in 2010: 1,108 Zip code population in 2000: 1,173
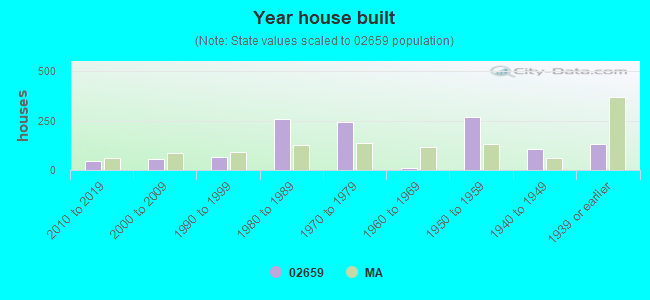
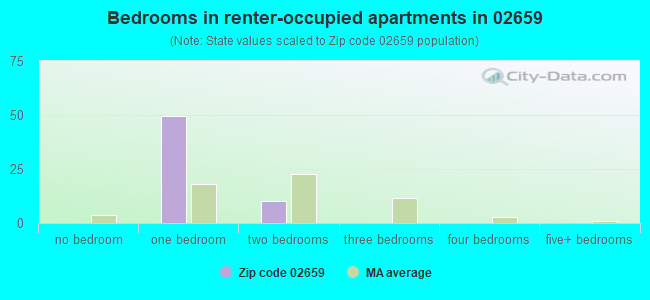
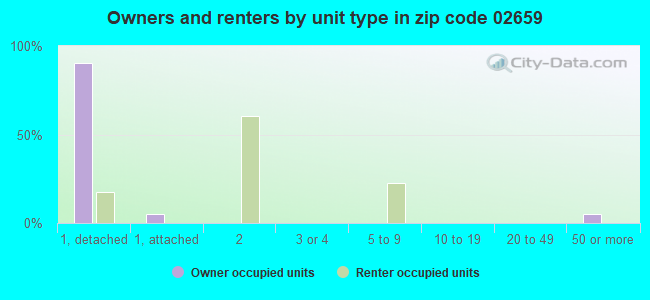
Houses and condos: 1,194 Renter-occupied apartments: 59
% of renters here:
12%
State:
38%
March 2022 cost of living index in zip code 02659: 120.8 (high, U.S. average is 100)
Land area: 2.0 sq. mi. Water area: 0.2 sq. mi.
Population density: 447 people per square mile
(low).
OSM Map
Google Map
MSN Map
OSM Map
General Map
Google Map
MSN Map
OSM Map
Google Map
MSN Map
OSM Map
Google Map
MSN Map
Please wait while loading the map...
Real estate property taxes paid for housing units in 2022:
This zip code:
0.4% ($2,711)
Massachusetts:
1.0% ($5,536)
Median real estate property taxes paid for housing units with mortgages in 2022: $2,667 (0.4%) Median real estate property taxes paid for housing units with no mortgage in 2022: $2,755 (0.4%)
Business Search- 14 Million verified businesses
Males: 429
(46.9%)
Females: 486
(53.1%)
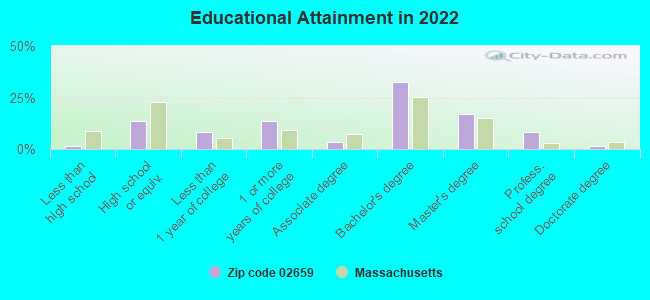
For population 25 years and over in 02659:
High school or higher: 98.3%
Bachelor's degree or higher: 59.1%
Graduate or professional degree: 26.8%
Mean travel time to work (commute): 22.4 minutes
For population 15 years and over in 02659:
Never married: 25.8%
Now married: 57.1%
Separated: 0.0%
Widowed: 9.5%
Divorced: 7.6%
Zip code 02659 compared to state average:
Unemployed percentage significantly below state average.
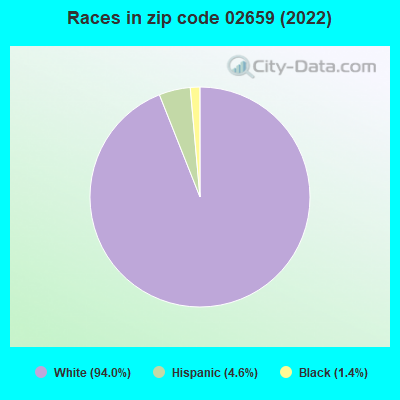
Black race population percentage significantly below state average.
Hispanic race population percentage below state average.
Median age significantly above state average.
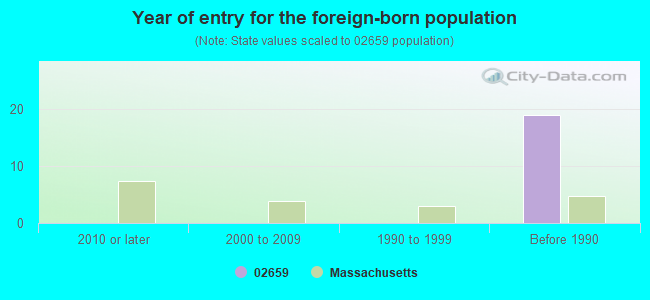
Foreign-born population percentage significantly below state average.
Renting percentage significantly below state average.
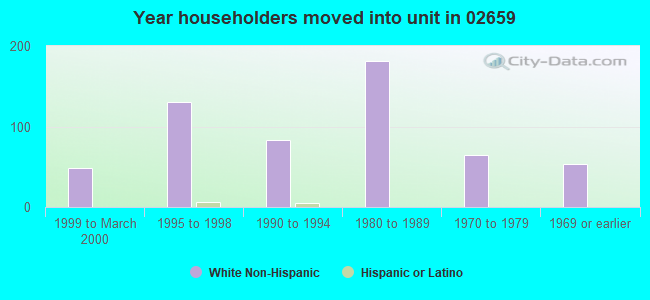
Length of stay since moving in above state average.
Number of college students significantly below state average.
Percentage of population with a bachelor's degree or higher above state average.
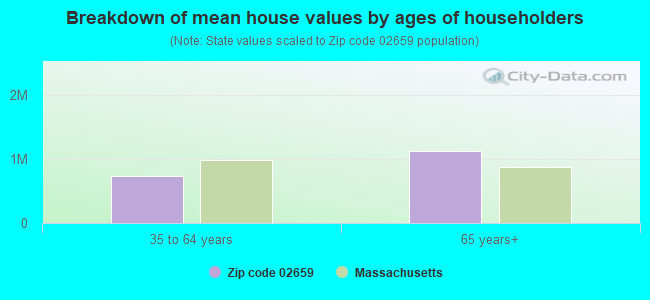
Estimated median house/condo value in 2022: $718,348
02659:
$718,348
Massachusetts:
$534,700
According to our research of Massachusetts and other state lists, there was 1 registered sex offender living in 02659 zip code as of June 08, 2024. The ratio of all residents to sex offenders in zip code 02659 is 846 to 1.
Median resident age:
This zip code:
60.6 years
Massachusetts median age:
40.3 years
Average household size:
This zip code:
1.8 people
Massachusetts:
2.4 people
Averages for the 2020 tax year for zip code 02659, filed in 2021:
Average Adjusted Gross Income (AGI) in 2020: $97,035 (Individual Income Tax Returns)
Here:
$97,035
State:
$105,130
Salary/wage: $76,462 (reported on 63.4% of returns)
Here:
$76,462
State:
$82,951
(% of AGI for various income ranges: 1033.3% for AGIs below $25k, 3402.2% for AGIs $25k-50k, 5428.3% for AGIs $50k-75k, 7565.0% for AGIs $75k-100k, 10881.7% for AGIs $100k-200k)
Taxable interest for individuals: $1,828 (reported on 50.7% of returns)
This zip code:
$1,828
Massachusetts:
$2,361
(% of AGI for various income ranges: 61.1% for AGIs below $25k, 92.2% for AGIs $25k-50k, 165.0% for AGIs $50k-75k, 162.5% for AGIs $75k-100k, 300.0% for AGIs $100k-200k)
Ordinary dividends: $8,634 (reported on 40.8% of returns)
Here:
$8,634
State:
$10,365
(% of AGI for various income ranges: 230.0% for AGIs below $25k, 110.0% for AGIs $25k-50k, 376.7% for AGIs $50k-75k, 745.0% for AGIs $75k-100k, 1133.3% for AGIs $100k-200k)
Net capital gain/loss in AGI: +$14,812 (reported on 36.6% of returns)
Here:
+$14,812
State:
+$48,178
(% of AGI for various income ranges: 103.3% for AGIs below $25k, 70.0% for AGIs $25k-50k, 371.7% for AGIs $50k-75k, 745.0% for AGIs $75k-100k, 1333.3% for AGIs $100k-200k)
Profit/loss from business: +$32,068 (reported on 26.8% of returns)
Here:
+$32,068
State:
+$20,792
(% of AGI for various income ranges: 272.2% for AGIs below $25k, 373.3% for AGIs $25k-50k, 1158.3% for AGIs $50k-75k, 2082.5% for AGIs $75k-100k, 1881.7% for AGIs $100k-200k)
Taxable individual retirement arrangement distribution: $21,342 (reported on 16.9% of returns)
02659:
$21,342
Massachusetts:
$22,790
(% of AGI for various income ranges: 348.9% for AGIs below $25k, 488.3% for AGIs $50k-75k, 1007.5% for AGIs $75k-100k, 2585.0% for AGIs $100k-200k)
Total itemized deductions: $29,236 (reported on 15.5% of returns)
Here:
$29,236
State:
$36,722
(% of AGI for various income ranges: 482.2% for AGIs below $25k, 1300.0% for AGIs $50k-75k, 1396.7% for AGIs $100k-200k)
Charity contributions: $4,410 (reported on 14.1% of returns)
Here:
$4,410
State:
$12,529
(% of AGI for various income ranges: 143.3% for AGIs $50k-75k, 138.3% for AGIs $100k-200k)
Taxes paid: $7,973 (reported on 15.5% of returns)
02659:
$7,973
State:
$8,782
(% of AGI for various income ranges: 95.6% for AGIs below $25k, 365.0% for AGIs $50k-75k, 418.3% for AGIs $100k-200k)
Earned income credit: $1,075 (reported on 5.6% of returns)
Here:
$1,075
State:
$1,909
(% of AGI for various income ranges: 47.8% for AGIs below $25k)
Percentage of individuals using paid preparers for their 2020 taxes: 90.1%
Here:
90%
State:
92%
(% for various income ranges: 90.0% for AGIs below $25k, 92.3% for AGIs $25k-50k, 90.9% for AGIs $50k-75k, 88.9% for AGIs $75k-100k, 90.9% for AGIs $100k-200k, 85.7% for AGIs over 200k)
Averages for the 2012 tax year for zip code 02659, filed in 2013:
Average Adjusted Gross Income (AGI) in 2012: $59,474 (Individual Income Tax Returns)
Here:
$59,474
State:
$81,425
Salary/wage: $42,030 (reported on 60.7% of returns)
Here:
$42,030
State:
$64,752
(% of AGI for various income ranges: 52.6% for AGIs below $25k, 50.6% for AGIs $25k-50k, 43.3% for AGIs $50k-75k, 40.4% for AGIs $75k-100k, 76.7% for AGIs $100k-200k)
Taxable interest for individuals: $1,555 (reported on 50.8% of returns)
This zip code:
$1,555
Massachusetts:
$2,136
(% of AGI for various income ranges: 3.9% for AGIs below $25k, 0.8% for AGIs $25k-50k, 1.3% for AGIs $50k-75k, 2.1% for AGIs $75k-100k, 1.7% for AGIs $100k-200k)
Ordinary dividends: $5,120 (reported on 32.8% of returns)
Here:
$5,120
State:
$9,473
(% of AGI for various income ranges: 5.5% for AGIs below $25k, 4.6% for AGIs $25k-50k, 1.8% for AGIs $50k-75k, 3.0% for AGIs $75k-100k, 4.2% for AGIs $100k-200k)
Net capital gain/loss in AGI: +$2,835 (reported on 27.9% of returns)
Here:
+$2,835
State:
+$31,437
(% of AGI for various income ranges: 1.5% for AGIs $50k-75k, 4.2% for AGIs $75k-100k, 2.4% for AGIs $100k-200k)
Profit/loss from business: +$21,074 (reported on 31.1% of returns)
Here:
+$21,074
State:
+$20,662
(% of AGI for various income ranges: 16.7% for AGIs below $25k, 24.2% for AGIs $25k-50k, 19.3% for AGIs $50k-75k, 14.1% for AGIs $100k-200k)
Taxable individual retirement arrangement distribution: $16,462 (reported on 21.3% of returns)
02659:
$16,462
Massachusetts:
$18,892
(% of AGI for various income ranges: 7.4% for AGIs below $25k, 7.1% for AGIs $25k-50k, 7.7% for AGIs $75k-100k, 12.6% for AGIs $100k-200k)
Total itemized deductions: $22,448 (23% of AGI, reported on 41.0% of returns)
Here:
$22,448
State:
$28,907
Here:
23.3% of AGI
State:
18.2% of AGI
(% of AGI for various income ranges: 26.1% for AGIs below $25k, 13.3% for AGIs $25k-50k, 14.4% for AGIs $50k-75k, 17.5% for AGIs $75k-100k, 16.1% for AGIs $100k-200k, 12.3% for AGIs over 200k)
Charity contributions: $2,658 (reported on 31.1% of returns)
Here:
$2,658
State:
$4,208
(% of AGI for various income ranges: 1.1% for AGIs below $25k, 0.7% for AGIs $25k-50k, 1.0% for AGIs $50k-75k, 1.0% for AGIs $75k-100k, 1.6% for AGIs $100k-200k, 2.1% for AGIs over 200k)
Taxes paid: $7,724 (reported on 41.0% of returns)
02659:
$7,724
State:
$13,303
(% of AGI for various income ranges: 5.4% for AGIs below $25k, 3.3% for AGIs $25k-50k, 4.5% for AGIs $50k-75k, 4.6% for AGIs $75k-100k, 5.6% for AGIs $100k-200k, 7.0% for AGIs over 200k)
Earned income credit: $1,550 (reported on 9.8% of returns)
Here:
$1,550
State:
$1,971
(% of AGI for various income ranges: 3.6% for AGIs below $25k)
Percentage of individuals using paid preparers for their 2012 taxes: 67.2%
Here:
67%
State:
56%
(% for various income ranges: 60.9% for AGIs below $25k, 64.3% for AGIs $25k-50k, 77.8% for AGIs $50k-75k, 66.7% for AGIs $75k-100k, 100.0% for AGIs $100k-200k)
Averages for the 2004 tax year for zip code 02659, filed in 2005:
Average Adjusted Gross Income (AGI) in 2004: $54,421 (Individual Income Tax Returns)
Here:
$54,421
State:
$62,877
Salary/wage: $37,833 (reported on 61.8% of returns)
Here:
$37,833
State:
$52,969
(% of AGI for various income ranges: 56.6% for AGIs below $10k, 57.5% for AGIs $10k-25k, 56.0% for AGIs $25k-50k, 48.0% for AGIs $50k-75k, 47.6% for AGIs $75k-100k, 30.8% for AGIs over 100k)
Taxable interest for individuals: $2,460 (reported on 68.0% of returns)
This zip code:
$2,460
Massachusetts:
$1,945
(% of AGI for various income ranges: 8.6% for AGIs below $10k, 3.7% for AGIs $10k-25k, 2.3% for AGIs $25k-50k, 5.3% for AGIs $50k-75k, 3.0% for AGIs $75k-100k, 2.2% for AGIs over 100k)
Taxable dividends: $4,481 (reported on 42.9% of returns)
Here:
$4,481
State:
$5,323
(% of AGI for various income ranges: 9.0% for AGIs below $10k, 5.1% for AGIs $10k-25k, 3.6% for AGIs $25k-50k, 3.0% for AGIs $50k-75k, 2.7% for AGIs $75k-100k, 3.5% for AGIs over 100k)
Net capital gain/loss: +$18,358 (reported on 35.9% of returns)
Here:
+$18,358
State:
+$20,377
(% of AGI for various income ranges: -4.4% for AGIs below $10k, -1.0% for AGIs $10k-25k, 1.1% for AGIs $25k-50k, -0.3% for AGIs $50k-75k, 0.8% for AGIs $75k-100k, 28.6% for AGIs over 100k)
Profit/loss from business: +$16,779 (reported on 31.0% of returns)
Here:
+$16,779
State:
+$17,837
(% of AGI for various income ranges: 30.5% for AGIs below $10k, 22.4% for AGIs $10k-25k, 17.8% for AGIs $25k-50k, 6.1% for AGIs $50k-75k, 8.5% for AGIs $75k-100k, 5.0% for AGIs over 100k)
IRA payment deduction: $3,229 (reported on 5.6% of returns)
02659:
$3,229
Massachusetts:
$3,100
Self-employed pension: $7,667 (reported on 1.9% of returns)
Here:
$7,667
Massachusetts:
$14,516
Total itemized deductions: $18,158 (22% of AGI, reported on 44.4% of returns)
Here:
$18,158
State:
$22,573
Here:
21.9% of AGI
State:
19.5% of AGI
(% of AGI for various income ranges: 23.8% for AGIs below $10k, 25.3% for AGIs $10k-25k, 18.0% for AGIs $25k-50k, 16.9% for AGIs $50k-75k, 15.1% for AGIs $75k-100k, 10.4% for AGIs over 100k)
Charity contributions deductions: $2,021 (2% of AGI, reported on 38.3% of returns)
Here:
$2,021
State:
$3,295
Here:
2.2% of AGI
State:
2.7% of AGI
(% of AGI for various income ranges: 2.2% for AGIs $10k-25k, 1.3% for AGIs $25k-50k, 2.4% for AGIs $50k-75k, 1.9% for AGIs $75k-100k, 0.8% for AGIs over 100k)
Total tax: $9,187 (reported on 83.5% of returns)
02659:
$9,187
State:
$11,494
(% of AGI for various income ranges: 5.8% for AGIs below $10k, 7.8% for AGIs $10k-25k, 9.4% for AGIs $25k-50k, 9.6% for AGIs $50k-75k, 13.3% for AGIs $75k-100k, 19.7% for AGIs over 100k)
Earned income credit: $1,000 (reported on 6.8% of returns)
Here:
$1,000
State:
$1,518
Percentage of individuals using paid preparers for their 2004 taxes: 66.0%
Here:
66%
State:
58%
(% for various income ranges: 52.1% for AGIs below $10k, 73.3% for AGIs $10k-25k, 61.1% for AGIs $25k-50k, 70.2% for AGIs $50k-75k, 70.6% for AGIs $75k-100k, 80.6% for AGIs over 100k)
Household received Food Stamps/SNAP in the past 12 months: 9 Household did not receive Food Stamps/SNAP in the past 12 months: 494
Women who did not have a birth in the past 12 months: 134 (33 now married, 101 unmarried)
Housing units in zip code 02659 with a mortgage: 206 (51 second mortgage, 39 both second mortgage and home equity loan) Median monthly owner costs for units with a mortgage: $2,822 Median monthly owner costs for units without a mortgage: $752
Residents with income below the poverty level in 2022:
This zip code:
5.5%
Whole state:
10.4%
Residents with income below 50% of the poverty level in 2022:
This zip code:
4.1%
Whole state:
5.1%
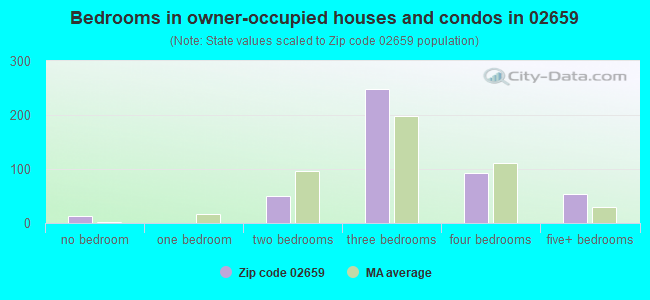
Median number of rooms in houses and condos:
Here:
6.1
State:
6.5
Median number of rooms in apartments:
Here:
3.9
State:
4.0
Notable locations in this zip code not listed on our city pages
Size of family households: 181 2-persons, 36 3-persons, 33 4-persons
Size of nonfamily households: 229 1-person, 41 2-persons
105 married couples with children.
11 single-parent households (11 women).
99.1% of residents of 02659 zip code speak English at home.
1.1% of residents speak Spanish at home (100% very well).
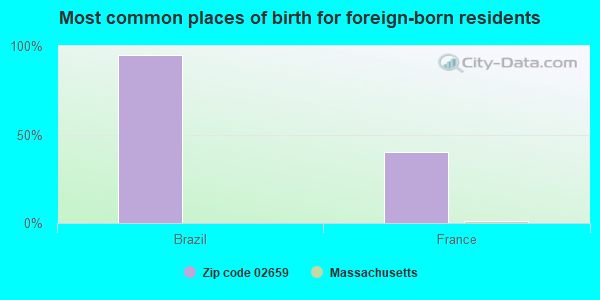
Foreign born population: 20 (2.3%) (100.0% of them are naturalized citizens)
This zip code:
2.3%
Whole state:
18.0%
95%Brazil
40%France
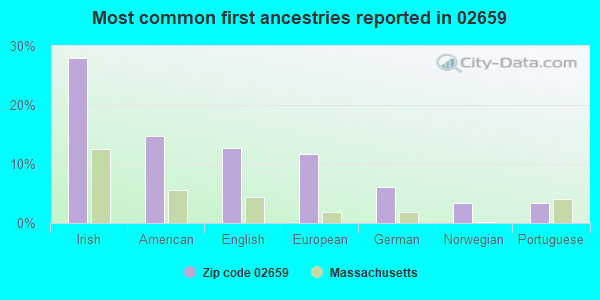
28%Irish
15%American
13%English
12%European
6%German
3%Norwegian
3%Portuguese
Year of entry for the foreign-born population
02010 or later
02000 to 2009
01990 to 1999
19Before 1990
Facilities with environmental interests located in this zip code:
MARITIME EXPLORATIONS INC (114A COMMERCE PARK in SOUTH CHATHAM, MA)
Conditionally Exempt Small Quantity Generators, less than 100 kg/month of hazardous waste (Resource Conservation and Recovery Act (tracking hazardous waste)) - notification
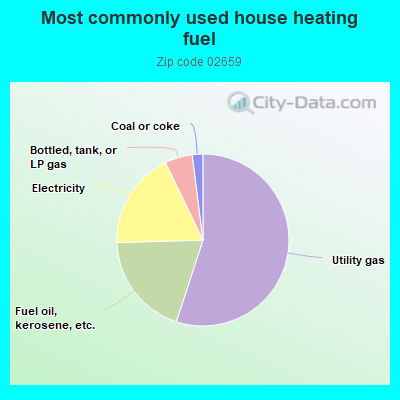
55.3%Utility gas
19.6%Fuel oil, kerosene, etc.
18.4%Electricity
5.2%Bottled, tank, or LP gas
2.0%Coal or coke
Population in 1990: 840. Population change in the 1990s: +333 (+39.6%).
Place of birth for U.S.-born residents:
This state: 497
Northeast: 224
Midwest: 41
South: 99
West: 35
60% of the 02659 zip code residents lived in the same house 5 years ago. Out of people who lived in different houses, 44% lived in this county. Out of people who lived in different counties, 50% lived in Massachusetts.
97% of the 02659 zip code residents lived in the same house 1 year ago. Out of people who lived in different houses, 118% moved from different state.
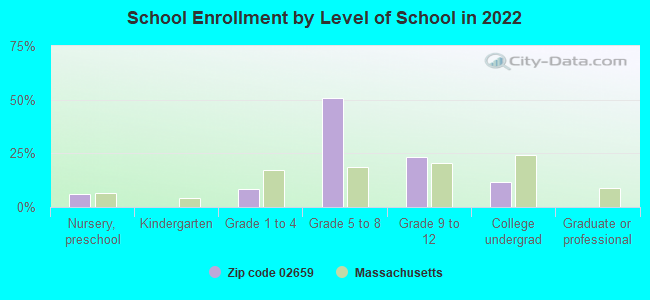
Private vs. public school enrollment:
Students in private schools in grades 1 to 8 (elementary and middle school): 11
Here:
14.3%
Massachusetts:
10.3%
Students in private schools in grades 9 to 12 (high school):
Here:
0.0%
Massachusetts:
12.3%
Students in private undergraduate colleges:
Here:
0.0%
Massachusetts:
51.2%
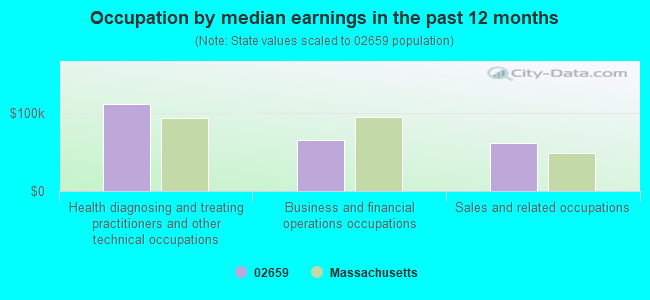
Occupation by median earnings in the past 12 months ($)
111,615Health diagnosing and treating practitioners and other technical occupations
65,256Business and financial operations occupations
62,312Sales and related occupations
Top industries in this zip code by the number of employees in 2005:
Construction: Plumbing, Heating, and Air-Conditioning Contractors (20-49 employees: 1 establishment)
Administrative and Support and Waste Management and Remediation Services: Landscaping Services (5-9: 4, 1-4: 2)
Wholesale Trade: Fish and Seafood Merchant Wholesalers (10-19: 1, 1-4: 1)
Accommodation and Food Services: Hotels (except Casino Hotels) and Motels (5-9: 1)
Construction: Residential Remodelers (5-9: 1)
Real Estate and Rental and Leasing: Residential Property Managers (5-9: 1)
Accommodation and Food Services: Snack and Nonalcoholic Beverage Bars (1-4: 2)
Other Services (except Public Administration): Religious Organizations (1-4: 2)
People in group quarters in 2000:
11 people in other workers' dormitories
Home Mortgage Disclosure Act Aggregated Statistics For Year 2009 (Based on 2 partial tracts)
A) FHA, FSA/RHS & VA Home Purchase Loans
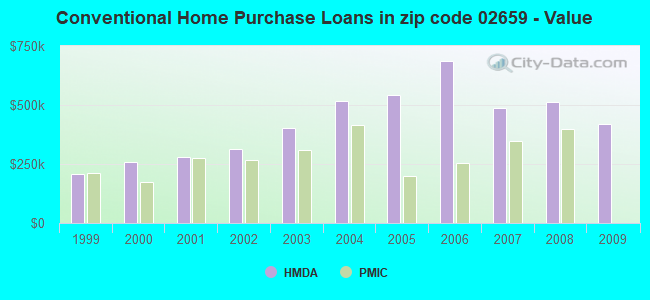
B) Conventional Home Purchase Loans
C) Refinancings
D) Home Improvement Loans
F) Non-occupant Loans on < 5 Family Dwellings (A B C & D)
Number
Average Value
Number
Average Value
Number
Average Value
Number
Average Value
Number
Average Value
LOANS ORIGINATED
1
$293,800
25
$420,546
108
$354,511
7
$235,123
88
$398,037
APPLICATIONS APPROVED, NOT ACCEPTED
0
$0
1
$1,622,410
5
$367,830
0
$0
4
$627,958
APPLICATIONS DENIED
0
$0
3
$478,717
14
$493,384
1
$228,470
10
$555,129
APPLICATIONS WITHDRAWN
0
$0
2
$296,310
9
$375,200
0
$0
7
$342,610
FILES CLOSED FOR INCOMPLETENESS
0
$0
0
$0
1
$181,910
0
$0
0
$0
Aggregated Statistics For Year 2008 (Based on 2 partial tracts)
B) Conventional Home Purchase Loans
C) Refinancings
D) Home Improvement Loans
F) Non-occupant Loans on < 5 Family Dwellings (A B C & D)
Number
Average Value
Number
Average Value
Number
Average Value
Number
Average Value
LOANS ORIGINATED
20
$512,433
38
$511,237
5
$225,120
38
$545,927
APPLICATIONS APPROVED, NOT ACCEPTED
1
$1,044,200
3
$492,227
0
$0
2
$871,670
APPLICATIONS DENIED
1
$432,820
8
$631,056
2
$169,845
5
$636,098
APPLICATIONS WITHDRAWN
2
$556,940
6
$486,923
0
$0
5
$561,260
FILES CLOSED FOR INCOMPLETENESS
1
$881,050
1
$210,380
0
$0
1
$361,800
Aggregated Statistics For Year 2007 (Based on 2 partial tracts)
B) Conventional Home Purchase Loans
C) Refinancings
D) Home Improvement Loans
F) Non-occupant Loans on < 5 Family Dwellings (A B C & D)
Number
Average Value
Number
Average Value
Number
Average Value
Number
Average Value
LOANS ORIGINATED
35
$488,363
46
$501,728
13
$201,979
51
$566,873
APPLICATIONS APPROVED, NOT ACCEPTED
4
$367,245
4
$214,400
2
$238,520
5
$403,876
APPLICATIONS DENIED
3
$919,353
12
$376,596
2
$409,205
8
$566,360
APPLICATIONS WITHDRAWN
1
$156,780
7
$434,209
1
$227,800
4
$337,680
FILES CLOSED FOR INCOMPLETENESS
1
$331,650
3
$561,237
0
$0
1
$1,211,700
Aggregated Statistics For Year 2006 (Based on 2 partial tracts)
B) Conventional Home Purchase Loans
C) Refinancings
D) Home Improvement Loans
F) Non-occupant Loans on < 5 Family Dwellings (A B C & D)
Number
Average Value
Number
Average Value
Number
Average Value
Number
Average Value
LOANS ORIGINATED
40
$686,139
52
$349,231
14
$225,958
55
$532,285
APPLICATIONS APPROVED, NOT ACCEPTED
5
$699,614
6
$393,347
1
$155,780
7
$646,263
APPLICATIONS DENIED
6
$598,478
13
$430,991
2
$157,785
7
$629,753
APPLICATIONS WITHDRAWN
4
$975,018
9
$331,873
1
$594,290
6
$573,297
FILES CLOSED FOR INCOMPLETENESS
0
$0
3
$499,373
0
$0
0
$0
Aggregated Statistics For Year 2005 (Based on 2 partial tracts)
B) Conventional Home Purchase Loans
C) Refinancings
D) Home Improvement Loans
F) Non-occupant Loans on < 5 Family Dwellings (A B C & D)
Number
Average Value
Number
Average Value
Number
Average Value
Number
Average Value
LOANS ORIGINATED
43
$541,056
59
$385,341
12
$277,911
65
$527,970
APPLICATIONS APPROVED, NOT ACCEPTED
3
$382,237
6
$332,543
2
$118,255
5
$322,940
APPLICATIONS DENIED
3
$599,873
12
$361,632
4
$157,450
7
$440,717
APPLICATIONS WITHDRAWN
5
$317,982
11
$373,160
2
$136,515
5
$429,738
FILES CLOSED FOR INCOMPLETENESS
1
$927,950
1
$256,610
0
$0
2
$248,905
Aggregated Statistics For Year 2004 (Based on 2 partial tracts)
B) Conventional Home Purchase Loans
C) Refinancings
D) Home Improvement Loans
F) Non-occupant Loans on < 5 Family Dwellings (A B C & D)
Number
Average Value
Number
Average Value
Number
Average Value
Number
Average Value
LOANS ORIGINATED
45
$518,796
64
$342,789
10
$275,270
66
$451,763
APPLICATIONS APPROVED, NOT ACCEPTED
3
$498,927
6
$260,910
1
$147,400
3
$479,273
APPLICATIONS DENIED
4
$422,855
13
$384,632
4
$141,120
5
$498,682
APPLICATIONS WITHDRAWN
5
$649,230
21
$279,262
1
$353,760
7
$445,790
FILES CLOSED FOR INCOMPLETENESS
0
$0
3
$298,150
0
$0
2
$333,660
Aggregated Statistics For Year 2003 (Based on 2 partial tracts)
B) Conventional Home Purchase Loans
C) Refinancings
D) Home Improvement Loans
F) Non-occupant Loans on < 5 Family Dwellings (A B C & D)
Number
Average Value
Number
Average Value
Number
Average Value
Number
Average Value
LOANS ORIGINATED
40
$403,558
200
$235,247
2
$102,680
115
$311,538
APPLICATIONS APPROVED, NOT ACCEPTED
3
$273,027
12
$248,766
0
$0
7
$242,493
APPLICATIONS DENIED
3
$814,610
20
$278,686
2
$135,175
8
$390,610
APPLICATIONS WITHDRAWN
3
$235,730
18
$278,999
0
$0
5
$413,792
FILES CLOSED FOR INCOMPLETENESS
1
$223,780
2
$502,335
0
$0
1
$130,650
Aggregated Statistics For Year 2002 (Based on 2 partial tracts)
B) Conventional Home Purchase Loans
C) Refinancings
D) Home Improvement Loans
F) Non-occupant Loans on < 5 Family Dwellings (A B C & D)
Number
Average Value
Number
Average Value
Number
Average Value
Number
Average Value
LOANS ORIGINATED
41
$313,527
151
$260,337
3
$43,103
99
$307,767
APPLICATIONS APPROVED, NOT ACCEPTED
3
$339,243
12
$307,000
2
$282,240
6
$492,507
APPLICATIONS DENIED
2
$261,130
13
$220,739
2
$23,785
5
$277,916
APPLICATIONS WITHDRAWN
4
$453,088
12
$311,941
1
$165,160
6
$490,385
FILES CLOSED FOR INCOMPLETENESS
1
$403,680
3
$178,557
0
$0
2
$285,085
Aggregated Statistics For Year 2001 (Based on 2 partial tracts)
B) Conventional Home Purchase Loans
C) Refinancings
D) Home Improvement Loans
F) Non-occupant Loans on < 5 Family Dwellings (A B C & D)
Number
Average Value
Number
Average Value
Number
Average Value
Number
Average Value
LOANS ORIGINATED
41
$280,918
97
$231,468
3
$50,140
65
$286,245
APPLICATIONS APPROVED, NOT ACCEPTED
3
$300,497
7
$259,721
1
$88,780
2
$492,955
APPLICATIONS DENIED
3
$153,430
4
$126,798
3
$61,977
3
$145,503
APPLICATIONS WITHDRAWN
4
$169,175
10
$171,654
1
$38,530
3
$341,590
FILES CLOSED FOR INCOMPLETENESS
1
$510,210
2
$134,335
0
$0
1
$97,150
Aggregated Statistics For Year 2000 (Based on 2 partial tracts)
B) Conventional Home Purchase Loans
C) Refinancings
D) Home Improvement Loans
F) Non-occupant Loans on < 5 Family Dwellings (A B C & D)
Number
Average Value
Number
Average Value
Number
Average Value
Number
Average Value
LOANS ORIGINATED
39
$260,209
30
$192,603
4
$35,678
35
$263,540
APPLICATIONS APPROVED, NOT ACCEPTED
6
$227,745
3
$162,140
2
$35,010
4
$270,932
APPLICATIONS DENIED
3
$242,317
4
$104,185
2
$28,140
1
$432,150
APPLICATIONS WITHDRAWN
3
$491,557
3
$112,003
1
$28,810
2
$198,490
FILES CLOSED FOR INCOMPLETENESS
0
$0
1
$341,030
0
$0
0
$0
Aggregated Statistics For Year 1999 (Based on 1 partial tract)
B) Conventional Home Purchase Loans
C) Refinancings
D) Home Improvement Loans
F) Non-occupant Loans on < 5 Family Dwellings (A B C & D)


 Nearest zip codes: 02669, 02645, 02646, 02633, 02650, 02631.