Estimated zip code population in 2022: 7,291 Zip code population in 2010: 6,738 Zip code population in 2000: 7,134
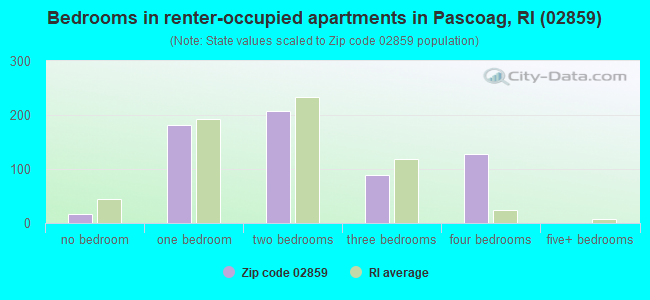
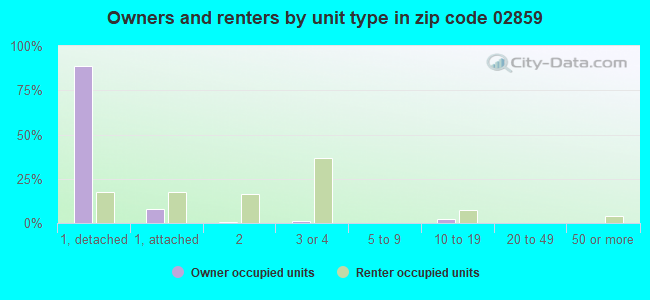
Houses and condos: 2,536 Renter-occupied apartments: 606
% of renters here:
25%
State:
37%
March 2022 cost of living index in zip code 02859: 87.3 (less than average, U.S. average is 100)
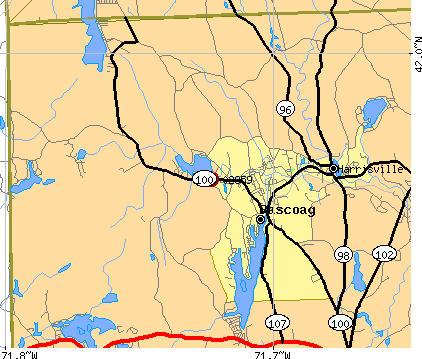
Land area: 28.4 sq. mi. Water area: 1.3 sq. mi.
Population density: 257 people per square mile
(very low).
OSM Map
Google Map
MSN Map
OSM Map
General Map
Google Map
MSN Map
OSM Map
Google Map
MSN Map
OSM Map
Google Map
MSN Map
Please wait while loading the map...
Real estate property taxes paid for housing units in 2022:
This zip code:
1.2% ($4,405)
Rhode Island:
1.2% ($4,726)
Median real estate property taxes paid for housing units with mortgages in 2022: $4,549 (1.2%) Median real estate property taxes paid for housing units with no mortgage in 2022: $3,786 (1.2%)
Business Search- 14 Million verified businesses
Males: 4,184
(57.4%)
Females: 3,104
(42.6%)
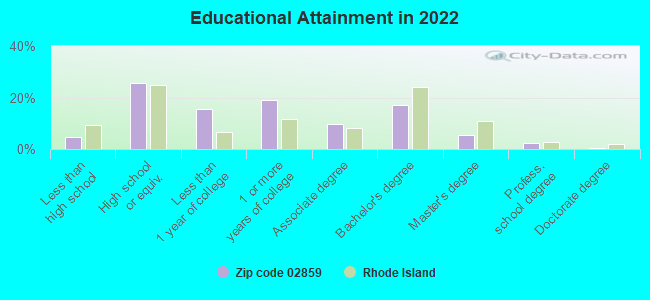
For population 25 years and over in 02859:
High school or higher: 94.2%
Bachelor's degree or higher: 24.5%
Graduate or professional degree: 7.8%
Unemployed: 7.3%
Mean travel time to work (commute): 31.5 minutes
For population 15 years and over in 02859:
Never married: 37.8%
Now married: 50.1%
Separated: 0.1%
Widowed: 4.4%
Divorced: 7.6%
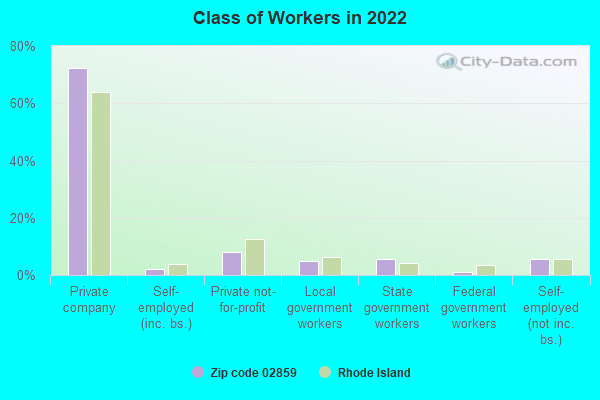
Zip code 02859 compared to state average:
Black race population percentage significantly below state average.
Foreign-born population percentage below state average.
Length of stay since moving in significantly above state average.
Percentage of population with a bachelor's degree or higher below state average.
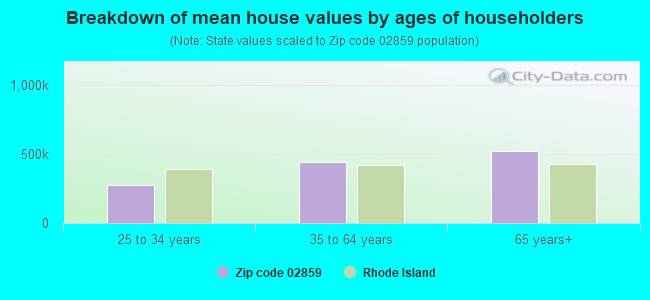
Estimated median house/condo value in 2022: $370,361
02859:
$370,361
Rhode Island:
$383,900
According to our research of Rhode Island and other state lists, there were 7 registered sex offenders living in 02859 zip code as of May 23, 2024. The ratio of all residents to sex offenders in zip code 02859 is 1,043 to 1. The ratio of registered sex offenders to all residents in this zip code is near the state average.
Median resident age:
This zip code:
38.7 years
Rhode Island median age:
40.7 years
Average household size:
This zip code:
2.9 people
Rhode Island:
2.4 people
Averages for the 2020 tax year for zip code 02859, filed in 2021:
Average Adjusted Gross Income (AGI) in 2020: $64,923 (Individual Income Tax Returns)
Here:
$64,923
State:
$74,300
Salary/wage: $58,446 (reported on 86.8% of returns)
Here:
$58,446
State:
$60,330
(% of AGI for various income ranges: 1177.3% for AGIs below $25k, 3576.8% for AGIs $25k-50k, 6351.8% for AGIs $50k-75k, 9242.8% for AGIs $75k-100k, 18317.8% for AGIs $100k-200k, 49617.5% for AGIs over 200k)
Taxable interest for individuals: $610 (reported on 28.2% of returns)
This zip code:
$610
Rhode Island:
$1,971
(% of AGI for various income ranges: 10.0% for AGIs below $25k, 9.1% for AGIs $25k-50k, 29.0% for AGIs $50k-75k, 40.3% for AGIs $75k-100k, 48.9% for AGIs $100k-200k, 105.0% for AGIs over 200k)
Ordinary dividends: $2,229 (reported on 13.5% of returns)
Here:
$2,229
State:
$7,621
(% of AGI for various income ranges: 13.1% for AGIs below $25k, 18.5% for AGIs $25k-50k, 29.8% for AGIs $50k-75k, 25.2% for AGIs $75k-100k, 119.4% for AGIs $100k-200k, 445.0% for AGIs over 200k)
Net capital gain/loss in AGI: +$7,108 (reported on 12.0% of returns)
Here:
+$7,108
State:
+$26,041
(% of AGI for various income ranges: 0.5% for AGIs below $25k, 16.1% for AGIs $25k-50k, 48.0% for AGIs $50k-75k, 69.0% for AGIs $75k-100k, 240.0% for AGIs $100k-200k, 3695.0% for AGIs over 200k)
Profit/loss from business: +$13,316 (reported on 11.1% of returns)
Here:
+$13,316
State:
+$15,775
(% of AGI for various income ranges: 88.7% for AGIs below $25k, 126.2% for AGIs $25k-50k, 250.5% for AGIs $50k-75k, 247.6% for AGIs $75k-100k, 248.3% for AGIs $100k-200k, 2325.0% for AGIs over 200k)
Taxable individual retirement arrangement distribution: $14,168 (reported on 7.5% of returns)
02859:
$14,168
Rhode Island:
$18,801
(% of AGI for various income ranges: 58.9% for AGIs below $25k, 82.7% for AGIs $25k-50k, 118.0% for AGIs $50k-75k, 193.4% for AGIs $75k-100k, 443.9% for AGIs $100k-200k)
Total itemized deductions: $23,148 (reported on 8.7% of returns)
Here:
$23,148
State:
$29,550
(% of AGI for various income ranges: 117.7% for AGIs $25k-50k, 325.8% for AGIs $50k-75k, 476.9% for AGIs $75k-100k, 643.9% for AGIs $100k-200k, 2330.0% for AGIs over 200k)
Charity contributions: $3,425 (reported on 6.0% of returns)
Here:
$3,425
State:
$7,826
(% of AGI for various income ranges: 31.8% for AGIs $50k-75k, 43.1% for AGIs $75k-100k, 74.7% for AGIs $100k-200k, 410.0% for AGIs over 200k)
Taxes paid: $8,148 (reported on 8.7% of returns)
02859:
$8,148
State:
$8,398
(% of AGI for various income ranges: 31.5% for AGIs $25k-50k, 121.8% for AGIs $50k-75k, 180.3% for AGIs $75k-100k, 236.1% for AGIs $100k-200k, 737.5% for AGIs over 200k)
Earned income credit: $2,122 (reported on 12.3% of returns)
Here:
$2,122
State:
$2,059
(% of AGI for various income ranges: 78.7% for AGIs below $25k, 57.9% for AGIs $25k-50k)
Percentage of individuals using paid preparers for their 2020 taxes: 95.2%
Here:
95%
State:
94%
(% for various income ranges: 93.2% for AGIs below $25k, 96.4% for AGIs $25k-50k, 94.4% for AGIs $50k-75k, 95.0% for AGIs $75k-100k, 96.6% for AGIs $100k-200k, 100.0% for AGIs over 200k)
Averages for the 2012 tax year for zip code 02859, filed in 2013:
Average Adjusted Gross Income (AGI) in 2012: $52,817 (Individual Income Tax Returns)
Here:
$52,817
State:
$60,628
Salary/wage: $49,129 (reported on 88.4% of returns)
Here:
$49,129
State:
$50,029
(% of AGI for various income ranges: 76.7% for AGIs below $25k, 81.2% for AGIs $25k-50k, 79.8% for AGIs $50k-75k, 83.8% for AGIs $75k-100k, 86.4% for AGIs $100k-200k, 76.7% for AGIs over 200k)
Taxable interest for individuals: $788 (reported on 34.7% of returns)
This zip code:
$788
Rhode Island:
$1,640
(% of AGI for various income ranges: 0.9% for AGIs below $25k, 0.5% for AGIs $25k-50k, 0.9% for AGIs $50k-75k, 0.2% for AGIs $75k-100k, 0.4% for AGIs $100k-200k, 0.3% for AGIs over 200k)
Ordinary dividends: $1,456 (reported on 14.6% of returns)
Here:
$1,456
State:
$6,396
(% of AGI for various income ranges: 1.0% for AGIs below $25k, 0.3% for AGIs $25k-50k, 0.5% for AGIs $50k-75k, 0.2% for AGIs $75k-100k, 0.5% for AGIs $100k-200k)
Net capital gain/loss in AGI: +$993 (reported on 9.5% of returns)
Here:
+$993
State:
+$15,680
(% of AGI for various income ranges: 0.1% for AGIs $25k-50k, 0.2% for AGIs $50k-75k, 0.2% for AGIs $75k-100k, 0.3% for AGIs $100k-200k)
Profit/loss from business: +$9,450 (reported on 11.6% of returns)
Here:
+$9,450
State:
+$15,678
(% of AGI for various income ranges: 5.0% for AGIs below $25k, 3.3% for AGIs $25k-50k, 1.7% for AGIs $50k-75k, 2.2% for AGIs $75k-100k, 1.2% for AGIs $100k-200k)
Taxable individual retirement arrangement distribution: $9,855 (reported on 6.8% of returns)
02859:
$9,855
Rhode Island:
$14,081
(% of AGI for various income ranges: 2.6% for AGIs below $25k, 1.2% for AGIs $25k-50k, 1.2% for AGIs $50k-75k, 1.2% for AGIs $75k-100k, 1.3% for AGIs $100k-200k)
Total itemized deductions: $20,318 (24% of AGI, reported on 40.1% of returns)
Here:
$20,318
State:
$24,445
Here:
23.5% of AGI
State:
20.5% of AGI
(% of AGI for various income ranges: 9.2% for AGIs below $25k, 12.1% for AGIs $25k-50k, 16.7% for AGIs $50k-75k, 16.9% for AGIs $75k-100k, 17.0% for AGIs $100k-200k, 16.3% for AGIs over 200k)
Charity contributions: $1,655 (reported on 31.3% of returns)
Here:
$1,655
State:
$2,961
(% of AGI for various income ranges: 0.5% for AGIs below $25k, 0.7% for AGIs $25k-50k, 1.1% for AGIs $50k-75k, 1.1% for AGIs $75k-100k, 1.1% for AGIs $100k-200k, 1.1% for AGIs over 200k)
Taxes paid: $8,997 (reported on 40.1% of returns)
02859:
$8,997
State:
$11,235
(% of AGI for various income ranges: 2.7% for AGIs below $25k, 4.3% for AGIs $25k-50k, 6.7% for AGIs $50k-75k, 7.4% for AGIs $75k-100k, 8.4% for AGIs $100k-200k, 9.6% for AGIs over 200k)
Earned income credit: $1,947 (reported on 12.9% of returns)
Here:
$1,947
State:
$2,170
(% of AGI for various income ranges: 4.7% for AGIs below $25k, 0.7% for AGIs $25k-50k)
Percentage of individuals using paid preparers for their 2012 taxes: 58.8%
Here:
59%
State:
60%
(% for various income ranges: 50.5% for AGIs below $25k, 58.0% for AGIs $25k-50k, 65.4% for AGIs $50k-75k, 65.7% for AGIs $75k-100k, 65.7% for AGIs $100k-200k, 75.0% for AGIs over 200k)
Averages for the 2004 tax year for zip code 02859, filed in 2005:
Average Adjusted Gross Income (AGI) in 2004: $46,299 (Individual Income Tax Returns)
Here:
$46,299
State:
$51,090
Salary/wage: $43,030 (reported on 90.8% of returns)
Here:
$43,030
State:
$43,690
(% of AGI for various income ranges: 104.7% for AGIs below $10k, 80.2% for AGIs $10k-25k, 85.0% for AGIs $25k-50k, 87.2% for AGIs $50k-75k, 89.0% for AGIs $75k-100k, 77.6% for AGIs over 100k)
Taxable interest for individuals: $629 (reported on 51.6% of returns)
This zip code:
$629
Rhode Island:
$1,567
(% of AGI for various income ranges: 3.2% for AGIs below $10k, 1.4% for AGIs $10k-25k, 0.6% for AGIs $25k-50k, 0.7% for AGIs $50k-75k, 0.5% for AGIs $75k-100k, 0.6% for AGIs over 100k)
Taxable dividends: $1,168 (reported on 16.5% of returns)
Here:
$1,168
State:
$3,896
(% of AGI for various income ranges: 1.1% for AGIs below $10k, 0.5% for AGIs $10k-25k, 0.8% for AGIs $25k-50k, 0.2% for AGIs $50k-75k, 0.3% for AGIs $75k-100k, 0.3% for AGIs over 100k)
Net capital gain/loss: +$8,200 (reported on 12.7% of returns)
Here:
+$8,200
State:
+$15,829
(% of AGI for various income ranges: -2.1% for AGIs below $10k, 0.1% for AGIs $10k-25k, -0.1% for AGIs $25k-50k, 0.4% for AGIs $50k-75k, 0.4% for AGIs $75k-100k, 8.1% for AGIs over 100k)
Profit/loss from business: +$11,097 (reported on 11.6% of returns)
Here:
+$11,097
State:
+$15,557
(% of AGI for various income ranges: 8.7% for AGIs below $10k, 3.9% for AGIs $10k-25k, 3.1% for AGIs $25k-50k, 2.5% for AGIs $50k-75k, 1.1% for AGIs $75k-100k, 3.4% for AGIs over 100k)
IRA payment deduction: $3,023 (reported on 2.8% of returns)
02859:
$3,023
Rhode Island:
$3,092
(% of AGI for various income ranges: 1.0% for AGIs below $10k, 0.2% for AGIs $25k-50k, 0.2% for AGIs $50k-75k, 0.1% for AGIs $75k-100k, 0.2% for AGIs over 100k)
Total itemized deductions: $17,514 (23% of AGI, reported on 42.8% of returns)
Here:
$17,514
State:
$20,228
Here:
23.4% of AGI
State:
21.1% of AGI
(% of AGI for various income ranges: 11.2% for AGIs below $10k, 9.3% for AGIs $10k-25k, 13.8% for AGIs $25k-50k, 17.7% for AGIs $50k-75k, 19.6% for AGIs $75k-100k, 16.1% for AGIs over 100k)
Charity contributions deductions: $1,494 (2% of AGI, reported on 37.9% of returns)
Here:
$1,494
State:
$2,620
Here:
1.9% of AGI
State:
2.6% of AGI
(% of AGI for various income ranges: 0.6% for AGIs below $10k, 0.4% for AGIs $10k-25k, 0.9% for AGIs $25k-50k, 1.2% for AGIs $50k-75k, 1.5% for AGIs $75k-100k, 1.4% for AGIs over 100k)
Total tax: $5,461 (reported on 82.1% of returns)
02859:
$5,461
State:
$8,437
(% of AGI for various income ranges: 2.8% for AGIs below $10k, 4.8% for AGIs $10k-25k, 7.1% for AGIs $25k-50k, 8.2% for AGIs $50k-75k, 9.4% for AGIs $75k-100k, 15.0% for AGIs over 100k)
Earned income credit: $1,604 (reported on 9.6% of returns)
Here:
$1,604
State:
$1,659
Percentage of individuals using paid preparers for their 2004 taxes: 60.6%
Here:
61%
State:
63%
(% for various income ranges: 42.1% for AGIs below $10k, 58.3% for AGIs $10k-25k, 62.0% for AGIs $25k-50k, 69.3% for AGIs $50k-75k, 67.7% for AGIs $75k-100k, 69.1% for AGIs over 100k)
Likely homosexual households (counted as self-reported same-sex unmarried-partner households)
Lesbian couples: 2.3% of all households
Gay men: 0.0% of all households
Household received Food Stamps/SNAP in the past 12 months: 221 Household did not receive Food Stamps/SNAP in the past 12 months: 2,192
Women who had a birth in the past 12 months: 24 (24 now married, 0 unmarried) Women who did not have a birth in the past 12 months: 1,084 (503 now married, 584 unmarried)
Housing units in zip code 02859 with a mortgage: 1,327 (158 second mortgage, 13 home equity loan, 110 both second mortgage and home equity loan) Houses without a mortgage: 99
Median monthly owner costs for units with a mortgage: $2,073 Median monthly owner costs for units without a mortgage: $698
Residents with income below the poverty level in 2022:
This zip code:
9.5%
Whole state:
10.8%
Residents with income below 50% of the poverty level in 2022:
This zip code:
1.3%
Whole state:
5.6%
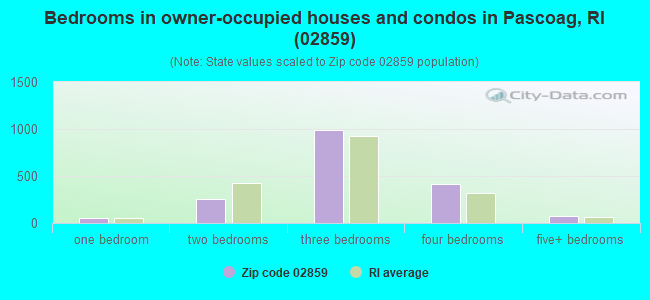
Median number of rooms in houses and condos:
Here:
6.6
State:
6.2
Median number of rooms in apartments:
Here:
4.1
State:
4.1
Notable locations in this zip code not listed on our city pages
Notable locations in zip code 02859: Pascoag Public Library (A), Pascoag Fire Department Station (B), Wallum Lake Fire Department (C), Pascoag Fire Department (D). Display/hide their locations on the map
Churches in zip code 02859 include: Calvary Episcopal Church (A), Pascoag Community Baptist Church (B), New Hope Baptist Church (C). Display/hide their locations on the map
Lakes, reservoirs, and swamps: Wilbur Pond (A), Cedar Swamp Pond (B), Round Pond (C), Peck Pond (D), Wakefield Pond (E), Wallum Lake (F), Buck Hill Pond (G), Wilbur Pond (H). Display/hide their locations on the map
Streams, rivers, and creeks: Goat Rock Brook (A), Leeson Brook (B), Cold Spring Brook (C), Dry Arm Brook (D), Iron Mine Brook (E), Leland Brook (F), Pascoag River (G). Display/hide their locations on the map
In group quarters: 354 (-1 institutionalized population)
Size of family households: 599 2-persons, 411 3-persons, 629 4-persons, 142 5-persons, 33 6-persons
Size of nonfamily households: 375 1-person, 176 2-persons
807 married couples with children.
590 single-parent households (451 men, 139 women).
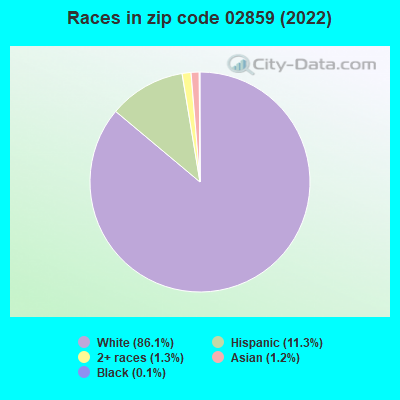
87.3% of residents of 02859 zip code speak English at home.
12.7% of residents speak Spanish at home (55% very well, 4% well, 1% not well, 40% not at all).
0.7% of residents speak other Indo-European language at home (93% very well, 7% not well).
0.1% of residents speak Asian or Pacific Island language at home (100% very well).
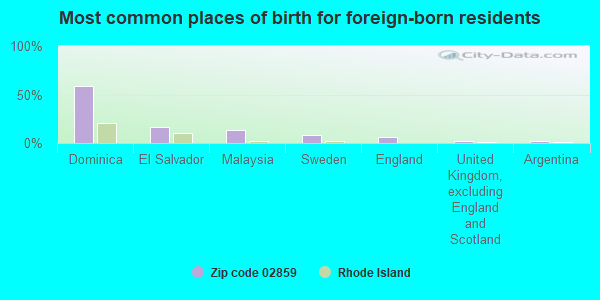
Foreign born population: 661 (9.1%) (23.5% of them are naturalized citizens)
This zip code:
9.1%
Whole state:
14.4%
59%Dominica
16%El Salvador
13%Malaysia
9%Sweden
6%England
2%United Kingdom, excluding England and Scotland
2%Argentina
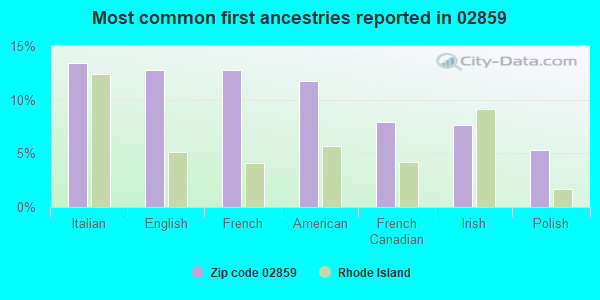
13%Italian
13%English
13%French
12%American
8%French Canadian
8%Irish
5%Polish
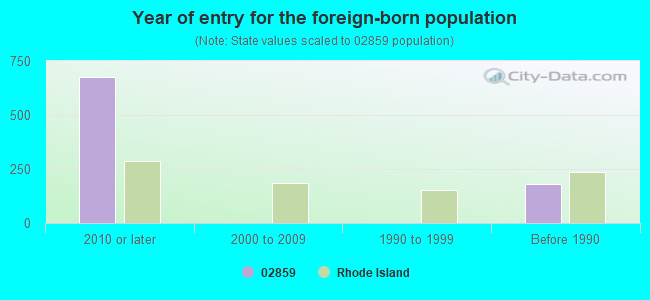
Year of entry for the foreign-born population
6782010 or later
02000 to 2009
01990 to 1999
180Before 1990
Major facilities with environmental interests located in this zip code:
ANDREW WORSTED MILLS (MAIN ST in PASCOAG, RI)
(Integrated Compliance Information System) - ICIS-01-1974-0003, FORMAL ENFORCEMENT ACTION Business SIC classification: BROADWOVEN FABRIC MILLS, WOOL (INCLUDING DYEING AND FINISHING)
JEFFREY LAMBERT ((RESIDENTIAL PROPERTY) in PASCOAG, RI)
National Pollutant Discharge Elimination System NON-MAJOR (Tracking pollutant discharge elimination systems) - permit Business SIC classification: FUEL OIL DEALERS Alternative names: JEFFREY LAMBERT (RESIDENTIAL), JEFFREY LAMBERT (RESIDENTIAL P
NORTH MAIN STREET MOBIL (24 NORTH MAIN STREET in PASCOAG, RI)
National Pollutant Discharge Elimination System NON-MAJOR (Tracking pollutant discharge elimination systems) - permit Small Quantity Generators, between 100 kg and 1000 kg of hazardous waste/month (Resource Conservation and Recovery Act (tracking hazardous waste)) - notification Business SIC classification: GASOLINE SERVICE STATIONS Organizations: RIDEM - WASTE MANAGEMENT (CONTACT/OWNER)
, HERBERT HOPKINS (CONTACT/OWNER)
Alternative names: LINCOLN ENVIRONMENTAL, INC., NORTH MAIN AUTO
AGT- BURRILLVILLE (54 ALGONQUIN LANE in PASCOAG, RI)
HAZARDOUS WASTE BIENNIAL REPORTER (Resource Conservation and Recovery Act (tracking hazardous waste)) Large Quantity Generators, more that 1000 kg of hazardous waste/month (Resource Conservation and Recovery Act (tracking hazardous waste)) Organizations: ALGONQUIN GAS TRANSMISSION COMPANY (CONTACT/OPERATOR)
Alternative names: ALGONQUIN GAS TRANSMISSION CO
LAIDLAW TRANSIT, INC. (404 MAIN STREET in PASCOAG, RI)
National Pollutant Discharge Elimination System NON-MAJOR (Tracking pollutant discharge elimination systems) - permit Business SIC classification: TERMINAL AND SERVICE FACILITIES FOR MOTOR VEHICLE PASSENGER TRANSPORTATION Alternative names: LAIDLAW TRANSIT, INC.-PASCOAG
ALWAYS AUTO (32 STAGHEAD DR in PASCOAG, RI)
(Resource Conservation and Recovery Act (tracking hazardous waste)) Organizations: NIXON MICHAEL (CONTACT/OWNER)
NELSONS INC (400 MAIN ST in PASCOAG, RI)
(Resource Conservation and Recovery Act (tracking hazardous waste)) Business NAICS classification: ALL OTHER MOTOR VEHICLE PARTS MANUFACTURING.
NORTHWEST RADIOLOGY (36 BRIDGE WAY in PASCOAG, RI)
Small Quantity Generators, between 100 kg and 1000 kg of hazardous waste/month (Resource Conservation and Recovery Act (tracking hazardous waste)) Business NAICS classification: ALL OTHER OUTPATIENT CARE CENTERS. Organizations: NORTHWEST COMMUNITY HEALTH CARE (CONTACT/OWNER)
ALWAYS AUTOMOTIVE (91 SOUTH MAIN ST in PASCOAG, RI)
Small Quantity Generators, between 100 kg and 1000 kg of hazardous waste/month (Resource Conservation and Recovery Act (tracking hazardous waste)) - notification Business NAICS classification: ALL OTHER AUTOMOTIVE REPAIR AND MAINTENANCE.
BURRIVILLE MOTOR SALES (94 S MAIN ST in PASCOAG, RI)
Small Quantity Generators, between 100 kg and 1000 kg of hazardous waste/month (Resource Conservation and Recovery Act (tracking hazardous waste)) - notification Organizations: JOHN SOLECKI (CONTACT/OWNER)
C V S 1075 (20 HIGH ST in BURRILLVILLE, RI)
Small Quantity Generators, between 100 kg and 1000 kg of hazardous waste/month (Resource Conservation and Recovery Act (tracking hazardous waste)) - notification Organizations: CVS PHARMACY (CONTACT/OWNER)
CREB ENGINEERING INC (244 DAVIS DR in PASCOAG, RI)
Small Quantity Generators, between 100 kg and 1000 kg of hazardous waste/month (Resource Conservation and Recovery Act (tracking hazardous waste)) - notification Organizations: ROBERT J SADOWSKI (CONTACT/OWNER)
G L S AUTO SALE (790 WALLUM LAKE RD in BURRILLVILLE, RI)
Conditionally Exempt Small Quantity Generators, less than 100 kg/month of hazardous waste (Resource Conservation and Recovery Act (tracking hazardous waste)) - notification Organizations: GERARD DOIRE (CONTACT/OWNER)
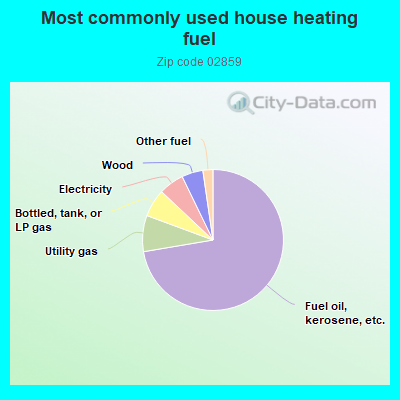
72.5%Fuel oil, kerosene, etc.
8.3%Utility gas
6.4%Bottled, tank, or LP gas
5.8%Electricity
4.9%Wood
2.3%Other fuel
Population in 1990: 7,156.
Place of birth for U.S.-born residents:
This state: 4,851
Northeast: 1,162
Midwest: 56
South: 200
West: 93
61% of the 02859 zip code residents lived in the same house 5 years ago. Out of people who lived in different houses, 85% lived in this county. Out of people who lived in different counties, 50% lived in Rhode Island.
91% of the 02859 zip code residents lived in the same house 1 year ago. Out of people who lived in different houses, 58% moved from this county. Out of people who lived in different houses, 6% moved from different county within same state. Out of people who lived in different houses, 36% moved from different state.
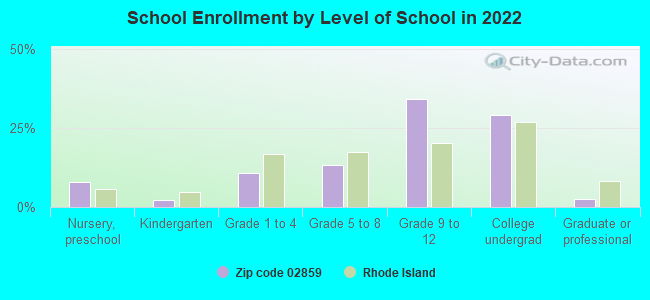
Private vs. public school enrollment:
Students in private schools in grades 1 to 8 (elementary and middle school): 43
Here:
9.6%
Rhode Island:
12.2%
Students in private schools in grades 9 to 12 (high school): 42
Here:
6.7%
Rhode Island:
11.6%
Students in private undergraduate colleges: 104
Here:
18.6%
Rhode Island:
41.1%
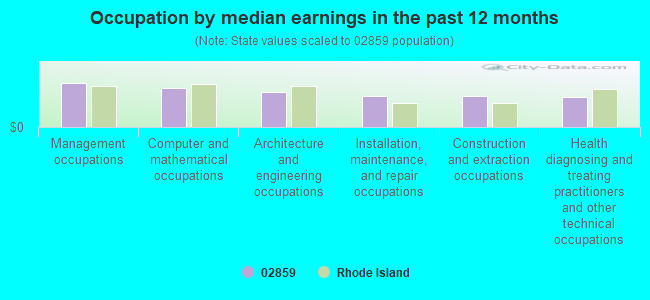
Occupation by median earnings in the past 12 months ($)
111,110Management occupations
99,240Computer and mathematical occupations
89,603Architecture and engineering occupations
79,370Installation, maintenance, and repair occupations
79,139Construction and extraction occupations
76,450Health diagnosing and treating practitioners and other technical occupations
Top industries in this zip code by the number of employees in 2005:
Health Care and Social Assistance: Nursing Care Facilities (100-249 employees: 2 establishments, 50-99 employees: 1 establishment)
Health Care and Social Assistance: Specialty (except Psychiatric and Substance Abuse) Hospitals (250-499: 1)
Other Services (except Public Administration): Religious Organizations (20-49: 1, 10-19: 1, 1-4: 1)
Accommodation and Food Services: Full-Service Restaurants (10-19: 2, 5-9: 1)
Accommodation and Food Services: Snack and Nonalcoholic Beverage Bars (20-49: 1, 1-4: 1)
Health Care and Social Assistance: All Other Outpatient Care Centers (20-49: 1)
People in group quarters in 2010:
366 people in nursing facilities/skilled-nursing facilities
38 people in group homes intended for adults
31 people in group homes for juveniles (non-correctional)
5 people in residential treatment centers for juveniles (non-correctional)
People in group quarters in 2000:
281 people in nursing homes
152 people in hospitals/wards and hospices for chronically ill
152 people in other hospitals or wards for chronically ill
17 people in homes or halfway houses for drug/alcohol abuse
8 people in homes for the mentally ill
6 people in homes for the mentally retarded
Fatal accident statistics in 2012:
Fatal accident count: 1
Vehicles involved in fatal accidents: 2
Fatal accidents caused by drunken drivers: 1
Fatalities: 1
Persons involved in fatal accidents: 2
Pedestrians involved in fatal accidents: 0
Fatal accident statistics in 2010:
Fatal accident count: 1
Vehicles involved in fatal accidents: 1
Fatal accidents caused by drunken drivers: 0
Fatalities: 1
Persons involved in fatal accidents: 1
Pedestrians involved in fatal accidents: 0
Home Mortgage Disclosure Act Aggregated Statistics For Year 2009 (Based on 6 partial tracts)
A) FHA, FSA/RHS & VA Home Purchase Loans
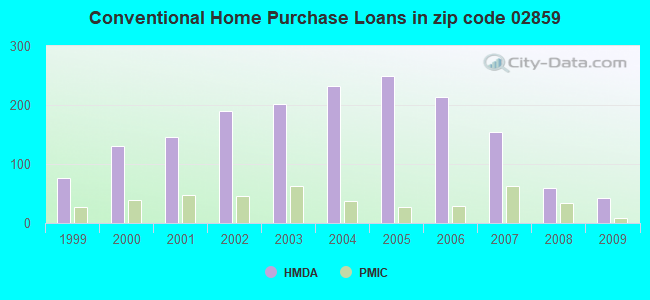
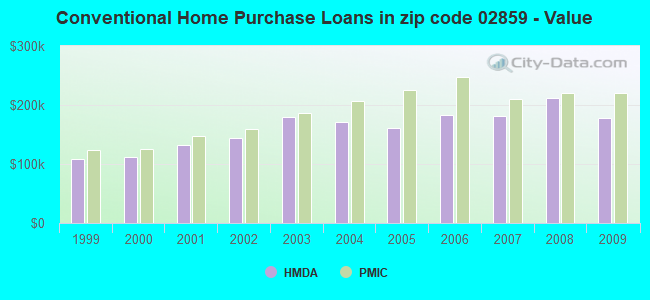
B) Conventional Home Purchase Loans
C) Refinancings
D) Home Improvement Loans
E) Loans on Dwellings For 5+ Families
F) Non-occupant Loans on < 5 Family Dwellings (A B C & D)
G) Loans On Manufactured Home Dwelling (A B C & D)
Number
Average Value
Number
Average Value
Number
Average Value
Number
Average Value
Number
Average Value
Number
Average Value
Number
Average Value
LOANS ORIGINATED
63
$188,219
43
$177,920
334
$185,076
22
$73,422
3
$185,373
10
$127,715
1
$42,470
APPLICATIONS APPROVED, NOT ACCEPTED
8
$194,006
3
$289,380
16
$184,985
0
$0
0
$0
0
$0
0
$0
APPLICATIONS DENIED
22
$185,992
8
$160,798
132
$204,322
11
$43,509
3
$347,307
5
$109,034
1
$17,190
APPLICATIONS WITHDRAWN
4
$280,600
3
$145,830
63
$188,034
0
$0
0
$0
2
$247,830
0
$0
FILES CLOSED FOR INCOMPLETENESS
2
$279,370
2
$236,740
13
$207,087
0
$0
0
$0
0
$0
0
$0
Aggregated Statistics For Year 2008 (Based on 6 partial tracts)
A) FHA, FSA/RHS & VA Home Purchase Loans
B) Conventional Home Purchase Loans
C) Refinancings
D) Home Improvement Loans
E) Loans on Dwellings For 5+ Families
F) Non-occupant Loans on < 5 Family Dwellings (A B C & D)
G) Loans On Manufactured Home Dwelling (A B C & D)
Number
Average Value
Number
Average Value
Number
Average Value
Number
Average Value
Number
Average Value
Number
Average Value
Number
Average Value
LOANS ORIGINATED
42
$223,866
60
$212,523
201
$185,547
30
$46,360
0
$0
15
$197,110
2
$41,205
APPLICATIONS APPROVED, NOT ACCEPTED
4
$234,770
11
$256,973
31
$218,506
3
$50,347
0
$0
2
$135,005
0
$0
APPLICATIONS DENIED
10
$234,567
19
$210,905
148
$213,850
32
$89,336
1
$429,790
14
$185,229
0
$0
APPLICATIONS WITHDRAWN
7
$246,330
13
$229,432
49
$235,864
5
$36,080
0
$0
3
$202,520
0
$0
FILES CLOSED FOR INCOMPLETENESS
2
$166,215
2
$174,510
14
$241,853
0
$0
0
$0
0
$0
0
$0
Aggregated Statistics For Year 2007 (Based on 6 partial tracts)
A) FHA, FSA/RHS & VA Home Purchase Loans
B) Conventional Home Purchase Loans
C) Refinancings
D) Home Improvement Loans
E) Loans on Dwellings For 5+ Families
F) Non-occupant Loans on < 5 Family Dwellings (A B C & D)
G) Loans On Manufactured Home Dwelling (A B C & D)
Number
Average Value
Number
Average Value
Number
Average Value
Number
Average Value
Number
Average Value
Number
Average Value
Number
Average Value
LOANS ORIGINATED
2
$245,845
155
$181,726
316
$175,361
81
$70,078
3
$329,940
20
$208,103
2
$32,485
APPLICATIONS APPROVED, NOT ACCEPTED
0
$0
13
$202,193
83
$209,396
14
$56,580
0
$0
5
$313,324
0
$0
APPLICATIONS DENIED
1
$80,900
32
$165,247
252
$216,195
61
$88,276
0
$0
5
$102,478
1
$64,720
APPLICATIONS WITHDRAWN
0
$0
6
$228,402
92
$218,573
11
$38,602
0
$0
3
$391,117
0
$0
FILES CLOSED FOR INCOMPLETENESS
0
$0
8
$196,634
48
$225,442
2
$235,470
0
$0
1
$384,210
0
$0
Aggregated Statistics For Year 2006 (Based on 6 partial tracts)
A) FHA, FSA/RHS & VA Home Purchase Loans
B) Conventional Home Purchase Loans
C) Refinancings
D) Home Improvement Loans
E) Loans on Dwellings For 5+ Families
F) Non-occupant Loans on < 5 Family Dwellings (A B C & D)
G) Loans On Manufactured Home Dwelling (A B C & D)
Number
Average Value
Number
Average Value
Number
Average Value
Number
Average Value
Number
Average Value
Number
Average Value
Number
Average Value
LOANS ORIGINATED
9
$273,407
213
$182,545
543
$170,547
129
$89,504
2
$287,110
43
$184,363
1
$56,120
APPLICATIONS APPROVED, NOT ACCEPTED
0
$0
12
$200,294
91
$184,330
13
$61,799
0
$0
5
$142,808
0
$0
APPLICATIONS DENIED
1
$208,380
49
$173,549
255
$190,708
80
$56,624
3
$218,370
21
$212,154
4
$109,988
APPLICATIONS WITHDRAWN
0
$0
13
$195,552
200
$195,453
9
$112,778
0
$0
10
$152,886
0
$0
FILES CLOSED FOR INCOMPLETENESS
0
$0
8
$175,391
57
$248,125
1
$293,040
1
$547,010
2
$282,915
0
$0
Aggregated Statistics For Year 2005 (Based on 6 partial tracts)
A) FHA, FSA/RHS & VA Home Purchase Loans
B) Conventional Home Purchase Loans
C) Refinancings
D) Home Improvement Loans
E) Loans on Dwellings For 5+ Families
F) Non-occupant Loans on < 5 Family Dwellings (A B C & D)
G) Loans On Manufactured Home Dwelling (A B C & D)
Number
Average Value
Number
Average Value
Number
Average Value
Number
Average Value
Number
Average Value
Number
Average Value
Number
Average Value
LOANS ORIGINATED
6
$216,343
249
$160,817
647
$185,205
113
$90,688
2
$203,515
48
$162,002
4
$57,005
APPLICATIONS APPROVED, NOT ACCEPTED
0
$0
16
$174,512
62
$183,009
13
$115,228
0
$0
2
$192,055
2
$55,315
APPLICATIONS DENIED
0
$0
46
$157,508
251
$201,171
55
$56,981
0
$0
19
$153,367
2
$69,145
APPLICATIONS WITHDRAWN
0
$0
55
$167,185
356
$189,605
30
$167,091
3
$200,570
27
$198,269
0
$0
FILES CLOSED FOR INCOMPLETENESS
0
$0
3
$122,307
83
$225,092
5
$39,528
0
$0
2
$228,285
0
$0
Aggregated Statistics For Year 2004 (Based on 6 partial tracts)
A) FHA, FSA/RHS & VA Home Purchase Loans
B) Conventional Home Purchase Loans
C) Refinancings
D) Home Improvement Loans
E) Loans on Dwellings For 5+ Families
F) Non-occupant Loans on < 5 Family Dwellings (A B C & D)
G) Loans On Manufactured Home Dwelling (A B C & D)
Number
Average Value
Number
Average Value
Number
Average Value
Number
Average Value
Number
Average Value
Number
Average Value
Number
Average Value
LOANS ORIGINATED
12
$195,532
232
$171,624
717
$159,598
102
$94,042
5
$259,804
45
$163,632
0
$0
APPLICATIONS APPROVED, NOT ACCEPTED
0
$0
19
$215,273
94
$168,072
18
$83,414
0
$0
7
$161,679
1
$25,030
APPLICATIONS DENIED
3
$220,633
55
$168,925
226
$155,489
68
$67,752
0
$0
14
$187,422
3
$38,897
APPLICATIONS WITHDRAWN
0
$0
27
$191,461
368
$169,686
26
$83,026
3
$82,487
8
$280,834
1
$114,610
FILES CLOSED FOR INCOMPLETENESS
0
$0
10
$208,745
58
$194,724
6
$34,203
0
$0
4
$333,358
0
$0
Aggregated Statistics For Year 2003 (Based on 6 partial tracts)
A) FHA, FSA/RHS & VA Home Purchase Loans
B) Conventional Home Purchase Loans
C) Refinancings
D) Home Improvement Loans
E) Loans on Dwellings For 5+ Families
F) Non-occupant Loans on < 5 Family Dwellings (A B C & D)
Number
Average Value
Number
Average Value
Number
Average Value
Number
Average Value
Number
Average Value
Number
Average Value
LOANS ORIGINATED
24
$183,565
202
$179,211
1,345
$129,556
77
$57,170
3
$240,077
45
$130,882
APPLICATIONS APPROVED, NOT ACCEPTED
2
$121,080
25
$187,946
202
$137,692
19
$50,364
0
$0
6
$119,113
APPLICATIONS DENIED
2
$205,195
23
$158,103
278
$126,234
46
$50,107
0
$0
19
$111,303
APPLICATIONS WITHDRAWN
4
$202,698
7
$177,319
431
$146,551
18
$48,402
1
$306,060
4
$120,472
FILES CLOSED FOR INCOMPLETENESS
2
$149,265
5
$198,678
38
$122,104
0
$0
0
$0
0
$0
Aggregated Statistics For Year 2002 (Based on 6 partial tracts)
A) FHA, FSA/RHS & VA Home Purchase Loans
B) Conventional Home Purchase Loans
C) Refinancings
D) Home Improvement Loans
E) Loans on Dwellings For 5+ Families
F) Non-occupant Loans on < 5 Family Dwellings (A B C & D)
Number
Average Value
Number
Average Value
Number
Average Value
Number
Average Value
Number
Average Value
Number
Average Value
LOANS ORIGINATED
45
$153,133
190
$144,498
840
$120,341
65
$42,365
5
$699,388
22
$100,410
APPLICATIONS APPROVED, NOT ACCEPTED
0
$0
15
$150,147
143
$114,417
17
$37,744
0
$0
5
$96,742
APPLICATIONS DENIED
5
$182,976
26
$133,963
213
$106,207
37
$27,634
0
$0
9
$86,661
APPLICATIONS WITHDRAWN
7
$163,389
11
$215,969
185
$117,327
23
$19,148
1
$280,020
4
$274,055
FILES CLOSED FOR INCOMPLETENESS
0
$0
10
$115,767
27
$115,288
2
$18,175
0
$0
0
$0
Aggregated Statistics For Year 2001 (Based on 6 partial tracts)
A) FHA, FSA/RHS & VA Home Purchase Loans
B) Conventional Home Purchase Loans
C) Refinancings
D) Home Improvement Loans
E) Loans on Dwellings For 5+ Families
F) Non-occupant Loans on < 5 Family Dwellings (A B C & D)
Number
Average Value
Number
Average Value
Number
Average Value
Number
Average Value
Number
Average Value
Number
Average Value
LOANS ORIGINATED
64
$131,764
146
$131,659
581
$107,314
78
$41,385
0
$0
16
$98,209
APPLICATIONS APPROVED, NOT ACCEPTED
2
$102,265
20
$114,824
87
$95,311
20
$31,014
1
$261,780
3
$79,447
APPLICATIONS DENIED
2
$141,215
34
$116,566
223
$93,819
52
$31,773
0
$0
10
$46,306
APPLICATIONS WITHDRAWN
6
$121,737
8
$95,390
162
$99,514
22
$19,311
0
$0
2
$65,935
FILES CLOSED FOR INCOMPLETENESS
2
$116,535
3
$116,790
20
$103,952
0
$0
1
$337,320
0
$0
Aggregated Statistics For Year 2000 (Based on 6 partial tracts)
A) FHA, FSA/RHS & VA Home Purchase Loans
B) Conventional Home Purchase Loans
C) Refinancings
D) Home Improvement Loans
E) Loans on Dwellings For 5+ Families
F) Non-occupant Loans on < 5 Family Dwellings (A B C & D)
Number
Average Value
Number
Average Value
Number
Average Value
Number
Average Value
Number
Average Value
Number
Average Value
LOANS ORIGINATED
44
$116,281
131
$112,397
196
$74,102
95
$25,018
3
$156,723
10
$89,167
APPLICATIONS APPROVED, NOT ACCEPTED
1
$145,870
20
$135,984
45
$69,636
20
$21,546
0
$0
3
$61,023
APPLICATIONS DENIED
3
$128,627
18
$88,964
135
$68,149
50
$33,218
0
$0
2
$89,620
APPLICATIONS WITHDRAWN
1
$160,280
9
$87,458
118
$83,536
7
$30,109
1
$13,020
2
$78,795
FILES CLOSED FOR INCOMPLETENESS
2
$101,195
3
$131,810
7
$77,866
4
$21,372
0
$0
1
$100,280
Aggregated Statistics For Year 1999 (Based on 3 partial tracts)
A) FHA, FSA/RHS & VA Home Purchase Loans
B) Conventional Home Purchase Loans
C) Refinancings
D) Home Improvement Loans
E) Loans on Dwellings For 5+ Families
F) Non-occupant Loans on < 5 Family Dwellings (A B C & D)
2003 - 2018 National Fire Incident Reporting System (NFIRS) incidents
Based on the data from the years 2003 - 2018 the average number of fire incidents per year is 8. The highest number of reported fires - 21 took place in 2010, and the least - 0 in 2005. The data has a decreasing trend.
When looking into fire subcategories, the most incidents belonged to: Structure Fires (59.4%), and Outside Fires (25.0%).
Fire incident types reported to NFIRS in Zip Code 02859


 Nearest zip codes: 02814, 06277, 01516, 02858, 02830, 02826.


 Based on the data from the years 2003 - 2018 the average number of fire incidents per year is 8. The highest number of reported fires - 21 took place in 2010, and the least - 0 in 2005. The data has a decreasing trend.
 When looking into fire subcategories, the most incidents belonged to: Structure Fires (59.4%), and Outside Fires (25.0%).