Estimated zip code population in 2022: 5,917 Zip code population in 2010: 4,988 Zip code population in 2000: 4,581
Houses and condos: 2,211 Renter-occupied apartments: 189
% of renters here:
9%
State:
37%
March 2022 cost of living index in zip code 02892: 91.2 (less than average, U.S. average is 100)
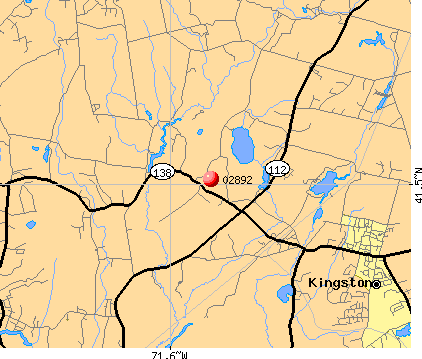
Land area: 27.4 sq. mi. Water area: 1.9 sq. mi.
Population density: 216 people per square mile
(very low).
OSM Map
Google Map
MSN Map
OSM Map
General Map
Google Map
MSN Map
OSM Map
Google Map
MSN Map
OSM Map
Google Map
MSN Map
Please wait while loading the map...
Real estate property taxes paid for housing units in 2022:
This zip code:
1.3% ($6,170)
Rhode Island:
1.2% ($4,726)
Median real estate property taxes paid for housing units with mortgages in 2022: $6,621 (1.4%) Median real estate property taxes paid for housing units with no mortgage in 2022: $5,401 (1.0%)
Business Search- 14 Million verified businesses
Males: 2,753
(46.5%)
Females: 3,163
(53.5%)
For population 25 years and over in 02892:
High school or higher: 99.8%
Bachelor's degree or higher: 53.8%
Graduate or professional degree: 30.0%
Unemployed: 2.4%
Mean travel time to work (commute): 32.4 minutes
For population 15 years and over in 02892:
Never married: 19.1%
Now married: 60.5%
Separated: 0.8%
Widowed: 6.0%
Divorced: 13.6%
Zip code 02892 compared to state average:
Median household income above state average.
Unemployed percentage below state average.
Black race population percentage significantly below state average.
Hispanic race population percentage significantly below state average.
Foreign-born population percentage significantly below state average.
Renting percentage significantly below state average.
Length of stay since moving in significantly above state average.
Estimated median house/condo value in 2022: $486,728
02892:
$486,728
Rhode Island:
$383,900
According to our research of Rhode Island and other state lists, there were 2 registered sex offenders living in 02892 zip code as of May 23, 2024. The ratio of all residents to sex offenders in zip code 02892 is 2,359 to 1. The ratio of registered sex offenders to all residents in this zip code is lower than the state average.
Median resident age:
This zip code:
41.5 years
Rhode Island median age:
40.7 years
Average household size:
This zip code:
2.8 people
Rhode Island:
2.4 people
Averages for the 2020 tax year for zip code 02892, filed in 2021:
Average Adjusted Gross Income (AGI) in 2020: $88,934 (Individual Income Tax Returns)
Here:
$88,934
State:
$74,300
Salary/wage: $75,796 (reported on 83.5% of returns)
Here:
$75,796
State:
$60,330
(% of AGI for various income ranges: 1128.1% for AGIs below $25k, 3287.0% for AGIs $25k-50k, 6325.9% for AGIs $50k-75k, 8896.8% for AGIs $75k-100k, 18636.7% for AGIs $100k-200k, 72390.0% for AGIs over 200k)
Taxable interest for individuals: $1,148 (reported on 37.5% of returns)
This zip code:
$1,148
Rhode Island:
$1,971
(% of AGI for various income ranges: 17.0% for AGIs below $25k, 21.6% for AGIs $25k-50k, 66.7% for AGIs $50k-75k, 98.4% for AGIs $75k-100k, 79.5% for AGIs $100k-200k, 524.3% for AGIs over 200k)
Ordinary dividends: $4,573 (reported on 26.3% of returns)
Here:
$4,573
State:
$7,621
(% of AGI for various income ranges: 21.9% for AGIs below $25k, 46.8% for AGIs $25k-50k, 116.7% for AGIs $50k-75k, 188.9% for AGIs $75k-100k, 282.9% for AGIs $100k-200k, 1845.7% for AGIs over 200k)
Net capital gain/loss in AGI: +$11,082 (reported on 23.5% of returns)
Here:
+$11,082
State:
+$26,041
(% of AGI for various income ranges: 10.9% for AGIs below $25k, 36.5% for AGIs $25k-50k, 81.1% for AGIs $50k-75k, 214.7% for AGIs $75k-100k, 482.1% for AGIs $100k-200k, 6552.9% for AGIs over 200k)
Profit/loss from business: +$15,528 (reported on 17.5% of returns)
Here:
+$15,528
State:
+$15,775
(% of AGI for various income ranges: 128.7% for AGIs below $25k, 292.2% for AGIs $25k-50k, 403.0% for AGIs $50k-75k, 491.1% for AGIs $75k-100k, 570.5% for AGIs $100k-200k, 2372.9% for AGIs over 200k)
Taxable individual retirement arrangement distribution: $22,387 (reported on 10.9% of returns)
02892:
$22,387
Rhode Island:
$18,801
(% of AGI for various income ranges: 48.3% for AGIs below $25k, 130.8% for AGIs $25k-50k, 214.1% for AGIs $50k-75k, 434.7% for AGIs $75k-100k, 693.8% for AGIs $100k-200k, 2730.0% for AGIs over 200k)
Self-employed (Keogh) retirement plans: $18,500 (reported on 0.7% of returns)
02892:
$18,500
Rhode Island:
$23,424
(% of AGI for various income ranges: 88.1% for AGIs $100k-200k)
Total itemized deductions: $28,386 (reported on 12.6% of returns)
Here:
$28,386
State:
$29,550
(% of AGI for various income ranges: 208.9% for AGIs $25k-50k, 494.8% for AGIs $50k-75k, 784.7% for AGIs $75k-100k, 989.5% for AGIs $100k-200k, 3518.6% for AGIs over 200k)
Charity contributions: $5,923 (reported on 9.1% of returns)
Here:
$5,923
State:
$7,826
(% of AGI for various income ranges: 55.2% for AGIs $50k-75k, 63.7% for AGIs $75k-100k, 153.6% for AGIs $100k-200k, 892.9% for AGIs over 200k)
Taxes paid: $8,881 (reported on 12.6% of returns)
02892:
$8,881
State:
$8,398
(% of AGI for various income ranges: 48.6% for AGIs $25k-50k, 171.9% for AGIs $50k-75k, 294.2% for AGIs $75k-100k, 316.4% for AGIs $100k-200k, 950.0% for AGIs over 200k)
Earned income credit: $1,659 (reported on 6.0% of returns)
Here:
$1,659
State:
$2,059
(% of AGI for various income ranges: 35.3% for AGIs below $25k, 31.4% for AGIs $25k-50k)
Percentage of individuals using paid preparers for their 2020 taxes: 92.6%
Here:
93%
State:
94%
(% for various income ranges: 89.0% for AGIs below $25k, 93.8% for AGIs $25k-50k, 92.5% for AGIs $50k-75k, 89.7% for AGIs $75k-100k, 95.9% for AGIs $100k-200k, 95.5% for AGIs over 200k)
Averages for the 2012 tax year for zip code 02892, filed in 2013:
Average Adjusted Gross Income (AGI) in 2012: $72,466 (Individual Income Tax Returns)
Here:
$72,466
State:
$60,628
Salary/wage: $64,731 (reported on 85.2% of returns)
Here:
$64,731
State:
$50,029
(% of AGI for various income ranges: 70.8% for AGIs below $25k, 71.8% for AGIs $25k-50k, 70.7% for AGIs $50k-75k, 81.6% for AGIs $75k-100k, 83.2% for AGIs $100k-200k, 64.1% for AGIs over 200k)
Taxable interest for individuals: $752 (reported on 42.8% of returns)
This zip code:
$752
Rhode Island:
$1,640
(% of AGI for various income ranges: 0.8% for AGIs below $25k, 0.9% for AGIs $25k-50k, 0.5% for AGIs $50k-75k, 0.4% for AGIs $75k-100k, 0.3% for AGIs $100k-200k, 0.4% for AGIs over 200k)
Ordinary dividends: $2,980 (reported on 27.6% of returns)
Here:
$2,980
State:
$6,396
(% of AGI for various income ranges: 1.1% for AGIs below $25k, 1.2% for AGIs $25k-50k, 1.4% for AGIs $50k-75k, 1.2% for AGIs $75k-100k, 0.7% for AGIs $100k-200k, 1.7% for AGIs over 200k)
Net capital gain/loss in AGI: +$3,665 (reported on 19.2% of returns)
Here:
+$3,665
State:
+$15,680
(% of AGI for various income ranges: 0.7% for AGIs $50k-75k, 0.7% for AGIs $75k-100k, 0.6% for AGIs $100k-200k, 2.8% for AGIs over 200k)
Profit/loss from business: +$15,509 (reported on 17.6% of returns)
Here:
+$15,509
State:
+$15,678
(% of AGI for various income ranges: 10.7% for AGIs below $25k, 6.5% for AGIs $25k-50k, 6.4% for AGIs $50k-75k, 3.5% for AGIs $75k-100k, 2.8% for AGIs $100k-200k, 1.3% for AGIs over 200k)
Taxable individual retirement arrangement distribution: $13,817 (reported on 9.6% of returns)
02892:
$13,817
Rhode Island:
$14,081
(% of AGI for various income ranges: 3.7% for AGIs below $25k, 2.9% for AGIs $25k-50k, 2.7% for AGIs $50k-75k, 2.0% for AGIs $75k-100k, 1.9% for AGIs $100k-200k)
Self-employment retirement plans: $9,500 (reported on 1.2% of returns)
02892:
$9,500
Rhode Island:
$18,642
Total itemized deductions: $23,275 (21% of AGI, reported on 52.0% of returns)
Here:
$23,275
State:
$24,445
Here:
20.9% of AGI
State:
20.5% of AGI
(% of AGI for various income ranges: 14.7% for AGIs below $25k, 15.5% for AGIs $25k-50k, 18.7% for AGIs $50k-75k, 17.6% for AGIs $75k-100k, 18.1% for AGIs $100k-200k, 12.7% for AGIs over 200k)
Charity contributions: $2,447 (reported on 42.8% of returns)
Here:
$2,447
State:
$2,961
(% of AGI for various income ranges: 0.5% for AGIs below $25k, 0.9% for AGIs $25k-50k, 1.4% for AGIs $50k-75k, 1.4% for AGIs $75k-100k, 1.7% for AGIs $100k-200k, 1.5% for AGIs over 200k)
Taxes paid: $10,879 (reported on 52.0% of returns)
02892:
$10,879
State:
$11,235
(% of AGI for various income ranges: 4.3% for AGIs below $25k, 6.9% for AGIs $25k-50k, 7.2% for AGIs $50k-75k, 7.9% for AGIs $75k-100k, 8.7% for AGIs $100k-200k, 7.5% for AGIs over 200k)
Earned income credit: $1,570 (reported on 8.0% of returns)
Here:
$1,570
State:
$2,170
(% of AGI for various income ranges: 2.8% for AGIs below $25k, 0.6% for AGIs $25k-50k)
Percentage of individuals using paid preparers for their 2012 taxes: 52.8%
Here:
53%
State:
60%
(% for various income ranges: 44.6% for AGIs below $25k, 50.0% for AGIs $25k-50k, 56.4% for AGIs $50k-75k, 57.1% for AGIs $75k-100k, 56.4% for AGIs $100k-200k, 80.0% for AGIs over 200k)
Averages for the 2004 tax year for zip code 02892, filed in 2005:
Average Adjusted Gross Income (AGI) in 2004: $61,143 (Individual Income Tax Returns)
Here:
$61,143
State:
$51,090
Salary/wage: $52,992 (reported on 87.3% of returns)
Here:
$52,992
State:
$43,690
(% of AGI for various income ranges: 91.3% for AGIs below $10k, 70.6% for AGIs $10k-25k, 78.5% for AGIs $25k-50k, 82.8% for AGIs $50k-75k, 85.4% for AGIs $75k-100k, 69.0% for AGIs over 100k)
Taxable interest for individuals: $1,073 (reported on 61.4% of returns)
This zip code:
$1,073
Rhode Island:
$1,567
(% of AGI for various income ranges: 5.2% for AGIs below $10k, 1.8% for AGIs $10k-25k, 1.3% for AGIs $25k-50k, 0.6% for AGIs $50k-75k, 0.6% for AGIs $75k-100k, 1.2% for AGIs over 100k)
Taxable dividends: $2,082 (reported on 31.2% of returns)
Here:
$2,082
State:
$3,896
(% of AGI for various income ranges: 4.2% for AGIs below $10k, 1.2% for AGIs $10k-25k, 0.9% for AGIs $25k-50k, 0.5% for AGIs $50k-75k, 0.8% for AGIs $75k-100k, 1.3% for AGIs over 100k)
Net capital gain/loss: +$8,293 (reported on 22.4% of returns)
Here:
+$8,293
State:
+$15,829
(% of AGI for various income ranges: -3.4% for AGIs below $10k, 0.7% for AGIs $10k-25k, -0.5% for AGIs $25k-50k, -0.0% for AGIs $50k-75k, 1.3% for AGIs $75k-100k, 6.0% for AGIs over 100k)
Profit/loss from business: +$14,586 (reported on 19.1% of returns)
Here:
+$14,586
State:
+$15,557
(% of AGI for various income ranges: 11.3% for AGIs below $10k, 10.8% for AGIs $10k-25k, 5.3% for AGIs $25k-50k, 4.6% for AGIs $50k-75k, 3.9% for AGIs $75k-100k, 3.8% for AGIs over 100k)
Profit/loss from farming: +$3,231 (reported on 0.5% of returns)
Here:
+$3,231
State:
-$1,365
IRA payment deduction: $3,062 (reported on 3.2% of returns)
02892:
$3,062
Rhode Island:
$3,092
(% of AGI for various income ranges: 0.4% for AGIs $25k-50k, 0.2% for AGIs $50k-75k, 0.2% for AGIs $75k-100k, 0.1% for AGIs over 100k)
Self-employed pension: $9,559 (reported on 1.4% of returns)
Here:
$9,559
Rhode Island:
$14,597
Total itemized deductions: $20,223 (21% of AGI, reported on 51.6% of returns)
Here:
$20,223
State:
$20,228
Here:
20.8% of AGI
State:
21.1% of AGI
(% of AGI for various income ranges: 18.2% for AGIs below $10k, 15.3% for AGIs $10k-25k, 15.1% for AGIs $25k-50k, 20.1% for AGIs $50k-75k, 19.9% for AGIs $75k-100k, 15.6% for AGIs over 100k)
Charity contributions deductions: $2,362 (2% of AGI, reported on 46.5% of returns)
Here:
$2,362
State:
$2,620
Here:
2.3% of AGI
State:
2.6% of AGI
(% of AGI for various income ranges: 0.6% for AGIs below $10k, 0.8% for AGIs $10k-25k, 1.0% for AGIs $25k-50k, 1.7% for AGIs $50k-75k, 2.0% for AGIs $75k-100k, 2.1% for AGIs over 100k)
Total tax: $9,499 (reported on 82.9% of returns)
02892:
$9,499
State:
$8,437
(% of AGI for various income ranges: 3.9% for AGIs below $10k, 5.4% for AGIs $10k-25k, 7.8% for AGIs $25k-50k, 8.9% for AGIs $50k-75k, 9.6% for AGIs $75k-100k, 17.7% for AGIs over 100k)
Earned income credit: $1,380 (reported on 6.6% of returns)
Here:
$1,380
State:
$1,659
Percentage of individuals using paid preparers for their 2004 taxes: 53.5%
Here:
54%
State:
63%
(% for various income ranges: 40.6% for AGIs below $10k, 45.1% for AGIs $10k-25k, 55.1% for AGIs $25k-50k, 65.2% for AGIs $50k-75k, 58.4% for AGIs $75k-100k, 59.0% for AGIs over 100k)
Household received Food Stamps/SNAP in the past 12 months: 0 Household did not receive Food Stamps/SNAP in the past 12 months: 2,065
Women who had a birth in the past 12 months: 116 (116 now married, 0 unmarried) Women who did not have a birth in the past 12 months: 1,172 (514 now married, 660 unmarried)
Housing units in zip code 02892 with a mortgage: 1,320 (267 second mortgage, 46 home equity loan, 229 both second mortgage and home equity loan) Houses without a mortgage: 51
Median monthly owner costs for units with a mortgage: $2,259 Median monthly owner costs for units without a mortgage: $838
Residents with income below the poverty level in 2022:
This zip code:
2.0%
Whole state:
10.8%
Residents with income below 50% of the poverty level in 2022:
This zip code:
0.9%
Whole state:
5.6%
Median number of rooms in houses and condos:
Here:
6.7
State:
6.2
Median number of rooms in apartments:
Here:
5.3
State:
4.1
Notable locations in this zip code not listed on our city pages
Notable locations in zip code 02892: Kingston Fairgrounds (A), Laurel Lane Golf Course (B), Burlingame Brook (C), Richmond Grange (D), Shannock Mill Complex (E), Kenyon Grist Mill (F), Richmond - Carolina Fire District Station 62 (G), Richmond - Carolina Fire District Station 63 (H), West Kingston Fire Department (I), Kingston Free Library Branch South Kingston Public Library (J), Old Washington County Courthouse (K), Pettaquamscutt Historical Society Building (L), Pettaquamscutt Historical Society Library (M), South County Art Association (N), South County Center for the Performing Arts (O). Display/hide their locations on the map
Churches in zip code 02892 include: Kingston Congregational Church (A), Saint Augustines Church (B), Unitarian Universalist Congregation of South County (C), West Kingston Baptist Church (D). Display/hide their locations on the map
Lakes, reservoirs, and swamps: Yawgoo Pond (A), Thirty Acre Pond (B), Barber Pond (C), Hundred Acre Pond (D), Worden Pond (E), Bailey Pond (F), Long Pond (G), No Bottom Pond (H). Display/hide their locations on the map
Streams, rivers, and creeks: Glen Rock Brook (A), Chipuxet River (B), Pasquiset Brook (C), Usquepaug River (D), Mink Brook (E), Rake Factory Brook (F), Sherman Brook (G), Queen River (H), Chickasheen Brook (I). Display/hide their locations on the map
Parks in zip code 02892 include: Usquepaug Road Historic District (1), Great Swamp Wildlife Reservation (2), Great Swamp Fight Site (3). Display/hide their locations on the map
In group quarters: 136 (-1 institutionalized population)
Size of family households: 682 2-persons, 370 3-persons, 425 4-persons, 89 5-persons, 76 6-persons, 21 7-or-more-persons
Size of nonfamily households: 256 1-person, 93 2-persons
1,194 married couples with children.
209 single-parent households (41 men, 168 women).
93.0% of residents of 02892 zip code speak English at home.
0.8% of residents speak Spanish at home (100% very well).
4.3% of residents speak other Indo-European language at home (93% very well, 7% not well).
0.7% of residents speak Asian or Pacific Island language at home (100% very well).
0.4% of residents speak other language at home (100% very well).
Foreign born population: 140 (2.4%) (88.4% of them are naturalized citizens)
This zip code:
2.4%
Whole state:
14.4%
19%Malaysia
14%Kuwait
10%Italy
9%Czechoslovakia (includes Czech Republic and Slovakia)
8%Denmark
2%Syria
22%English
17%Italian
12%Irish
10%Swedish
8%American
6%French Canadian
5%French
Year of entry for the foreign-born population
02010 or later
152000 to 2009
581990 to 1999
85Before 1990
Major facilities with environmental interests located in this zip code:
AMERICAN POWER CONVERSION CORP (132 FAIRGROUNDS RD in WEST KINGSTON, RI)
AIR MINOR (AIRS/AFS) ENFORCEMENT/COMPLIANCE ACTIVITY (Integrated Compliance Information System) CRITERIA AND HAZARDOUS AIR POLLUTANT INVENTORY (Inventory of air pollution sources) Small Quantity Generators, between 100 kg and 1000 kg of hazardous waste/month (Resource Conservation and Recovery Act (tracking hazardous waste)) - notification TRI REPORTER (Tracking of toxic chemicals releasing facilities) Business SIC classification: COMPUTER PERIPHERAL EQUIPMENT; ELECTRIC AND OTHER SERVICES COMBINED
MODINE MANUFACTURING CO. (604 LIBERTY LANE in WEST KINGSTON, RI)
CRITERIA AND HAZARDOUS AIR POLLUTANT INVENTORY (Inventory of air pollution sources) National Pollutant Discharge Elimination System NON-MAJOR (Tracking pollutant discharge elimination systems) - permit Small Quantity Generators, between 100 kg and 1000 kg of hazardous waste/month (Resource Conservation and Recovery Act (tracking hazardous waste)) - notification TRI REPORTER (Tracking of toxic chemicals releasing facilities) Business SIC classification: HEATING EQUIPMENT, EXCEPT ELECTRIC AND WARM AIR FURNACES Business NAICS classification: HEATING EQUIPMENT (EXCEPT WARM AIR FURNACES) MANUFACTURING.; HEATING EQUIPMENT (EXCEPT WARM AIR FURNACES) MANUFACTURING. Organizations: MODINE MANUFACTURING COMPANY (CONTACT/OWNER)
Alternative names: T R T HEATING PRODUCTS INC, TRT HEATING PRODS.
KINGSTON HILL ACADEMY (STONY FORT ROAD in SOUTH KINGSTOWN, RI)
National Pollutant Discharge Elimination System NON-MAJOR (Tracking pollutant discharge elimination systems) - permit Organizations: THE GRODEN CENTER (CONTACT/OPERATOR)
Alternative names: THE GRODEN CENTER
A B C PRINTING (191 USQUEPAUGH RD RTE 138 in WEST KINGSTON, RI)
(Resource Conservation and Recovery Act (tracking hazardous waste)) Business NAICS classification: COMMERCIAL LITHOGRAPHIC PRINTING. Organizations: FRANCIS BURNS (CONTACT/OWNER)
ARNOLD LUMBER GRAND RENTAL (251 FAIRGROUNDS ROAD in WEST KINGSTON, RI)
(Resource Conservation and Recovery Act (tracking hazardous waste)) Organizations: WAKEFIELD GRAND RENTAL (CONTACT/OWNER)
DATTCO INC (45 FAIRGROUND RD in SOUTH KINGSTOWN, RI)
Small Quantity Generators, between 100 kg and 1000 kg of hazardous waste/month (Resource Conservation and Recovery Act (tracking hazardous waste)) Organizations: FIRST STUDENT INC (CONTACT/OWNER)
, LOUIS DEVIVO (CONTACT/OWNER)
Alternative names: FIRST STUDENT
JEDS WEST KINGSTON SERVICE INC (3471 KINGSTOWN RD in WEST KINGSTON, RI)
(Resource Conservation and Recovery Act (tracking hazardous waste)) Organizations: JON A LACHAPPELLE (CONTACT/OWNER)
KINGSTON PRESS INC (USEQUEPAUG RD RTE 138 in SOUTH KINGSTOWN, RI)
LEVITON MFG CO INC (FAIRGROUNDS RD in SOUTH KINGSTOWN, RI)
(Resource Conservation and Recovery Act (tracking hazardous waste)) Business NAICS classification: CURRENT-CARRYING WIRING DEVICE MANUFACTURING.
PINE GLEN (SMALL POX TRAIL in RICHMOND, RI)
National Pollutant Discharge Elimination System NON-MAJOR (Tracking pollutant discharge elimination systems) - permit Organizations: ARCHIBALD B. KENYON (CONTACT/OWNER)
CHARIHO ANIMAL HOSPITAL INC (331 KINGSTOWN RD in RICHMOND, RI)
Small Quantity Generators, between 100 kg and 1000 kg of hazardous waste/month (Resource Conservation and Recovery Act (tracking hazardous waste)) - notification Organizations: JOAN MATYIA (CONTACT/OWNER)
JIMS CUSTOM EXHAUST (2544 S COUNTY TRL in SOUTH KINGSTOWN, RI)
Small Quantity Generators, between 100 kg and 1000 kg of hazardous waste/month (Resource Conservation and Recovery Act (tracking hazardous waste)) - notification Organizations: JAMES DOAK (CONTACT/OWNER)
KINGSTON TURF FARMS (RTE 2 S COUNTY TRL BOX 397 in RICHMOND, RI)
Small Quantity Generators, between 100 kg and 1000 kg of hazardous waste/month (Resource Conservation and Recovery Act (tracking hazardous waste)) - notification Organizations: BRIAN L BOUCHARD (CONTACT/OWNER)
63.8%Fuel oil, kerosene, etc.
16.1%Bottled, tank, or LP gas
10.9%Wood
6.4%Utility gas
1.1%Other fuel
1.0%Coal or coke
0.8%Solar energy
Population in 1990: 3,943. Population change in the 1990s: +638 (+16.2%).
Place of birth for U.S.-born residents:
This state: 3,839
Northeast: 1,280
Midwest: 353
South: 124
West: 93
64% of the 02892 zip code residents lived in the same house 5 years ago. Out of people who lived in different houses, 61% lived in this county. Out of people who lived in different counties, 50% lived in Rhode Island.
95% of the 02892 zip code residents lived in the same house 1 year ago. Out of people who lived in different houses, 7% moved from this county. Out of people who lived in different houses, 78% moved from different county within same state. Out of people who lived in different houses, 10% moved from different state.
Private vs. public school enrollment:
Students in private schools in grades 1 to 8 (elementary and middle school): 83
Here:
13.2%
Rhode Island:
12.2%
Students in private schools in grades 9 to 12 (high school): 23
Here:
6.8%
Rhode Island:
11.6%
Students in private undergraduate colleges: 15
Here:
11.1%
Rhode Island:
41.1%
Occupation by median earnings in the past 12 months ($)
145,452Computer and mathematical occupations
132,102Architecture and engineering occupations
121,453Management occupations
107,943Business and financial operations occupations
95,382Sales and related occupations
78,040Education, training, and library occupations
Companies with federal contracts located in this zip code (WEST KINGSTON, RI):
REAL-TIME RESEARCH (450 FAIRGROUNDS RD; small business) : $475,000 in 4 contractsfrom 2000 to 2003
$200,000 with Navy for Defense Electronics and Communication Equipment -- Applied Research and Exploratory Development (R&D). Signed on 2002-06-24. Completion date: 2003-06-20.
$100,000, same as above.Signed on 2003-06-02. Completion date: 2003-05-15.
$100,000 with Navy for Engineering and Technical Services. Signed on 2001-04-27. Completion date: 2002-04-29.
$75,000, same as above.Signed on 2000-03-20. Completion date: 2001-03-19.
KCP ACQUISITION, LLC (141 FAIRGROUNDS RD; small business) : $61,013 in 5 contractsfrom 2002 to 2005
Contracts for Hosiery, Handwear, and Clothing Accessories, Men's, Underwear and Nightwear, Men's by Army Signed by year:2000: $0; 2001: $0; 2002: $14,891; 2003: $20,450; 2004: $20,032; 2005: $5,640; 2006: $0.
Biggest contracts:
$20,450 with Army for Hosiery, Handwear, and Clothing Accessories, Men's. Signed on 2003-04-01. Completion date: 2003-04-30.
$14,891, same as above.Signed on 2002-10-10. Completion date: 2002-11-08.
$10,016 with Army for Underwear and Nightwear, Men's. Signed on 2004-05-19. Completion date: 2004-06-30.
$10,016, same as above.Signed on 2004-03-11. Completion date: 2004-04-13.
WURZBACHER, J DOUGLAS (1141 LIBERTY LN; small business) : $59,847 in 2 contractsfrom 2003 to 2005
$51,647 with NASA for Video Recording and Reproducing Equipment. Signed on 2003-09-15. Completion date: 2003-10-15.
$8,200 with Army for Miscellaneous Communication Equipment. Signed on 2005-02-01. Completion date: 2005-02-28.
TEE & GREEN SOD INC (571 WAITES CORNER RD; small business) : $59,825 in 3 contractsin 2005
$52,500 with Army for Landscaping/Groundskeeping Services. Taking place in NY. Signed on 2005-07-05. Completion date: 2005-08-31.
$7,000, same as above.Signed on 2005-08-03. Completion date: 2005-08-31.
$325, same as above.Signed on 2005-08-12. Completion date: 2005-08-31.
Top industries in this zip code by the number of employees in 2005:
Wholesale Trade: Computer and Computer Peripheral Equipment and Software Merchant Wholesalers (500-999 employees: 1 establishment)
Management of Companies and Enterprises: Corporate, Subsidiary, and Regional Managing Offices (250-499: 1)
Administrative and Support and Waste Management and Remediation Services: Temporary Help Services (100-249: 1)
Construction: New Single-Family Housing Construction (except Operative Builders) (20-49: 1, 10-19: 1, 5-9: 2, 1-4: 5)
Health Care and Social Assistance: Nursing Care Facilities (50-99: 1)
Health Care and Social Assistance: Residential Mental Retardation Facilities (20-49: 1, 10-19: 1)
People in group quarters in 2010:
155 people in nursing facilities/skilled-nursing facilities
9 people in group homes intended for adults
7 people in group homes for juveniles (non-correctional)
People in group quarters in 2000:
123 people in nursing homes
16 people in homes for the mentally retarded
Fatal accident statistics in 2014:
Fatal accident count: 1
Vehicles involved in fatal accidents: 1
Fatal accidents caused by drunken drivers: 1
Fatalities: 1
Persons involved in fatal accidents: 1
Pedestrians involved in fatal accidents: 0
Fatal accident statistics in 2012:
Fatal accident count: 2
Vehicles involved in fatal accidents: 4
Fatal accidents caused by drunken drivers: 2
Fatalities: 2
Persons involved in fatal accidents: 5
Pedestrians involved in fatal accidents: 0
Home Mortgage Disclosure Act Aggregated Statistics For Year 2009 (Based on 6 partial tracts)
A) FHA, FSA/RHS & VA Home Purchase Loans
B) Conventional Home Purchase Loans
C) Refinancings
D) Home Improvement Loans
E) Loans on Dwellings For 5+ Families
F) Non-occupant Loans on < 5 Family Dwellings (A B C & D)
G) Loans On Manufactured Home Dwelling (A B C & D)
Number
Average Value
Number
Average Value
Number
Average Value
Number
Average Value
Number
Average Value
Number
Average Value
Number
Average Value
LOANS ORIGINATED
31
$293,115
66
$240,648
530
$218,525
24
$116,723
0
$0
28
$258,336
3
$41,867
APPLICATIONS APPROVED, NOT ACCEPTED
2
$282,650
4
$217,375
34
$245,574
2
$72,535
0
$0
5
$263,296
0
$0
APPLICATIONS DENIED
3
$195,443
11
$274,529
123
$272,077
4
$125,915
0
$0
9
$253,586
2
$65,625
APPLICATIONS WITHDRAWN
2
$304,845
4
$251,742
95
$250,442
2
$103,620
1
$3,039,600
4
$264,325
0
$0
FILES CLOSED FOR INCOMPLETENESS
3
$273,340
1
$151,350
23
$238,293
1
$168,300
0
$0
1
$26,330
1
$33,280
Aggregated Statistics For Year 2008 (Based on 6 partial tracts)
A) FHA, FSA/RHS & VA Home Purchase Loans
B) Conventional Home Purchase Loans
C) Refinancings
D) Home Improvement Loans
E) Loans on Dwellings For 5+ Families
F) Non-occupant Loans on < 5 Family Dwellings (A B C & D)
G) Loans On Manufactured Home Dwelling (A B C & D)
Number
Average Value
Number
Average Value
Number
Average Value
Number
Average Value
Number
Average Value
Number
Average Value
Number
Average Value
LOANS ORIGINATED
17
$246,874
89
$282,742
248
$225,429
46
$77,833
2
$473,445
27
$254,783
4
$44,430
APPLICATIONS APPROVED, NOT ACCEPTED
1
$363,680
9
$243,648
40
$228,833
4
$79,732
0
$0
4
$259,692
0
$0
APPLICATIONS DENIED
1
$215,400
13
$270,131
127
$251,079
20
$84,818
0
$0
6
$156,270
3
$55,683
APPLICATIONS WITHDRAWN
1
$132,470
14
$268,681
50
$271,116
5
$161,868
0
$0
2
$251,365
0
$0
FILES CLOSED FOR INCOMPLETENESS
0
$0
1
$554,520
14
$283,727
1
$230,380
0
$0
0
$0
0
$0
Aggregated Statistics For Year 2007 (Based on 6 partial tracts)
A) FHA, FSA/RHS & VA Home Purchase Loans
B) Conventional Home Purchase Loans
C) Refinancings
D) Home Improvement Loans
F) Non-occupant Loans on < 5 Family Dwellings (A B C & D)
G) Loans On Manufactured Home Dwelling (A B C & D)
Number
Average Value
Number
Average Value
Number
Average Value
Number
Average Value
Number
Average Value
Number
Average Value
LOANS ORIGINATED
4
$277,542
175
$261,391
291
$203,354
87
$66,958
32
$282,926
3
$51,707
APPLICATIONS APPROVED, NOT ACCEPTED
0
$0
20
$280,228
51
$216,951
7
$148,351
2
$187,340
0
$0
APPLICATIONS DENIED
1
$143,810
21
$213,668
140
$251,996
21
$108,210
10
$209,393
1
$45,840
APPLICATIONS WITHDRAWN
0
$0
15
$258,555
92
$226,963
8
$80,756
4
$178,580
0
$0
FILES CLOSED FOR INCOMPLETENESS
0
$0
3
$300,690
28
$291,332
3
$46,413
1
$264,940
1
$15,070
Aggregated Statistics For Year 2006 (Based on 6 partial tracts)
A) FHA, FSA/RHS & VA Home Purchase Loans
B) Conventional Home Purchase Loans
C) Refinancings
D) Home Improvement Loans
F) Non-occupant Loans on < 5 Family Dwellings (A B C & D)
G) Loans On Manufactured Home Dwelling (A B C & D)
Number
Average Value
Number
Average Value
Number
Average Value
Number
Average Value
Number
Average Value
Number
Average Value
LOANS ORIGINATED
3
$237,383
207
$221,237
385
$180,141
110
$70,389
30
$235,105
6
$54,637
APPLICATIONS APPROVED, NOT ACCEPTED
0
$0
18
$242,384
61
$194,144
13
$64,813
5
$257,832
0
$0
APPLICATIONS DENIED
0
$0
33
$220,258
145
$197,959
30
$104,946
7
$158,071
3
$41,823
APPLICATIONS WITHDRAWN
0
$0
20
$274,702
134
$213,322
5
$92,910
2
$427,855
0
$0
FILES CLOSED FOR INCOMPLETENESS
0
$0
3
$183,910
27
$243,541
1
$25,120
0
$0
0
$0
Aggregated Statistics For Year 2005 (Based on 6 partial tracts)
A) FHA, FSA/RHS & VA Home Purchase Loans
B) Conventional Home Purchase Loans
C) Refinancings
D) Home Improvement Loans
F) Non-occupant Loans on < 5 Family Dwellings (A B C & D)
G) Loans On Manufactured Home Dwelling (A B C & D)
Number
Average Value
Number
Average Value
Number
Average Value
Number
Average Value
Number
Average Value
Number
Average Value
LOANS ORIGINATED
2
$236,440
247
$239,295
548
$192,980
116
$95,651
48
$208,314
8
$52,196
APPLICATIONS APPROVED, NOT ACCEPTED
0
$0
26
$239,653
59
$217,652
10
$62,782
4
$179,230
1
$42,700
APPLICATIONS DENIED
2
$232,360
30
$201,169
156
$221,229
46
$73,613
10
$196,343
1
$202,840
APPLICATIONS WITHDRAWN
0
$0
33
$265,388
243
$208,948
18
$122,951
6
$224,977
0
$0
FILES CLOSED FOR INCOMPLETENESS
0
$0
9
$189,530
53
$243,165
6
$62,500
1
$155,510
0
$0
Aggregated Statistics For Year 2004 (Based on 6 partial tracts)
A) FHA, FSA/RHS & VA Home Purchase Loans
B) Conventional Home Purchase Loans
C) Refinancings
D) Home Improvement Loans
E) Loans on Dwellings For 5+ Families
F) Non-occupant Loans on < 5 Family Dwellings (A B C & D)
G) Loans On Manufactured Home Dwelling (A B C & D)
Number
Average Value
Number
Average Value
Number
Average Value
Number
Average Value
Number
Average Value
Number
Average Value
Number
Average Value
LOANS ORIGINATED
6
$228,848
254
$233,037
602
$174,610
101
$68,783
1
$29,978,720
33
$183,007
8
$45,991
APPLICATIONS APPROVED, NOT ACCEPTED
1
$108,020
31
$220,536
78
$164,322
18
$65,296
1
$524,480
8
$189,000
1
$108,020
APPLICATIONS DENIED
0
$0
32
$268,582
106
$181,281
38
$72,146
0
$0
5
$108,826
2
$38,705
APPLICATIONS WITHDRAWN
1
$161,400
21
$215,195
195
$195,432
12
$66,417
0
$0
4
$226,320
0
$0
FILES CLOSED FOR INCOMPLETENESS
0
$0
5
$232,880
59
$199,883
3
$35,057
0
$0
1
$64,060
0
$0
Aggregated Statistics For Year 2003 (Based on 6 partial tracts)
A) FHA, FSA/RHS & VA Home Purchase Loans
B) Conventional Home Purchase Loans
C) Refinancings
D) Home Improvement Loans
E) Loans on Dwellings For 5+ Families
F) Non-occupant Loans on < 5 Family Dwellings (A B C & D)
Number
Average Value
Number
Average Value
Number
Average Value
Number
Average Value
Number
Average Value
Number
Average Value
LOANS ORIGINATED
7
$182,897
196
$231,258
1,430
$157,549
97
$81,111
1
$1,788,000
58
$156,467
APPLICATIONS APPROVED, NOT ACCEPTED
0
$0
11
$225,245
181
$158,174
16
$69,655
0
$0
4
$105,455
APPLICATIONS DENIED
1
$238,010
21
$169,840
241
$167,014
33
$58,016
0
$0
9
$122,773
APPLICATIONS WITHDRAWN
1
$121,830
16
$250,911
279
$161,267
7
$21,649
1
$98,740
7
$152,831
FILES CLOSED FOR INCOMPLETENESS
0
$0
6
$189,122
26
$168,595
4
$61,948
0
$0
0
$0
Aggregated Statistics For Year 2002 (Based on 4 partial tracts)
A) FHA, FSA/RHS & VA Home Purchase Loans
B) Conventional Home Purchase Loans
C) Refinancings
D) Home Improvement Loans
F) Non-occupant Loans on < 5 Family Dwellings (A B C & D)
Number
Average Value
Number
Average Value
Number
Average Value
Number
Average Value
Number
Average Value
LOANS ORIGINATED
6
$172,072
103
$165,824
351
$136,108
34
$26,247
16
$136,016
APPLICATIONS APPROVED, NOT ACCEPTED
1
$86,040
9
$140,323
40
$108,129
10
$55,912
1
$221,060
APPLICATIONS DENIED
2
$117,435
6
$117,017
72
$113,238
15
$28,846
3
$89,177
APPLICATIONS WITHDRAWN
1
$106,760
8
$151,942
81
$120,106
5
$38,182
3
$105,713
FILES CLOSED FOR INCOMPLETENESS
0
$0
0
$0
18
$131,153
0
$0
1
$55,260
Aggregated Statistics For Year 2001 (Based on 4 partial tracts)
A) FHA, FSA/RHS & VA Home Purchase Loans
B) Conventional Home Purchase Loans
C) Refinancings
D) Home Improvement Loans
F) Non-occupant Loans on < 5 Family Dwellings (A B C & D)
Number
Average Value
Number
Average Value
Number
Average Value
Number
Average Value
Number
Average Value
LOANS ORIGINATED
17
$143,575
76
$153,015
286
$121,163
39
$30,984
7
$141,526
APPLICATIONS APPROVED, NOT ACCEPTED
1
$141,930
8
$121,675
30
$108,564
6
$40,402
1
$75,360
APPLICATIONS DENIED
1
$97,970
6
$120,785
84
$90,060
24
$31,775
1
$111,780
APPLICATIONS WITHDRAWN
0
$0
6
$112,310
56
$122,587
8
$32,850
2
$81,010
FILES CLOSED FOR INCOMPLETENESS
0
$0
1
$73,480
6
$101,422
0
$0
0
$0
Aggregated Statistics For Year 2000 (Based on 4 partial tracts)
A) FHA, FSA/RHS & VA Home Purchase Loans
B) Conventional Home Purchase Loans
C) Refinancings
D) Home Improvement Loans
F) Non-occupant Loans on < 5 Family Dwellings (A B C & D)
Number
Average Value
Number
Average Value
Number
Average Value
Number
Average Value
Number
Average Value
LOANS ORIGINATED
22
$137,360
84
$128,562
66
$84,709
43
$27,331
3
$88,757
APPLICATIONS APPROVED, NOT ACCEPTED
2
$124,660
9
$102,526
14
$119,948
5
$24,492
0
$0
APPLICATIONS DENIED
0
$0
8
$140,331
45
$72,719
18
$28,097
1
$87,920
APPLICATIONS WITHDRAWN
2
$153,785
10
$111,477
36
$96,172
3
$29,097
1
$131,880
FILES CLOSED FOR INCOMPLETENESS
0
$0
0
$0
3
$95,667
0
$0
0
$0
Aggregated Statistics For Year 1999 (Based on 3 partial tracts)
A) FHA, FSA/RHS & VA Home Purchase Loans
B) Conventional Home Purchase Loans
C) Refinancings
D) Home Improvement Loans
E) Loans on Dwellings For 5+ Families
F) Non-occupant Loans on < 5 Family Dwellings (A B C & D)
2007 - 2018 National Fire Incident Reporting System (NFIRS) incidents
Based on the data from the years 2007 - 2018 the average number of fires per year is 10. The highest number of fire incidents - 19 took place in 2009, and the least - 3 in 2012. The data has a growing trend.
When looking into fire subcategories, the most incidents belonged to: Structure Fires (57.4%), and Outside Fires (26.1%).
Fire incident types reported to NFIRS in Zip Code 02892


+$3,231
-$1,365
 Nearest zip codes: 02836, 02875, 02812, 02881, 02898, 02822.


 Based on the data from the years 2007 - 2018 the average number of fires per year is 10. The highest number of fire incidents - 19 took place in 2009, and the least - 3 in 2012. The data has a growing trend.
 When looking into fire subcategories, the most incidents belonged to: Structure Fires (57.4%), and Outside Fires (26.1%).