Estimated zip code population in 2022: 4,684 Zip code population in 2010: 4,246 Zip code population in 2000: 3,685
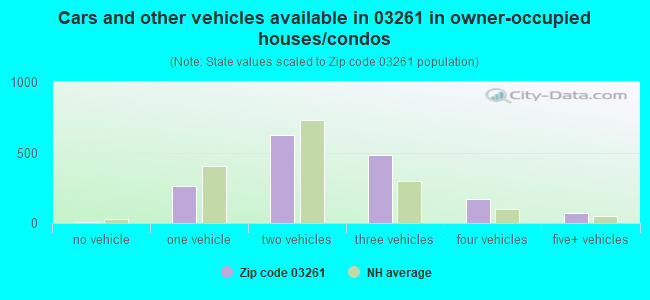
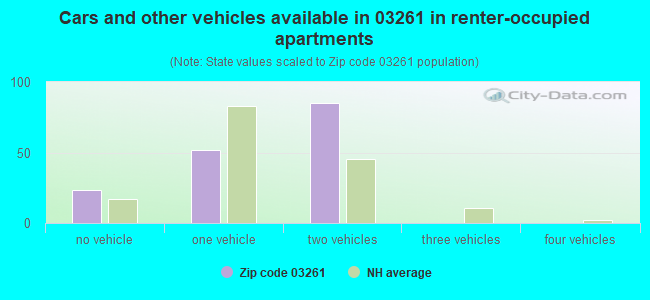
Houses and condos: 2,327 Renter-occupied apartments: 165
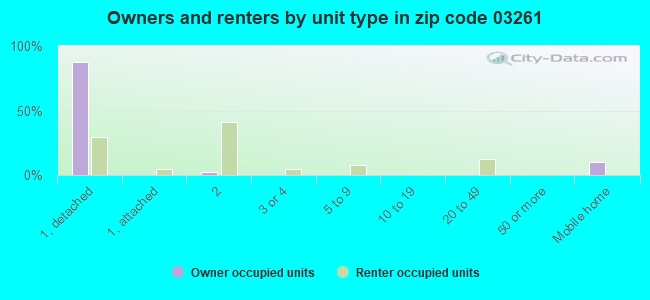
% of renters here:
9%
State:
28%
March 2022 cost of living index in zip code 03261: 110.2 (more than average, U.S. average is 100)
Land area: 28.0 sq. mi. Water area: 2.1 sq. mi.
Population density: 167 people per square mile
(very low).
OSM Map
Google Map
MSN Map
OSM Map
General Map
Google Map
MSN Map
OSM Map
Google Map
MSN Map
OSM Map
Google Map
MSN Map
Please wait while loading the map...
Real estate property taxes paid for housing units in 2022:
This zip code:
1.5% ($5,936)
New Hampshire:
1.6% ($6,209)
Median real estate property taxes paid for housing units with mortgages in 2022: $6,001 (1.5%) Median real estate property taxes paid for housing units with no mortgage in 2022: $5,613 (1.7%)
Business Search- 14 Million verified businesses
Males: 2,218
(47.4%)
Females: 2,466
(52.6%)
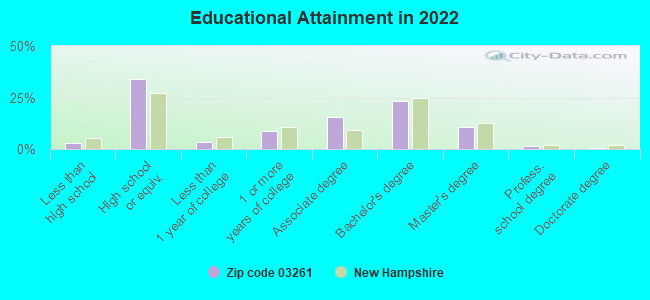
For population 25 years and over in 03261:
High school or higher: 96.7%
Bachelor's degree or higher: 35.7%
Graduate or professional degree: 12.6%
Unemployed: 0.9%
Mean travel time to work (commute): 36.7 minutes
For population 15 years and over in 03261:
Never married: 28.1%
Now married: 60.4%
Separated: 1.3%
Widowed: 3.3%
Divorced: 6.8%
Zip code 03261 compared to state average:
Unemployed percentage below state average.
Foreign-born population percentage significantly below state average.
Renting percentage significantly below state average.
Length of stay since moving in significantly above state average.
Averages for the 2020 tax year for zip code 03261, filed in 2021:
Average Adjusted Gross Income (AGI) in 2020: $72,999 (Individual Income Tax Returns)
Here:
$72,999
State:
$88,845
Salary/wage: $63,098 (reported on 85.0% of returns)
Here:
$63,098
State:
$71,693
(% of AGI for various income ranges: 1086.0% for AGIs below $25k, 3702.8% for AGIs $25k-50k, 6804.4% for AGIs $50k-75k, 9747.5% for AGIs $75k-100k, 17579.0% for AGIs $100k-200k, 61833.3% for AGIs over 200k)
Taxable interest for individuals: $1,010 (reported on 33.2% of returns)
This zip code:
$1,010
New Hampshire:
$1,640
(% of AGI for various income ranges: 13.1% for AGIs below $25k, 14.1% for AGIs $25k-50k, 31.1% for AGIs $50k-75k, 38.0% for AGIs $75k-100k, 55.2% for AGIs $100k-200k, 1256.7% for AGIs over 200k)
Ordinary dividends: $4,444 (reported on 20.2% of returns)
Here:
$4,444
State:
$8,258
(% of AGI for various income ranges: 17.4% for AGIs below $25k, 33.5% for AGIs $25k-50k, 82.2% for AGIs $50k-75k, 133.0% for AGIs $75k-100k, 233.5% for AGIs $100k-200k, 2610.0% for AGIs over 200k)
Net capital gain/loss in AGI: +$11,344 (reported on 16.6% of returns)
Here:
+$11,344
State:
+$28,952
(% of AGI for various income ranges: 6.2% for AGIs below $25k, 63.0% for AGIs $25k-50k, 94.8% for AGIs $50k-75k, 131.5% for AGIs $75k-100k, 558.7% for AGIs $100k-200k, 6946.7% for AGIs over 200k)
Profit/loss from business: +$19,868 (reported on 15.0% of returns)
Here:
+$19,868
State:
+$24,424
(% of AGI for various income ranges: 81.7% for AGIs below $25k, 202.0% for AGIs $25k-50k, 353.3% for AGIs $50k-75k, 414.0% for AGIs $75k-100k, 765.5% for AGIs $100k-200k, 6413.3% for AGIs over 200k)
Taxable individual retirement arrangement distribution: $24,060 (reported on 10.1% of returns)
03261:
$24,060
New Hampshire:
$21,952
(% of AGI for various income ranges: 55.0% for AGIs below $25k, 89.1% for AGIs $25k-50k, 165.2% for AGIs $50k-75k, 360.0% for AGIs $75k-100k, 895.5% for AGIs $100k-200k, 4773.3% for AGIs over 200k)
Total itemized deductions: $25,018 (reported on 6.9% of returns)
Here:
$25,018
State:
$32,702
(% of AGI for various income ranges: 102.4% for AGIs below $25k, 298.9% for AGIs $50k-75k, 300.0% for AGIs $75k-100k, 580.0% for AGIs $100k-200k, 2060.0% for AGIs over 200k)
Charity contributions: $4,982 (reported on 4.5% of returns)
Here:
$4,982
State:
$9,866
(% of AGI for various income ranges: 21.1% for AGIs $50k-75k, 158.4% for AGIs $100k-200k)
Taxes paid: $7,271 (reported on 6.9% of returns)
03261:
$7,271
State:
$8,247
(% of AGI for various income ranges: 34.0% for AGIs below $25k, 68.5% for AGIs $50k-75k, 92.5% for AGIs $75k-100k, 172.6% for AGIs $100k-200k, 626.7% for AGIs over 200k)
Earned income credit: $1,921 (reported on 7.7% of returns)
Here:
$1,921
State:
$1,831
(% of AGI for various income ranges: 47.9% for AGIs below $25k, 35.7% for AGIs $25k-50k)
Percentage of individuals using paid preparers for their 2020 taxes: 93.5%
Here:
94%
State:
92%
(% for various income ranges: 91.5% for AGIs below $25k, 94.7% for AGIs $25k-50k, 94.7% for AGIs $50k-75k, 93.3% for AGIs $75k-100k, 92.5% for AGIs $100k-200k, 100.0% for AGIs over 200k)
Averages for the 2012 tax year for zip code 03261, filed in 2013:
Average Adjusted Gross Income (AGI) in 2012: $52,212 (Individual Income Tax Returns)
Here:
$52,212
State:
$66,185
Salary/wage: $48,105 (reported on 87.2% of returns)
Here:
$48,105
State:
$55,674
(% of AGI for various income ranges: 79.2% for AGIs below $25k, 80.5% for AGIs $25k-50k, 80.3% for AGIs $50k-75k, 85.6% for AGIs $75k-100k, 80.8% for AGIs $100k-200k, 61.3% for AGIs over 200k)
Taxable interest for individuals: $827 (reported on 29.1% of returns)
This zip code:
$827
New Hampshire:
$1,674
(% of AGI for various income ranges: 1.0% for AGIs below $25k, 0.3% for AGIs $25k-50k, 0.5% for AGIs $50k-75k, 0.2% for AGIs $75k-100k, 0.7% for AGIs $100k-200k)
Ordinary dividends: $3,132 (reported on 19.4% of returns)
Here:
$3,132
State:
$6,774
(% of AGI for various income ranges: 2.4% for AGIs below $25k, 1.0% for AGIs $25k-50k, 1.0% for AGIs $50k-75k, 0.8% for AGIs $75k-100k, 1.5% for AGIs $100k-200k)
Net capital gain/loss in AGI: +$2,200 (reported on 13.7% of returns)
Here:
+$2,200
State:
+$13,759
(% of AGI for various income ranges: 0.1% for AGIs $25k-50k, 0.4% for AGIs $50k-75k, 0.4% for AGIs $75k-100k, 1.4% for AGIs $100k-200k)
Profit/loss from business: +$15,111 (reported on 16.3% of returns)
Here:
+$15,111
State:
+$19,298
(% of AGI for various income ranges: 9.9% for AGIs below $25k, 4.9% for AGIs $25k-50k, 5.9% for AGIs $50k-75k, 2.1% for AGIs $75k-100k, 5.2% for AGIs $100k-200k)
Taxable individual retirement arrangement distribution: $10,430 (reported on 8.8% of returns)
03261:
$10,430
New Hampshire:
$16,908
(% of AGI for various income ranges: 2.6% for AGIs below $25k, 2.0% for AGIs $25k-50k, 1.6% for AGIs $50k-75k, 1.4% for AGIs $75k-100k, 2.1% for AGIs $100k-200k)
Total itemized deductions: $18,411 (22% of AGI, reported on 35.2% of returns)
Here:
$18,411
State:
$22,617
Here:
22.0% of AGI
State:
18.1% of AGI
(% of AGI for various income ranges: 11.0% for AGIs below $25k, 10.2% for AGIs $25k-50k, 13.9% for AGIs $50k-75k, 14.1% for AGIs $75k-100k, 12.9% for AGIs $100k-200k, 7.7% for AGIs over 200k)
Charity contributions: $1,671 (reported on 24.2% of returns)
Here:
$1,671
State:
$2,860
(% of AGI for various income ranges: 0.5% for AGIs below $25k, 0.5% for AGIs $25k-50k, 0.6% for AGIs $50k-75k, 1.0% for AGIs $75k-100k, 1.0% for AGIs $100k-200k, 0.7% for AGIs over 200k)
Taxes paid: $6,822 (reported on 34.8% of returns)
03261:
$6,822
State:
$8,830
(% of AGI for various income ranges: 3.9% for AGIs below $25k, 3.5% for AGIs $25k-50k, 5.2% for AGIs $50k-75k, 4.7% for AGIs $75k-100k, 4.9% for AGIs $100k-200k, 3.8% for AGIs over 200k)
Earned income credit: $1,842 (reported on 13.7% of returns)
Here:
$1,842
State:
$1,863
(% of AGI for various income ranges: 4.5% for AGIs below $25k, 0.8% for AGIs $25k-50k)
Percentage of individuals using paid preparers for their 2012 taxes: 41.4%
Here:
41%
State:
45%
(% for various income ranges: 36.7% for AGIs below $25k, 39.6% for AGIs $25k-50k, 47.4% for AGIs $50k-75k, 44.4% for AGIs $75k-100k, 50.0% for AGIs $100k-200k)
Averages for the 2004 tax year for zip code 03261, filed in 2005:
Average Adjusted Gross Income (AGI) in 2004: $44,001 (Individual Income Tax Returns)
Here:
$44,001
State:
$54,348
Salary/wage: $40,337 (reported on 87.0% of returns)
Here:
$40,337
State:
$46,966
(% of AGI for various income ranges: 93.5% for AGIs below $10k, 77.5% for AGIs $10k-25k, 83.4% for AGIs $25k-50k, 85.4% for AGIs $50k-75k, 86.2% for AGIs $75k-100k, 64.7% for AGIs over 100k)
Taxable interest for individuals: $866 (reported on 41.1% of returns)
This zip code:
$866
New Hampshire:
$1,634
(% of AGI for various income ranges: 3.6% for AGIs below $10k, 2.0% for AGIs $10k-25k, 1.0% for AGIs $25k-50k, 0.6% for AGIs $50k-75k, 0.5% for AGIs $75k-100k, 0.5% for AGIs over 100k)
Taxable dividends: $1,822 (reported on 21.9% of returns)
Here:
$1,822
State:
$3,855
(% of AGI for various income ranges: 3.7% for AGIs below $10k, 1.5% for AGIs $10k-25k, 1.1% for AGIs $25k-50k, 0.7% for AGIs $50k-75k, 0.5% for AGIs $75k-100k, 0.9% for AGIs over 100k)
Net capital gain/loss: +$7,361 (reported on 15.7% of returns)
Here:
+$7,361
State:
+$13,739
(% of AGI for various income ranges: -1.4% for AGIs below $10k, 0.3% for AGIs $10k-25k, 0.2% for AGIs $25k-50k, 0.5% for AGIs $50k-75k, 1.7% for AGIs $75k-100k, 9.1% for AGIs over 100k)
Profit/loss from business: +$11,633 (reported on 17.6% of returns)
Here:
+$11,633
State:
+$16,641
(% of AGI for various income ranges: -7.8% for AGIs below $10k, 9.3% for AGIs $10k-25k, 5.3% for AGIs $25k-50k, 4.1% for AGIs $50k-75k, 2.6% for AGIs $75k-100k, 5.6% for AGIs over 100k)
IRA payment deduction: $3,000 (reported on 3.3% of returns)
03261:
$3,000
New Hampshire:
$3,013
(% of AGI for various income ranges: 0.5% for AGIs $10k-25k, 0.4% for AGIs $25k-50k, 0.2% for AGIs $50k-75k, 0.2% for AGIs $75k-100k)
Self-employed pension: $6,357 (reported on 0.7% of returns)
Here:
$6,357
New Hampshire:
$13,003
Total itemized deductions: $16,073 (23% of AGI, reported on 37.5% of returns)
Here:
$16,073
State:
$18,832
Here:
23.2% of AGI
State:
19.6% of AGI
(% of AGI for various income ranges: 15.3% for AGIs below $10k, 13.6% for AGIs $10k-25k, 12.1% for AGIs $25k-50k, 16.3% for AGIs $50k-75k, 15.6% for AGIs $75k-100k, 10.6% for AGIs over 100k)
Charity contributions deductions: $1,730 (2% of AGI, reported on 30.4% of returns)
Here:
$1,730
State:
$2,473
Here:
2.4% of AGI
State:
2.4% of AGI
(% of AGI for various income ranges: 0.4% for AGIs below $10k, 0.7% for AGIs $10k-25k, 0.8% for AGIs $25k-50k, 1.1% for AGIs $50k-75k, 1.4% for AGIs $75k-100k, 1.8% for AGIs over 100k)
Total tax: $5,652 (reported on 79.3% of returns)
03261:
$5,652
State:
$8,835
(% of AGI for various income ranges: 3.5% for AGIs below $10k, 5.1% for AGIs $10k-25k, 7.4% for AGIs $25k-50k, 8.4% for AGIs $50k-75k, 10.3% for AGIs $75k-100k, 16.9% for AGIs over 100k)
Earned income credit: $1,321 (reported on 10.3% of returns)
Here:
$1,321
State:
$1,447
Percentage of individuals using paid preparers for their 2004 taxes: 48.2%
Here:
48%
State:
51%
(% for various income ranges: 36.9% for AGIs below $10k, 49.9% for AGIs $10k-25k, 49.2% for AGIs $25k-50k, 54.5% for AGIs $50k-75k, 42.6% for AGIs $75k-100k, 61.2% for AGIs over 100k)
Likely homosexual households (counted as self-reported same-sex unmarried-partner households)
Lesbian couples: 1.3% of all households
Gay men: 0.0% of all households
Household received Food Stamps/SNAP in the past 12 months: 24 Household did not receive Food Stamps/SNAP in the past 12 months: 1,778
Women who had a birth in the past 12 months: 106 (78 now married, 23 unmarried) Women who did not have a birth in the past 12 months: 924 (426 now married, 499 unmarried)
Housing units in zip code 03261 with a mortgage: 1,186 (148 second mortgage, 157 both second mortgage and home equity loan) Houses without a mortgage: 62
Median monthly owner costs for units with a mortgage: $1,896 Median monthly owner costs for units without a mortgage: $892
Residents with income below the poverty level in 2022:
This zip code:
3.3%
Whole state:
7.2%
Residents with income below 50% of the poverty level in 2022:
This zip code:
1.5%
Whole state:
3.7%
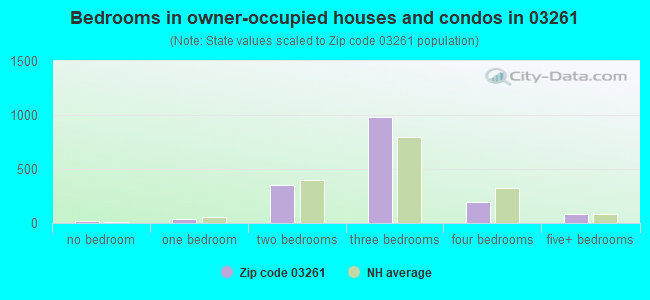
Median number of rooms in houses and condos:
Here:
6.6
State:
6.4
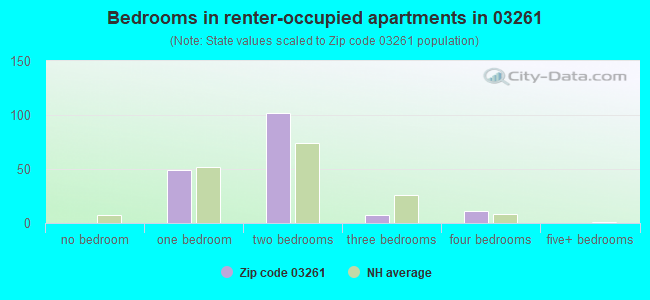
Median number of rooms in apartments:
Here:
4.8
State:
4.0
Notable locations in this zip code not listed on our city pages
Notable locations in zip code 03261: Camp Yavneh (A), Camp Wah-Tut-Ca (B), Northwood Fire Rescue Narrows Station (C), Northwood Fire Rescue Ridge Station (D), Chesley Memorial Library (E). Display/hide their locations on the map
Churches in zip code 03261 include: Free Will Baptist Church (A), Edgerly Memorial Chapel (B), Saint Josephs Church (C), Northwood Congregational Church (D). Display/hide their locations on the map
Lakes and reservoirs: Harvey Lake (A), Jenness Pond (B), Northwood Lake (C), Little Acorn Pond (D), Big Acorn Pond (E), Voydatch Pond (F), Burtt Wildlife Pond (G), Tudor Wildlife Pond (H). Display/hide their locations on the map
Streams, rivers, and creeks: The Gulf (A), Sherburne Brook (B), Tucker Brook (C), Narrows Brook (D), Kelsey Brook (E), Jenness Brook (F), Flat Meadow Brook (G). Display/hide their locations on the map
Size of family households: 693 2-persons, 387 3-persons, 153 4-persons, 130 5-persons, 19 6-persons, 19 7-or-more-persons
Size of nonfamily households: 271 1-person, 126 2-persons
612 married couples with children.
61 single-parent households (20 men, 41 women).
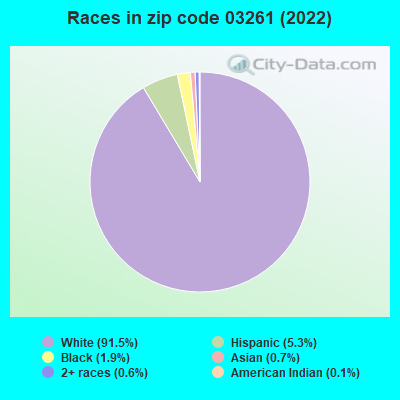
97.6% of residents of 03261 zip code speak English at home.
0.6% of residents speak Spanish at home (100% very well).
1.2% of residents speak other Indo-European language at home (100% very well).
0.5% of residents speak Asian or Pacific Island language at home (100% well).
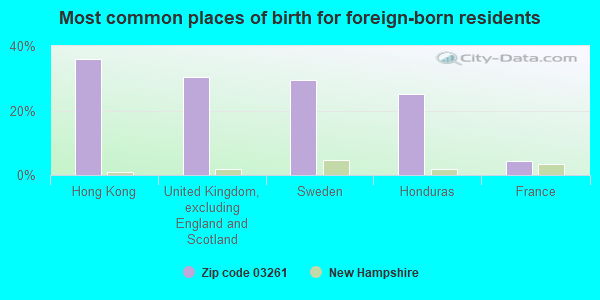
Foreign born population: 94 (2.0%) (60.3% of them are naturalized citizens)
This zip code:
2.0%
Whole state:
6.2%
36%Hong Kong
30%United Kingdom, excluding England and Scotland
29%Sweden
25%Honduras
4%France
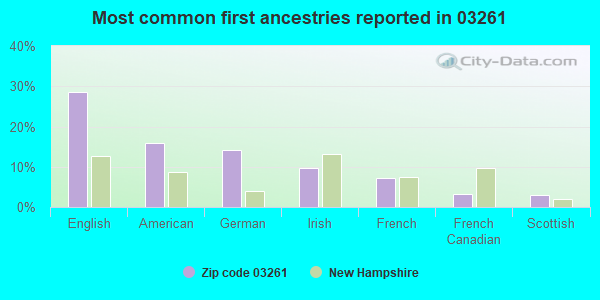
29%English
16%American
14%German
10%Irish
7%French
3%French Canadian
3%Scottish
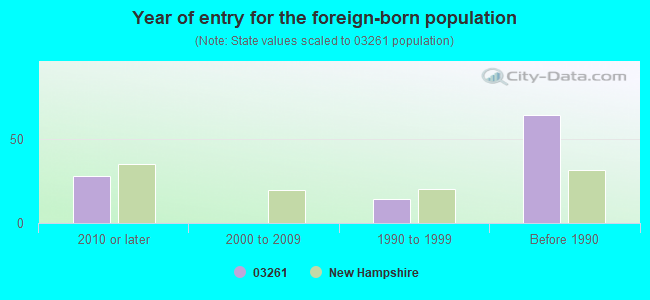
Year of entry for the foreign-born population
282010 or later
02000 to 2009
141990 to 1999
64Before 1990
Major facilities with environmental interests located in this zip code:
COE BROWN NORTHWOOD ACADEMY (907 FIRST NEW HAMPSHIRE TURNPIKE in NORTHWOOD, NH)
COMPLIANCE ACTIVITY (Tracking inspections of insecticide, fungicide, and rodenticide, and toxic substances) (National Center for Education Statistics) - STATE ID-74499899822025 (Resource Conservation and Recovery Act (tracking hazardous waste)) Business NAICS classification: ALL OTHER MISCELLANEOUS SCHOOLS AND INSTRUCTION. Organizations: COE BROWN ACADEMY SCHOOL DISTRICT (SCHOOL DISTRICT)
Alternative names: COE BROWN ACADEMY
SHELL SERVICE STATION (137 FIRST NH TPKE in NORTHWOOD, NH)
STATE MASTER (New Hampshire water, air, and waste tracking) - AIR MINOR, LEAKING STORAGE TANK, STATE CLEANUP SITE, HAZARDOUS WASTE PROGRAM, DRINKING WATER PROGRAM (Resource Conservation and Recovery Act (tracking hazardous waste)) Organizations: MOTIVA ENTERPRISES LLC (CONTACT/OPERATOR)
CAMP YAVNEH AT WATERFRONT (18 LUCAS POND RD in NORTHWOOD, NH)
STATE MASTER (New Hampshire water, air, and waste tracking) - STATE CLEANUP SITE, HAZARDOUS WASTE PROGRAM, DRINKING WATER PROGRAM (Resource Conservation and Recovery Act (tracking hazardous waste)) Alternative names: CAMP YAVNEH /WATERFRONT
VASSELIAN WILLIAM RESIDENCE (10 ESTHER LN in NORTHWOOD, NH)
STATE MASTER (New Hampshire water, air, and waste tracking) - STATE CLEANUP SITE, HAZARDOUS WASTE PROGRAM (Resource Conservation and Recovery Act (tracking hazardous waste))
NORTHWOOD ELEMENTARY SCHOOL (511 FIRST NH TPKE in NORTHWOOD, NH)
(Geographic Names Information System) (National Center for Education Statistics) - STATE ID-74441141122085 Organizations: NORTHWOOD SCHOOL DISTRICT (SCHOOL DISTRICT)
HARDING METALS INC (OFF ROUTE #4 in NORTHWOOD, NH)
AIR MINOR (AIRS/AFS) SUPERFUND (Superfund database) Conditionally Exempt Small Quantity Generators, less than 100 kg/month of hazardous waste (Resource Conservation and Recovery Act (tracking hazardous waste)) HAZARDOUS WASTE BIENNIAL REPORTER (Resource Conservation and Recovery Act (tracking hazardous waste)) Business SIC classification: SECONDARY SMELTING AND REFINING OF NONFERROUS METALS
HERTIAGE TRUE VALUE HARDWARE (RTE 4 in NORTHWOOD, NH)
(Resource Conservation and Recovery Act (tracking hazardous waste)) Alternative names: HERITAGE HARDWARE
NORTHWOOD TOWN DUMP (RTE 4 in NORTHWOOD, NH)
(Resource Conservation and Recovery Act (tracking hazardous waste)) Alternative names: NORTHWOOD TOWN OF
OLD IRON SALES & SERVICE (5 NOTTINGHAM RD in NORTHWOOD, NH)
HAZARDOUS WASTE BIENNIAL REPORTER (Resource Conservation and Recovery Act (tracking hazardous waste)) (Resource Conservation and Recovery Act (tracking hazardous waste)) Organizations: KENNETH C HOBART (CONTACT/OWNER)
WEATHERGUARD INC (289 FIRST NH TURNPIKE in NORTHWOOD, NH)
HAZARDOUS WASTE BIENNIAL REPORTER (Resource Conservation and Recovery Act (tracking hazardous waste)) (Resource Conservation and Recovery Act (tracking hazardous waste))
SUNRISE AUTO (195 FIRST NH TPKE in NORTHWOOD, NH)
Conditionally Exempt Small Quantity Generators, less than 100 kg/month of hazardous waste (Resource Conservation and Recovery Act (tracking hazardous waste)) - notification HAZARDOUS WASTE BIENNIAL REPORTER (Resource Conservation and Recovery Act (tracking hazardous waste)) Business NAICS classification: GENERAL AUTOMOTIVE REPAIR.; AUTOMOTIVE EXHAUST SYSTEM REPAIR. Organizations: WILLIAMSMITH (CONTACT/OPERATOR)
NICOL & SONS TRANSPORTATION IN (316 UPPER DEERFIELD RD in NORTHWOOD, NH)
HAZARDOUS WASTE BIENNIAL REPORTER (Resource Conservation and Recovery Act (tracking hazardous waste)) (Resource Conservation and Recovery Act (tracking hazardous waste))
DOLE TRUCK & AUTO REPAIR (91 ROCHESTER RD in NORTHWOOD, NH)
(Resource Conservation and Recovery Act (tracking hazardous waste)) Organizations: THOMAS F DOLE JR (CONTACT/OWNER)
Housing units lacking complete plumbing facilities: 0.7% Housing units lacking complete kitchen facilities: 0.3%
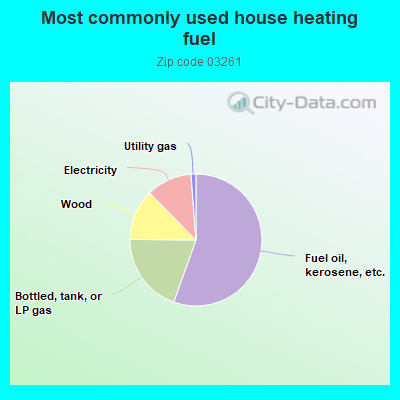
55.6%Fuel oil, kerosene, etc.
19.7%Bottled, tank, or LP gas
12.5%Wood
11.2%Electricity
1.2%Utility gas
Population in 1990: 3,013. Population change in the 1990s: +672 (+22.3%).
Place of birth for U.S.-born residents:
This state: 2,060
Northeast: 1,941
Midwest: 170
South: 180
West: 219
59% of the 03261 zip code residents lived in the same house 5 years ago. Out of people who lived in different houses, 32% lived in this county. Out of people who lived in different counties, 50% lived in New Hampshire.
96% of the 03261 zip code residents lived in the same house 1 year ago. Out of people who lived in different houses, 30% moved from this county. Out of people who lived in different houses, 61% moved from different county within same state. Out of people who lived in different houses, 23% moved from different state.
Private vs. public school enrollment:
Students in private schools in grades 1 to 8 (elementary and middle school): 17
Here:
7.9%
New Hampshire:
11.4%
Students in private schools in grades 9 to 12 (high school): 14
Here:
6.8%
New Hampshire:
14.0%
Students in private undergraduate colleges: 7
Here:
4.0%
New Hampshire:
38.0%
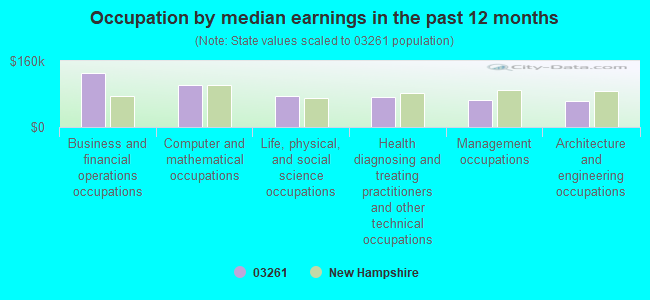
Occupation by median earnings in the past 12 months ($)
131,022Business and financial operations occupations
102,614Computer and mathematical occupations
76,350Life, physical, and social science occupations
72,653Health diagnosing and treating practitioners and other technical occupations
65,169Management occupations
62,373Architecture and engineering occupations
Top industries in this zip code by the number of employees in 2005:
Educational Services: Elementary and Secondary Schools (100-249 employees: 1 establishment)
Accommodation and Food Services: Full-Service Restaurants (50-99: 1, 10-19: 2)
Wholesale Trade: Metal Service Centers and Other Metal Merchant Wholesalers (20-49: 1, 1-4: 1)
Wholesale Trade: Toy and Hobby Goods and Supplies Merchant Wholesalers (20-49: 1)
Health Care and Social Assistance: Offices of Dentists (10-19: 1, 5-9: 1)
Construction: Site Preparation Contractors (10-19: 1, 1-4: 3)
Health Care and Social Assistance: Child Day Care Services (10-19: 1, 1-4: 2)
People in group quarters in 2000:
3 people in other group homes
Fatal accident statistics in 2014:
Fatal accident count: 1
Vehicles involved in fatal accidents: 2
Fatal accidents caused by drunken drivers: 0
Fatalities: 1
Persons involved in fatal accidents: 4
Pedestrians involved in fatal accidents: 0
Fatal accident statistics in 2013:
Fatal accident count: 1
Vehicles involved in fatal accidents: 2
Fatal accidents caused by drunken drivers: 0
Fatalities: 1
Persons involved in fatal accidents: 2
Pedestrians involved in fatal accidents: 0
Home Mortgage Disclosure Act Aggregated Statistics For Year 2009 (Based on 2 full tracts)
A) FHA, FSA/RHS & VA Home Purchase Loans
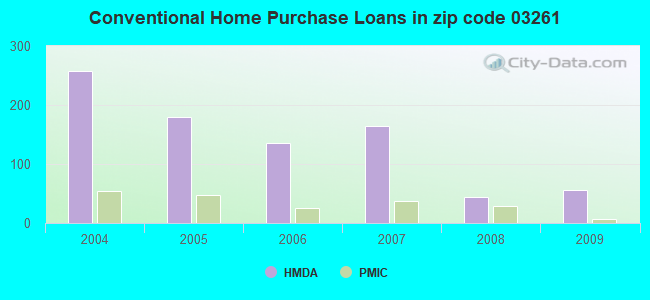
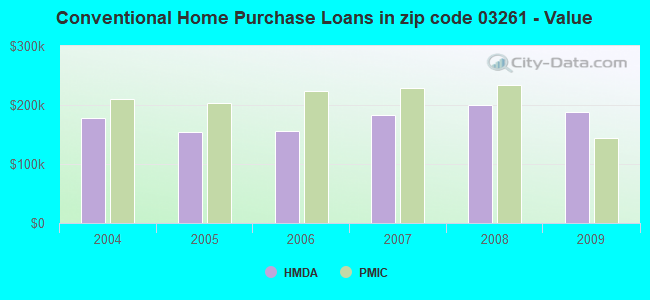
B) Conventional Home Purchase Loans
C) Refinancings
D) Home Improvement Loans
F) Non-occupant Loans on < 5 Family Dwellings (A B C & D)
G) Loans On Manufactured Home Dwelling (A B C & D)
Number
Average Value
Number
Average Value
Number
Average Value
Number
Average Value
Number
Average Value
Number
Average Value
LOANS ORIGINATED
40
$208,441
56
$187,586
261
$192,732
24
$62,196
32
$214,402
16
$97,535
APPLICATIONS APPROVED, NOT ACCEPTED
0
$0
2
$225,505
22
$267,864
0
$0
4
$483,435
0
$0
APPLICATIONS DENIED
12
$149,670
10
$125,523
152
$201,214
14
$43,476
18
$153,883
8
$33,676
APPLICATIONS WITHDRAWN
12
$163,806
8
$240,470
60
$188,784
4
$122,730
4
$402,112
0
$0
FILES CLOSED FOR INCOMPLETENESS
2
$159,650
2
$64,855
26
$184,593
2
$136,700
4
$172,120
0
$0
Aggregated Statistics For Year 2008 (Based on 2 full tracts)
A) FHA, FSA/RHS & VA Home Purchase Loans
B) Conventional Home Purchase Loans
C) Refinancings
D) Home Improvement Loans
F) Non-occupant Loans on < 5 Family Dwellings (A B C & D)
G) Loans On Manufactured Home Dwelling (A B C & D)
Number
Average Value
Number
Average Value
Number
Average Value
Number
Average Value
Number
Average Value
Number
Average Value
LOANS ORIGINATED
8
$218,019
44
$200,603
208
$192,307
42
$72,364
32
$222,198
24
$72,922
APPLICATIONS APPROVED, NOT ACCEPTED
2
$262,420
6
$194,238
30
$143,284
10
$57,274
4
$128,715
4
$93,295
APPLICATIONS DENIED
2
$84,815
26
$156,732
142
$180,096
42
$59,203
18
$183,595
20
$69,546
APPLICATIONS WITHDRAWN
4
$161,145
18
$202,221
62
$229,269
2
$748,350
6
$170,623
4
$110,755
FILES CLOSED FOR INCOMPLETENESS
0
$0
0
$0
12
$346,902
2
$175,615
0
$0
2
$199,560
Aggregated Statistics For Year 2007 (Based on 2 full tracts)
A) FHA, FSA/RHS & VA Home Purchase Loans
B) Conventional Home Purchase Loans
C) Refinancings
D) Home Improvement Loans
E) Loans on Dwellings For 5+ Families
F) Non-occupant Loans on < 5 Family Dwellings (A B C & D)
G) Loans On Manufactured Home Dwelling (A B C & D)
Number
Average Value
Number
Average Value
Number
Average Value
Number
Average Value
Number
Average Value
Number
Average Value
Number
Average Value
LOANS ORIGINATED
8
$283,126
164
$183,766
214
$169,094
80
$63,460
2
$429,055
36
$164,138
22
$91,888
APPLICATIONS APPROVED, NOT ACCEPTED
0
$0
26
$230,645
78
$151,461
12
$50,887
0
$0
14
$220,229
4
$82,818
APPLICATIONS DENIED
2
$317,300
32
$171,559
174
$201,613
50
$133,027
2
$498,900
14
$232,915
16
$69,971
APPLICATIONS WITHDRAWN
2
$211,535
16
$109,384
106
$192,726
14
$124,297
0
$0
8
$182,598
6
$70,843
FILES CLOSED FOR INCOMPLETENESS
0
$0
2
$44,900
32
$249,013
0
$0
0
$0
2
$124,725
2
$155,655
Aggregated Statistics For Year 2006 (Based on 2 full tracts)
A) FHA, FSA/RHS & VA Home Purchase Loans
B) Conventional Home Purchase Loans
C) Refinancings
D) Home Improvement Loans
F) Non-occupant Loans on < 5 Family Dwellings (A B C & D)
G) Loans On Manufactured Home Dwelling (A B C & D)
Number
Average Value
Number
Average Value
Number
Average Value
Number
Average Value
Number
Average Value
Number
Average Value
LOANS ORIGINATED
2
$201,555
136
$156,596
333
$152,085
78
$61,198
30
$201,290
22
$91,707
APPLICATIONS APPROVED, NOT ACCEPTED
2
$297,345
16
$178,108
48
$128,758
8
$57,124
6
$63,860
6
$82,485
APPLICATIONS DENIED
0
$0
56
$141,759
180
$165,147
54
$68,405
10
$156,056
30
$73,105
APPLICATIONS WITHDRAWN
0
$0
16
$177,608
132
$186,800
10
$78,826
8
$206,295
4
$84,812
FILES CLOSED FOR INCOMPLETENESS
0
$0
6
$240,137
54
$191,060
0
$0
0
$0
0
$0
Aggregated Statistics For Year 2005 (Based on 2 full tracts)
A) FHA, FSA/RHS & VA Home Purchase Loans
B) Conventional Home Purchase Loans
C) Refinancings
D) Home Improvement Loans
F) Non-occupant Loans on < 5 Family Dwellings (A B C & D)
G) Loans On Manufactured Home Dwelling (A B C & D)
Number
Average Value
Number
Average Value
Number
Average Value
Number
Average Value
Number
Average Value
Number
Average Value
LOANS ORIGINATED
6
$209,870
180
$154,216
379
$169,705
90
$58,405
40
$122,979
34
$93,324
APPLICATIONS APPROVED, NOT ACCEPTED
0
$0
18
$116,410
50
$166,792
6
$156,322
4
$256,932
6
$77,495
APPLICATIONS DENIED
2
$263,420
56
$119,700
251
$165,778
54
$44,162
20
$153,960
18
$93,793
APPLICATIONS WITHDRAWN
2
$254,440
46
$134,443
174
$138,866
20
$159,548
18
$93,461
10
$67,252
FILES CLOSED FOR INCOMPLETENESS
0
$0
6
$76,498
66
$170,049
16
$62,362
2
$159,650
2
$39,910
Aggregated Statistics For Year 2004 (Based on 2 full tracts)
A) FHA, FSA/RHS & VA Home Purchase Loans
B) Conventional Home Purchase Loans
C) Refinancings
D) Home Improvement Loans
F) Non-occupant Loans on < 5 Family Dwellings (A B C & D)
G) Loans On Manufactured Home Dwelling (A B C & D)
Detailed PMIC statistics for the following Tracts:0570.00
2002 - 2018 National Fire Incident Reporting System (NFIRS) incidents
According to the data from the years 2002 - 2018 the average number of fire incidents per year is 30. The highest number of reported fires - 51 took place in 2014, and the least - 8 in 2004. The data has a declining trend.
When looking into fire subcategories, the most incidents belonged to: Structure Fires (59.0%), and Outside Fires (24.5%).
Fire incident types reported to NFIRS in Zip Code 03261


 Nearest zip codes: 03037, 03884, 03291, 03263, 03290, 03234.
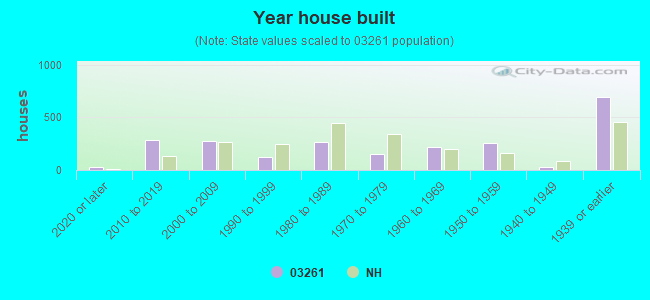


 According to the data from the years 2002 - 2018 the average number of fire incidents per year is 30. The highest number of reported fires - 51 took place in 2014, and the least - 8 in 2004. The data has a declining trend.
 When looking into fire subcategories, the most incidents belonged to: Structure Fires (59.0%), and Outside Fires (24.5%).