Estimated zip code population in 2022: 2,178 Zip code population in 2010: 2,400 Zip code population in 2000: 3,575
Houses and condos: 1,364 Renter-occupied apartments: 338
% of renters here:
41%
State:
28%
March 2022 cost of living index in zip code 03785: 98.5 (near average, U.S. average is 100)
Land area: 59.7 sq. mi. Water area: 0.8 sq. mi.
Population density: 36 people per square mile
(very low).
OSM Map
Google Map
MSN Map
OSM Map
General Map
Google Map
MSN Map
OSM Map
Google Map
MSN Map
OSM Map
Google Map
MSN Map
Please wait while loading the map...
Real estate property taxes paid for housing units in 2022:
This zip code:
1.4% ($2,705)
New Hampshire:
1.6% ($6,209)
Median real estate property taxes paid for housing units with mortgages in 2022: $2,605 (1.4%) Median real estate property taxes paid for housing units with no mortgage in 2022: $4,025 (1.3%)
Business Search- 14 Million verified businesses
Males: 994
(45.6%)
Females: 1,184
(54.4%)
For population 25 years and over in 03785:
High school or higher: 86.8%
Bachelor's degree or higher: 16.0%
Graduate or professional degree: 7.4%
Unemployed: 1.8%
Mean travel time to work (commute): 40.9 minutes
For population 15 years and over in 03785:
Never married: 29.6%
Now married: 37.7%
Separated: 0.3%
Widowed: 5.6%
Divorced: 26.9%
Zip code 03785 compared to state average:
Median household income below state average.
Median house value below state average.
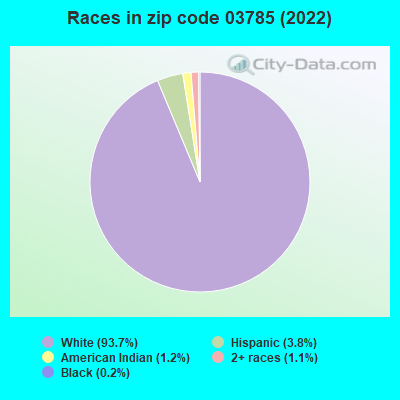
Black race population percentage significantly below state average.
Foreign-born population percentage significantly below state average.
Length of stay since moving in below state average.
Percentage of population with a bachelor's degree or higher significantly below state average.
Averages for the 2020 tax year for zip code 03785, filed in 2021:
Average Adjusted Gross Income (AGI) in 2020: $50,061 (Individual Income Tax Returns)
Here:
$50,061
State:
$88,845
Salary/wage: $43,481 (reported on 83.0% of returns)
Here:
$43,481
State:
$71,693
(% of AGI for various income ranges: 1263.9% for AGIs below $25k, 3845.0% for AGIs $25k-50k, 6210.9% for AGIs $50k-75k, 10264.0% for AGIs $75k-100k, 21043.3% for AGIs $100k-200k)
Taxable interest for individuals: $703 (reported on 30.2% of returns)
This zip code:
$703
New Hampshire:
$1,640
(% of AGI for various income ranges: 5.2% for AGIs below $25k, 16.1% for AGIs $25k-50k, 46.4% for AGIs $50k-75k, 52.0% for AGIs $75k-100k, 151.7% for AGIs $100k-200k)
Ordinary dividends: $3,031 (reported on 12.3% of returns)
Here:
$3,031
State:
$8,258
(% of AGI for various income ranges: 9.6% for AGIs below $25k, 28.9% for AGIs $25k-50k, 31.8% for AGIs $50k-75k, 426.7% for AGIs $100k-200k)
Net capital gain/loss in AGI: +$5,218 (reported on 10.4% of returns)
Here:
+$5,218
State:
+$28,952
(% of AGI for various income ranges: 1.7% for AGIs below $25k, 26.4% for AGIs $25k-50k, 114.5% for AGIs $50k-75k, 616.7% for AGIs $100k-200k)
Profit/loss from business: +$12,423 (reported on 12.3% of returns)
Here:
+$12,423
State:
+$24,424
(% of AGI for various income ranges: 142.2% for AGIs below $25k, 163.9% for AGIs $25k-50k, 1658.0% for AGIs $75k-100k)
Taxable individual retirement arrangement distribution: $15,489 (reported on 8.5% of returns)
03785:
$15,489
New Hampshire:
$21,952
(% of AGI for various income ranges: 79.6% for AGIs below $25k, 174.3% for AGIs $25k-50k, 1446.0% for AGIs $75k-100k)
Earned income credit: $2,117 (reported on 17.0% of returns)
Here:
$2,117
State:
$1,831
(% of AGI for various income ranges: 97.8% for AGIs below $25k, 55.7% for AGIs $25k-50k)
Percentage of individuals using paid preparers for their 2020 taxes: 93.4%
Here:
93%
State:
92%
(% for various income ranges: 94.1% for AGIs below $25k, 91.9% for AGIs $25k-50k, 93.3% for AGIs $50k-75k, 100.0% for AGIs $75k-100k, 110.0% for AGIs $100k-200k, 0.0% for AGIs over 200k)
Averages for the 2012 tax year for zip code 03785, filed in 2013:
Average Adjusted Gross Income (AGI) in 2012: $37,783 (Individual Income Tax Returns)
Here:
$37,783
State:
$66,185
Salary/wage: $33,970 (reported on 84.0% of returns)
Here:
$33,970
State:
$55,674
(% of AGI for various income ranges: 78.4% for AGIs below $25k, 82.0% for AGIs $25k-50k, 76.7% for AGIs $50k-75k, 72.8% for AGIs $75k-100k, 66.1% for AGIs $100k-200k)
Taxable interest for individuals: $693 (reported on 26.4% of returns)
This zip code:
$693
New Hampshire:
$1,674
(% of AGI for various income ranges: 0.6% for AGIs below $25k, 0.3% for AGIs $25k-50k, 0.4% for AGIs $50k-75k, 1.0% for AGIs $75k-100k, 0.4% for AGIs $100k-200k)
Ordinary dividends: $2,294 (reported on 15.1% of returns)
Here:
$2,294
State:
$6,774
(% of AGI for various income ranges: 2.1% for AGIs below $25k, 0.4% for AGIs $25k-50k, 0.8% for AGIs $50k-75k, 1.3% for AGIs $100k-200k)
Net capital gain/loss in AGI: +$2,738 (reported on 7.5% of returns)
Here:
+$2,738
State:
+$13,759
Profit/loss from business: +$6,607 (reported on 13.2% of returns)
Here:
+$6,607
State:
+$19,298
(% of AGI for various income ranges: 3.3% for AGIs below $25k, 3.1% for AGIs $25k-50k, 4.2% for AGIs $50k-75k)
Taxable individual retirement arrangement distribution: $11,570 (reported on 9.4% of returns)
03785:
$11,570
New Hampshire:
$16,908
(% of AGI for various income ranges: 3.7% for AGIs below $25k, 3.2% for AGIs $25k-50k, 12.3% for AGIs $75k-100k)
Total itemized deductions: $17,162 (25% of AGI, reported on 15.1% of returns)
Here:
$17,162
State:
$22,617
Here:
25.0% of AGI
State:
18.1% of AGI
(% of AGI for various income ranges: 8.1% for AGIs below $25k, 4.4% for AGIs $25k-50k, 7.0% for AGIs $50k-75k, 6.7% for AGIs $75k-100k, 8.9% for AGIs $100k-200k)
Charity contributions: $3,370 (reported on 9.4% of returns)
Here:
$3,370
State:
$2,860
(% of AGI for various income ranges: 0.8% for AGIs below $25k, 1.4% for AGIs $50k-75k, 1.7% for AGIs $100k-200k)
Taxes paid: $5,180 (reported on 14.2% of returns)
03785:
$5,180
State:
$8,830
(% of AGI for various income ranges: 1.2% for AGIs below $25k, 1.3% for AGIs $25k-50k, 2.3% for AGIs $50k-75k, 2.6% for AGIs $75k-100k, 2.4% for AGIs $100k-200k)
Earned income credit: $2,135 (reported on 21.7% of returns)
Here:
$2,135
State:
$1,863
(% of AGI for various income ranges: 6.4% for AGIs below $25k, 1.1% for AGIs $25k-50k)
Percentage of individuals using paid preparers for their 2012 taxes: 52.8%
Here:
53%
State:
45%
(% for various income ranges: 46.8% for AGIs below $25k, 51.6% for AGIs $25k-50k, 66.7% for AGIs $50k-75k, 66.7% for AGIs $75k-100k, 57.1% for AGIs $100k-200k)
Averages for the 2004 tax year for zip code 03785, filed in 2005:
Average Adjusted Gross Income (AGI) in 2004: $32,348 (Individual Income Tax Returns)
Here:
$32,348
State:
$54,348
Salary/wage: $28,779 (reported on 86.8% of returns)
Here:
$28,779
State:
$46,966
(% of AGI for various income ranges: 106.7% for AGIs below $10k, 84.1% for AGIs $10k-25k, 84.0% for AGIs $25k-50k, 76.3% for AGIs $50k-75k, 75.5% for AGIs $75k-100k, 54.0% for AGIs over 100k)
Taxable interest for individuals: $1,156 (reported on 36.7% of returns)
This zip code:
$1,156
New Hampshire:
$1,634
(% of AGI for various income ranges: 4.1% for AGIs below $10k, 1.4% for AGIs $10k-25k, 0.6% for AGIs $25k-50k, 1.7% for AGIs $50k-75k, 0.4% for AGIs $75k-100k, 2.0% for AGIs over 100k)
Taxable dividends: $1,795 (reported on 16.7% of returns)
Here:
$1,795
State:
$3,855
(% of AGI for various income ranges: 2.6% for AGIs below $10k, 0.9% for AGIs $10k-25k, 0.5% for AGIs $25k-50k, 1.1% for AGIs $50k-75k, 0.3% for AGIs $75k-100k, 1.6% for AGIs over 100k)
Net capital gain/loss: +$3,966 (reported on 11.9% of returns)
Here:
+$3,966
State:
+$13,739
(% of AGI for various income ranges: -2.1% for AGIs below $10k, 0.4% for AGIs $10k-25k, 0.7% for AGIs $25k-50k, 3.3% for AGIs $50k-75k, 2.9% for AGIs over 100k)
Profit/loss from business: +$6,841 (reported on 14.6% of returns)
Here:
+$6,841
State:
+$16,641
(% of AGI for various income ranges: 7.6% for AGIs below $10k, 3.8% for AGIs $10k-25k, 3.7% for AGIs $25k-50k, 1.1% for AGIs $50k-75k, 8.2% for AGIs $75k-100k)
IRA payment deduction: $2,824 (reported on 3.4% of returns)
03785:
$2,824
New Hampshire:
$3,013
Total itemized deductions: $15,347 (24% of AGI, reported on 12.2% of returns)
Here:
$15,347
State:
$18,832
Here:
23.9% of AGI
State:
19.6% of AGI
(% of AGI for various income ranges: 2.8% for AGIs $10k-25k, 4.9% for AGIs $25k-50k, 8.1% for AGIs $50k-75k, 5.4% for AGIs $75k-100k, 8.4% for AGIs over 100k)
Charity contributions deductions: $2,138 (3% of AGI, reported on 8.0% of returns)
Here:
$2,138
State:
$2,473
Here:
2.9% of AGI
State:
2.4% of AGI
Total tax: $4,042 (reported on 72.4% of returns)
03785:
$4,042
State:
$8,835
(% of AGI for various income ranges: 1.8% for AGIs below $10k, 4.8% for AGIs $10k-25k, 7.4% for AGIs $25k-50k, 9.0% for AGIs $50k-75k, 11.6% for AGIs $75k-100k, 16.8% for AGIs over 100k)
Earned income credit: $1,567 (reported on 17.9% of returns)
Here:
$1,567
State:
$1,447
Percentage of individuals using paid preparers for their 2004 taxes: 57.6%
Here:
58%
State:
51%
(% for various income ranges: 47.4% for AGIs below $10k, 59.0% for AGIs $10k-25k, 58.3% for AGIs $25k-50k, 63.8% for AGIs $50k-75k, 67.6% for AGIs $75k-100k, 67.6% for AGIs over 100k)
Household received Food Stamps/SNAP in the past 12 months: 75 Household did not receive Food Stamps/SNAP in the past 12 months: 756
Women who had a birth in the past 12 months: 6 (0 now married, 7 unmarried) Women who did not have a birth in the past 12 months: 462 (204 now married, 258 unmarried)
Housing units in zip code 03785 with a mortgage: 385 (2 second mortgage, 2 both second mortgage and home equity loan) Median monthly owner costs for units with a mortgage: $1,541 Median monthly owner costs for units without a mortgage: $772
Residents with income below the poverty level in 2022:
This zip code:
9.0%
Whole state:
7.2%
Residents with income below 50% of the poverty level in 2022:
This zip code:
7.3%
Whole state:
3.7%
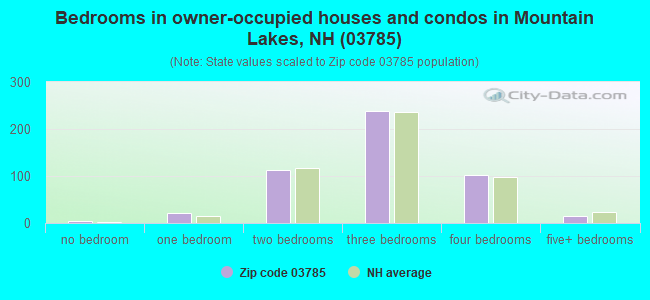
Median number of rooms in houses and condos:
Here:
7.5
State:
6.4
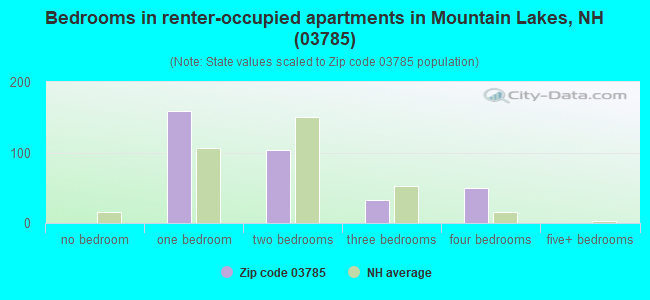
Median number of rooms in apartments:
Here:
4.4
State:
4.0
Notable locations in this zip code not listed on our city pages
Notable locations in zip code 03785: Long Pond Picnic Ground (A), Wildwood Forest Camp (B), Wildwood Campground and Picnic Area (C), McKenney Cabin (D), Long Pond Picnic Area (E), Woodsville Emergency Services (F), Woodsville Opera Building (G), Woodsville Free Public Library (H), Woodsville Fire and Rescue (I). Display/hide their locations on the map
Cemeteries: Swiftwater District Cemetery (1), Hamm Cemetery (2), Carbee Cemetery (3), Saint Josephs Cemetery (4), Benton Cemetery (5), Pine Grove Cemetery (6), East Cemetery (7). Display/hide their locations on the map
Lakes and reservoirs: Mud Pond (A), Lower Mountain Lake (B), Long Pond (C), Oliverian Pond (D), Connecticut River Reservoir (E), Ammonoosuc River Reservoir (F). Display/hide their locations on the map
Streams, rivers, and creeks: Whitcher Brook (A), Howe Hill (B), Gorge Brook (C), Dearth Brook (D), Davis Brook (E), Clay Brook (F), Bowen Brook (G), Blueberry Mountain Brook (H), Black Brook (I). Display/hide their locations on the map
In group quarters: 136 (-1 institutionalized population)
Size of family households: 215 2-persons, 120 3-persons, 118 4-persons, 2 5-persons, 6 6-persons
Size of nonfamily households: 269 1-person, 103 2-persons
280 married couples with children.
68 single-parent households (38 men, 30 women).
97.6% of residents of 03785 zip code speak English at home.
1.2% of residents speak Spanish at home (100% very well).
1.2% of residents speak other Indo-European language at home (79% very well, 8% not well, 12% not at all).
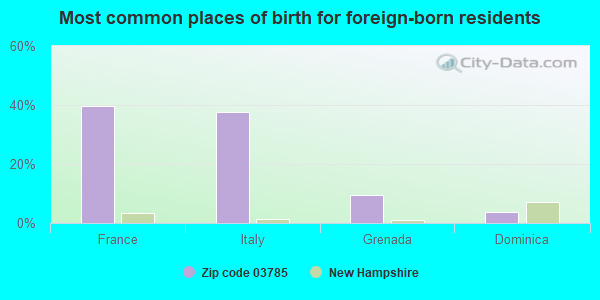
Foreign born population: 54 (2.5%) (100.0% of them are naturalized citizens)
This zip code:
2.5%
Whole state:
6.2%
40%France
38%Italy
9%Grenada
4%Dominica
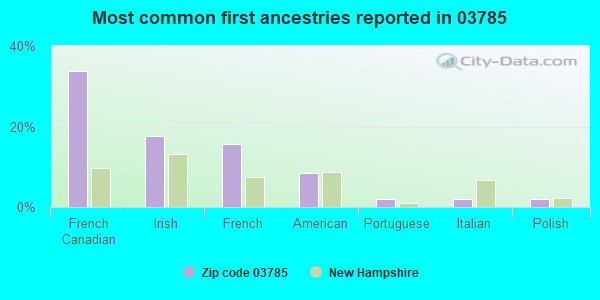
34%French Canadian
18%Irish
16%French
8%American
2%Portuguese
2%Italian
2%Polish
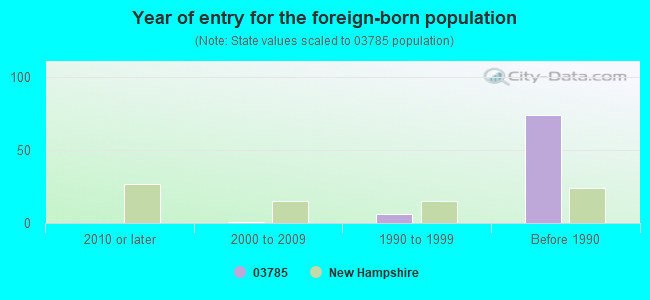
Year of entry for the foreign-born population
02010 or later
12000 to 2009
61990 to 1999
74Before 1990
Facilities with environmental interests located in this zip code:
COVENTRY GARAGE (RTE 116 in BENTON, NH)
(Resource Conservation and Recovery Act (tracking hazardous waste))
STEELE ROBERT RESIDENCE (HOWE HILL RD in BENTON, NH)
(Resource Conservation and Recovery Act (tracking hazardous waste))
SAU 23 (MUNICIPAL BLDG in WOODSVILLE, NH)
COMPLIANCE ACTIVITY (Tracking inspections of insecticide, fungicide, and rodenticide, and toxic substances)
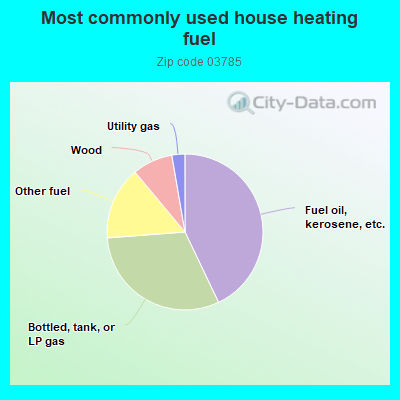
Housing units lacking complete kitchen facilities: 0.3%
43.1%Fuel oil, kerosene, etc.
31.0%Bottled, tank, or LP gas
15.2%Other fuel
8.4%Wood
2.7%Utility gas
Population in 1990: 2,292. Population change in the 1990s: +1,283 (+56.0%).
Place of birth for U.S.-born residents:
This state: 1,042
Northeast: 914
Midwest: 16
South: 96
West: 15
62% of the 03785 zip code residents lived in the same house 5 years ago. Out of people who lived in different houses, 61% lived in this county. Out of people who lived in different counties, 50% lived in New Hampshire.
98% of the 03785 zip code residents lived in the same house 1 year ago. Out of people who lived in different houses, 70% moved from this county. Out of people who lived in different houses, 56% moved from different county within same state. Out of people who lived in different houses, 19% moved from different state.
Private vs. public school enrollment:
Students in private schools in grades 1 to 8 (elementary and middle school):
Here:
0.0%
New Hampshire:
11.4%
Students in private schools in grades 9 to 12 (high school): 1
Here:
4.1%
New Hampshire:
14.0%
Students in private undergraduate colleges:
Here:
0.0%
New Hampshire:
38.0%
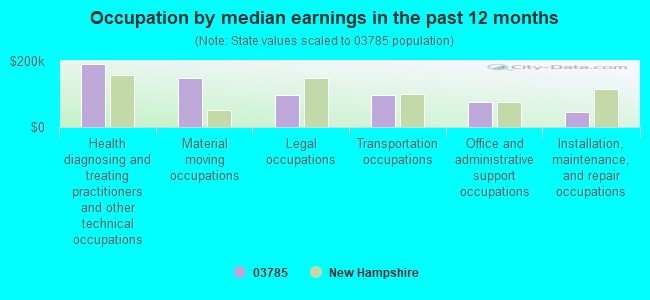
Occupation by median earnings in the past 12 months ($)
189,400Health diagnosing and treating practitioners and other technical occupations
147,016Material moving occupations
96,504Legal occupations
95,479Transportation occupations
75,665Office and administrative support occupations
46,138Installation, maintenance, and repair occupations
Top industries in this zip code by the number of employees in 2005:
Health Care and Social Assistance: General Medical and Surgical Hospitals (100-249 employees: 1 establishment)
111 people in nursing facilities/skilled-nursing facilities
People in group quarters in 2000:
191 people in nursing homes
71 people in local jails and other confinement facilities (including police lockups)
4 people in other nonhousehold living situations
4 people in other noninstitutional group quarters
2005 - 2018 National Fire Incident Reporting System (NFIRS) incidents
According to the data from the years 2005 - 2018 the average number of fire incidents per year is 9. The highest number of fires - 20 took place in 2010, and the least - 3 in 2005. The data has a growing trend.
When looking into fire subcategories, the most reports belonged to: Structure Fires (72.7%), and Outside Fires (14.8%).
Fire incident types reported to NFIRS in Zip Code 03785


 Nearest zip codes: 03238, 03780, 03774, 03279, 03779, 03765.
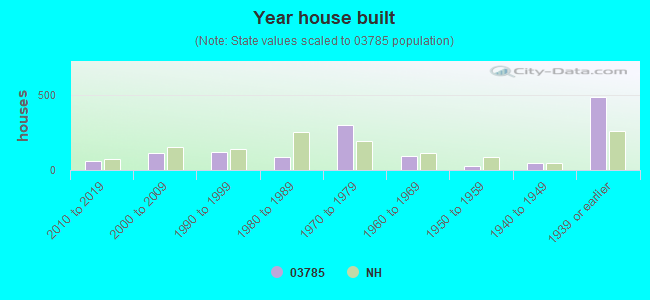


 According to the data from the years 2005 - 2018 the average number of fire incidents per year is 9. The highest number of fires - 20 took place in 2010, and the least - 3 in 2005. The data has a growing trend.
 When looking into fire subcategories, the most reports belonged to: Structure Fires (72.7%), and Outside Fires (14.8%).