Estimated zip code population in 2022: 4,862 Zip code population in 2010: 4,603 Zip code population in 2000: 4,289
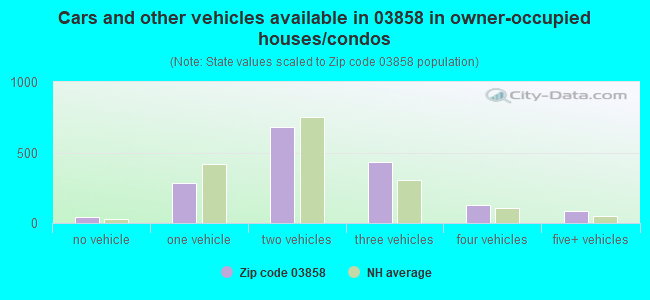
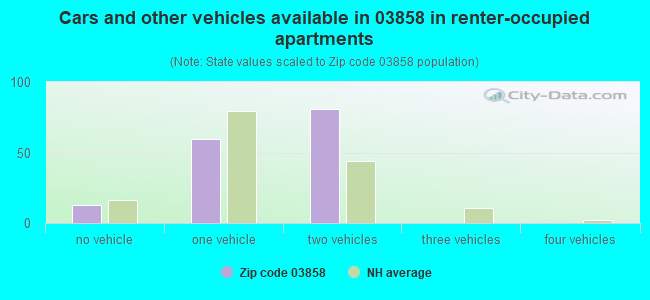
Houses and condos: 1,865 Renter-occupied apartments: 157
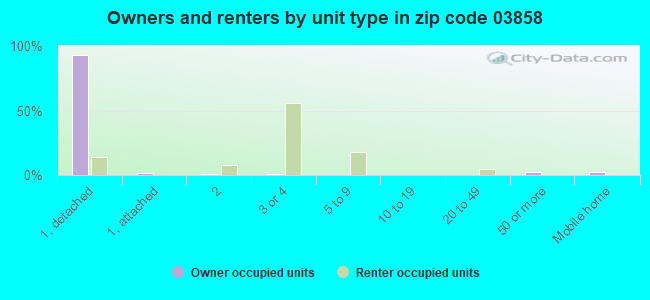
% of renters here:
9%
State:
28%
March 2022 cost of living index in zip code 03858: 129.6 (high, U.S. average is 100)
Land area: 9.9 sq. mi. Water area: 0.2 sq. mi.
Population density: 491 people per square mile
(low).
OSM Map
Google Map
MSN Map
OSM Map
General Map
Google Map
MSN Map
OSM Map
Google Map
MSN Map
OSM Map
Google Map
MSN Map
Please wait while loading the map...
Real estate property taxes paid for housing units in 2022:
This zip code:
1.7% ($7,524)
New Hampshire:
1.6% ($6,209)
Median real estate property taxes paid for housing units with mortgages in 2022: $7,408 (1.7%) Median real estate property taxes paid for housing units with no mortgage in 2022: $7,869 (1.7%)
Business Search- 14 Million verified businesses
Males: 2,418
(49.7%)
Females: 2,443
(50.3%)
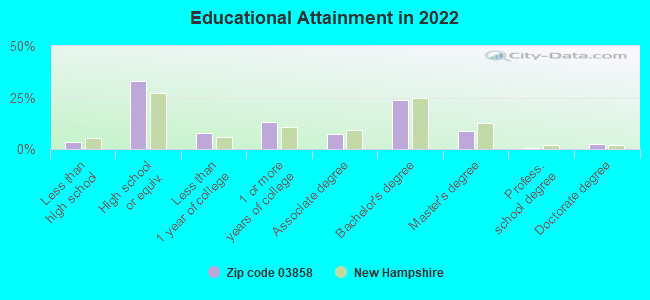
For population 25 years and over in 03858:
High school or higher: 96.9%
Bachelor's degree or higher: 35.8%
Graduate or professional degree: 11.8%
Unemployed: 2.1%
Mean travel time to work (commute): 31.4 minutes
For population 15 years and over in 03858:
Never married: 24.0%
Now married: 59.4%
Separated: 0.5%
Widowed: 3.1%
Divorced: 13.0%
Zip code 03858 compared to state average:
Median household income above state average.
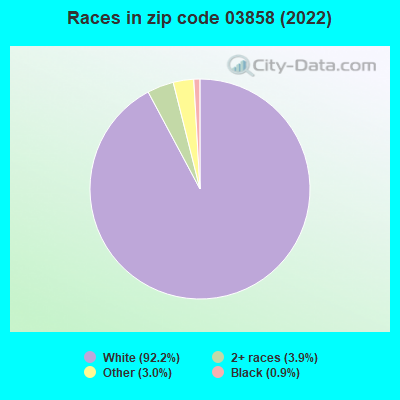
Hispanic race population percentage significantly below state average.
Foreign-born population percentage below state average.
Renting percentage significantly below state average.
Length of stay since moving in significantly above state average.
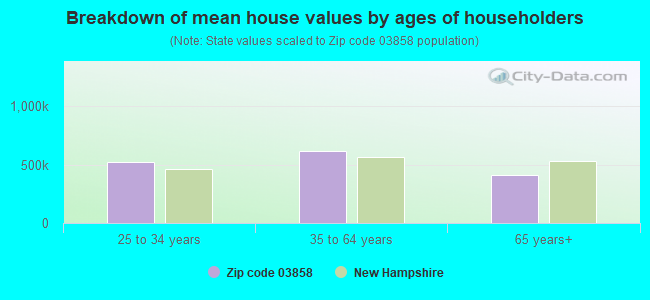
Estimated median house/condo value in 2022: $439,135
03858:
$439,135
New Hampshire:
$384,700
According to our research of New Hampshire and other state lists, there were 4 registered sex offenders living in 03858 zip code as of May 22, 2024. The ratio of all residents to sex offenders in zip code 03858 is 1,214 to 1. The ratio of registered sex offenders to all residents in this zip code is lower than the state average.
Median resident age:
This zip code:
47.2 years
New Hampshire median age:
43.3 years
Average household size:
This zip code:
2.7 people
New Hampshire:
2.4 people
Averages for the 2020 tax year for zip code 03858, filed in 2021:
Average Adjusted Gross Income (AGI) in 2020: $84,583 (Individual Income Tax Returns)
Here:
$84,583
State:
$88,845
Salary/wage: $75,524 (reported on 86.0% of returns)
Here:
$75,524
State:
$71,693
(% of AGI for various income ranges: 1270.6% for AGIs below $25k, 3901.8% for AGIs $25k-50k, 6438.6% for AGIs $50k-75k, 9900.0% for AGIs $75k-100k, 18438.5% for AGIs $100k-200k, 62508.3% for AGIs over 200k)
Taxable interest for individuals: $894 (reported on 38.4% of returns)
This zip code:
$894
New Hampshire:
$1,640
(% of AGI for various income ranges: 13.5% for AGIs below $25k, 19.4% for AGIs $25k-50k, 40.0% for AGIs $50k-75k, 66.2% for AGIs $75k-100k, 90.0% for AGIs $100k-200k, 270.0% for AGIs over 200k)
Ordinary dividends: $2,746 (reported on 19.4% of returns)
Here:
$2,746
State:
$8,258
(% of AGI for various income ranges: 19.4% for AGIs below $25k, 26.2% for AGIs $25k-50k, 70.7% for AGIs $50k-75k, 69.0% for AGIs $75k-100k, 153.5% for AGIs $100k-200k, 435.0% for AGIs over 200k)
Net capital gain/loss in AGI: +$7,157 (reported on 17.1% of returns)
Here:
+$7,157
State:
+$28,952
(% of AGI for various income ranges: 14.4% for AGIs below $25k, 39.4% for AGIs $25k-50k, 27.9% for AGIs $50k-75k, 128.6% for AGIs $75k-100k, 303.8% for AGIs $100k-200k, 2338.3% for AGIs over 200k)
Profit/loss from business: +$24,920 (reported on 13.6% of returns)
Here:
+$24,920
State:
+$24,424
(% of AGI for various income ranges: 123.5% for AGIs below $25k, 279.7% for AGIs $25k-50k, 322.9% for AGIs $50k-75k, 307.1% for AGIs $75k-100k, 834.2% for AGIs $100k-200k, 4108.3% for AGIs over 200k)
Taxable individual retirement arrangement distribution: $18,937 (reported on 10.5% of returns)
03858:
$18,937
New Hampshire:
$21,952
(% of AGI for various income ranges: 55.0% for AGIs below $25k, 114.4% for AGIs $25k-50k, 312.9% for AGIs $50k-75k, 351.4% for AGIs $75k-100k, 730.8% for AGIs $100k-200k)
Total itemized deductions: $23,206 (reported on 13.6% of returns)
Here:
$23,206
State:
$32,702
(% of AGI for various income ranges: 303.8% for AGIs $25k-50k, 393.2% for AGIs $50k-75k, 648.6% for AGIs $75k-100k, 765.2% for AGIs $100k-200k, 2608.3% for AGIs over 200k)
Charity contributions: $2,914 (reported on 8.5% of returns)
Here:
$2,914
State:
$9,866
(% of AGI for various income ranges: 8.5% for AGIs $25k-50k, 17.5% for AGIs $50k-75k, 32.4% for AGIs $75k-100k, 51.2% for AGIs $100k-200k, 483.3% for AGIs over 200k)
Taxes paid: $8,568 (reported on 13.2% of returns)
03858:
$8,568
State:
$8,247
(% of AGI for various income ranges: 117.9% for AGIs $25k-50k, 163.2% for AGIs $50k-75k, 261.0% for AGIs $75k-100k, 265.5% for AGIs $100k-200k, 741.7% for AGIs over 200k)
Earned income credit: $1,620 (reported on 5.8% of returns)
Here:
$1,620
State:
$1,831
(% of AGI for various income ranges: 42.1% for AGIs below $25k, 29.4% for AGIs $25k-50k)
Percentage of individuals using paid preparers for their 2020 taxes: 91.5%
Here:
91%
State:
92%
(% for various income ranges: 87.3% for AGIs below $25k, 91.7% for AGIs $25k-50k, 92.5% for AGIs $50k-75k, 90.3% for AGIs $75k-100k, 94.0% for AGIs $100k-200k, 94.1% for AGIs over 200k)
Averages for the 2012 tax year for zip code 03858, filed in 2013:
Average Adjusted Gross Income (AGI) in 2012: $65,270 (Individual Income Tax Returns)
Here:
$65,270
State:
$66,185
Salary/wage: $59,734 (reported on 88.5% of returns)
Here:
$59,734
State:
$55,674
(% of AGI for various income ranges: 75.1% for AGIs below $25k, 77.0% for AGIs $25k-50k, 80.5% for AGIs $50k-75k, 80.5% for AGIs $75k-100k, 86.3% for AGIs $100k-200k, 70.9% for AGIs over 200k)
Taxable interest for individuals: $662 (reported on 38.3% of returns)
This zip code:
$662
New Hampshire:
$1,674
(% of AGI for various income ranges: 1.3% for AGIs below $25k, 0.6% for AGIs $25k-50k, 0.3% for AGIs $50k-75k, 0.4% for AGIs $75k-100k, 0.2% for AGIs $100k-200k, 0.4% for AGIs over 200k)
Ordinary dividends: $1,744 (reported on 21.3% of returns)
Here:
$1,744
State:
$6,774
(% of AGI for various income ranges: 1.0% for AGIs below $25k, 0.8% for AGIs $25k-50k, 0.4% for AGIs $50k-75k, 0.6% for AGIs $75k-100k, 0.5% for AGIs $100k-200k, 0.7% for AGIs over 200k)
Net capital gain/loss in AGI: +$542 (reported on 13.2% of returns)
Here:
+$542
State:
+$13,759
(% of AGI for various income ranges: 0.2% for AGIs $75k-100k, 0.2% for AGIs $100k-200k, 0.3% for AGIs over 200k)
Profit/loss from business: +$17,878 (reported on 15.7% of returns)
Here:
+$17,878
State:
+$19,298
(% of AGI for various income ranges: 5.8% for AGIs below $25k, 5.5% for AGIs $25k-50k, 5.8% for AGIs $50k-75k, 3.9% for AGIs $75k-100k, 4.7% for AGIs $100k-200k)
Taxable individual retirement arrangement distribution: $15,452 (reported on 10.6% of returns)
03858:
$15,452
New Hampshire:
$16,908
(% of AGI for various income ranges: 3.2% for AGIs below $25k, 2.8% for AGIs $25k-50k, 2.3% for AGIs $50k-75k, 2.5% for AGIs $75k-100k, 3.2% for AGIs $100k-200k)
Total itemized deductions: $21,356 (22% of AGI, reported on 49.8% of returns)
Here:
$21,356
State:
$22,617
Here:
21.7% of AGI
State:
18.1% of AGI
(% of AGI for various income ranges: 11.4% for AGIs below $25k, 15.6% for AGIs $25k-50k, 19.5% for AGIs $50k-75k, 18.4% for AGIs $75k-100k, 16.5% for AGIs $100k-200k, 11.2% for AGIs over 200k)
Charity contributions: $1,428 (reported on 36.2% of returns)
Here:
$1,428
State:
$2,860
(% of AGI for various income ranges: 0.5% for AGIs below $25k, 0.7% for AGIs $25k-50k, 0.9% for AGIs $50k-75k, 0.9% for AGIs $75k-100k, 0.8% for AGIs $100k-200k, 0.8% for AGIs over 200k)
Taxes paid: $10,032 (reported on 49.4% of returns)
03858:
$10,032
State:
$8,830
(% of AGI for various income ranges: 3.9% for AGIs below $25k, 6.2% for AGIs $25k-50k, 8.1% for AGIs $50k-75k, 8.5% for AGIs $75k-100k, 8.1% for AGIs $100k-200k, 6.9% for AGIs over 200k)
Earned income credit: $1,639 (reported on 7.7% of returns)
Here:
$1,639
State:
$1,863
(% of AGI for various income ranges: 2.5% for AGIs below $25k, 0.5% for AGIs $25k-50k)
Percentage of individuals using paid preparers for their 2012 taxes: 50.2%
Here:
50%
State:
45%
(% for various income ranges: 42.6% for AGIs below $25k, 46.9% for AGIs $25k-50k, 55.6% for AGIs $50k-75k, 53.3% for AGIs $75k-100k, 56.5% for AGIs $100k-200k, 66.7% for AGIs over 200k)
Averages for the 2004 tax year for zip code 03858, filed in 2005:
Average Adjusted Gross Income (AGI) in 2004: $55,288 (Individual Income Tax Returns)
Here:
$55,288
State:
$54,348
Salary/wage: $50,577 (reported on 89.7% of returns)
Here:
$50,577
State:
$46,966
(% of AGI for various income ranges: 115.8% for AGIs below $10k, 69.6% for AGIs $10k-25k, 83.9% for AGIs $25k-50k, 87.2% for AGIs $50k-75k, 90.4% for AGIs $75k-100k, 74.2% for AGIs over 100k)
Taxable interest for individuals: $742 (reported on 52.8% of returns)
This zip code:
$742
New Hampshire:
$1,634
(% of AGI for various income ranges: 2.0% for AGIs below $10k, 1.8% for AGIs $10k-25k, 1.0% for AGIs $25k-50k, 0.5% for AGIs $50k-75k, 0.5% for AGIs $75k-100k, 0.7% for AGIs over 100k)
Taxable dividends: $1,217 (reported on 24.4% of returns)
Here:
$1,217
State:
$3,855
(% of AGI for various income ranges: 0.9% for AGIs below $10k, 1.0% for AGIs $10k-25k, 0.7% for AGIs $25k-50k, 0.2% for AGIs $50k-75k, 0.2% for AGIs $75k-100k, 0.7% for AGIs over 100k)
Net capital gain/loss: +$10,642 (reported on 18.5% of returns)
Here:
+$10,642
State:
+$13,739
(% of AGI for various income ranges: -0.3% for AGIs below $10k, 0.4% for AGIs $10k-25k, 0.3% for AGIs $25k-50k, 0.0% for AGIs $50k-75k, -0.1% for AGIs $75k-100k, 9.4% for AGIs over 100k)
Profit/loss from business: +$13,411 (reported on 18.2% of returns)
Here:
+$13,411
State:
+$16,641
(% of AGI for various income ranges: 5.6% for AGIs below $10k, 10.2% for AGIs $10k-25k, 5.9% for AGIs $25k-50k, 4.1% for AGIs $50k-75k, 2.8% for AGIs $75k-100k, 4.1% for AGIs over 100k)
IRA payment deduction: $2,947 (reported on 2.9% of returns)
03858:
$2,947
New Hampshire:
$3,013
Self-employed pension: $13,688 (reported on 0.8% of returns)
Here:
$13,688
New Hampshire:
$13,003
Total itemized deductions: $18,869 (24% of AGI, reported on 51.5% of returns)
Here:
$18,869
State:
$18,832
Here:
23.6% of AGI
State:
19.6% of AGI
(% of AGI for various income ranges: 15.8% for AGIs below $10k, 13.6% for AGIs $10k-25k, 18.4% for AGIs $25k-50k, 21.1% for AGIs $50k-75k, 19.7% for AGIs $75k-100k, 14.6% for AGIs over 100k)
Charity contributions deductions: $1,451 (2% of AGI, reported on 44.2% of returns)
Here:
$1,451
State:
$2,473
Here:
1.7% of AGI
State:
2.4% of AGI
(% of AGI for various income ranges: 0.7% for AGIs $10k-25k, 1.0% for AGIs $25k-50k, 1.1% for AGIs $50k-75k, 1.1% for AGIs $75k-100k, 1.4% for AGIs over 100k)
Total tax: $7,388 (reported on 82.1% of returns)
03858:
$7,388
State:
$8,835
(% of AGI for various income ranges: 4.0% for AGIs below $10k, 5.5% for AGIs $10k-25k, 7.3% for AGIs $25k-50k, 8.3% for AGIs $50k-75k, 9.5% for AGIs $75k-100k, 15.7% for AGIs over 100k)
Earned income credit: $1,399 (reported on 7.6% of returns)
Here:
$1,399
State:
$1,447
Percentage of individuals using paid preparers for their 2004 taxes: 55.6%
Here:
56%
State:
51%
(% for various income ranges: 40.8% for AGIs below $10k, 52.0% for AGIs $10k-25k, 54.8% for AGIs $25k-50k, 63.4% for AGIs $50k-75k, 64.8% for AGIs $75k-100k, 59.9% for AGIs over 100k)
Likely homosexual households (counted as self-reported same-sex unmarried-partner households)
Lesbian couples: 0.0% of all households
Gay men: 0.9% of all households
Household received Food Stamps/SNAP in the past 12 months: 60 Household did not receive Food Stamps/SNAP in the past 12 months: 1,764
Women who had a birth in the past 12 months: 13 (11 now married, 0 unmarried) Women who did not have a birth in the past 12 months: 997 (578 now married, 421 unmarried)
Housing units in zip code 03858 with a mortgage: 1,265 (154 second mortgage, 152 both second mortgage and home equity loan) Median monthly owner costs for units with a mortgage: $2,392 Median monthly owner costs for units without a mortgage: $1,078
Residents with income below the poverty level in 2022:
This zip code:
3.2%
Whole state:
7.2%
Residents with income below 50% of the poverty level in 2022:
This zip code:
2.4%
Whole state:
3.7%
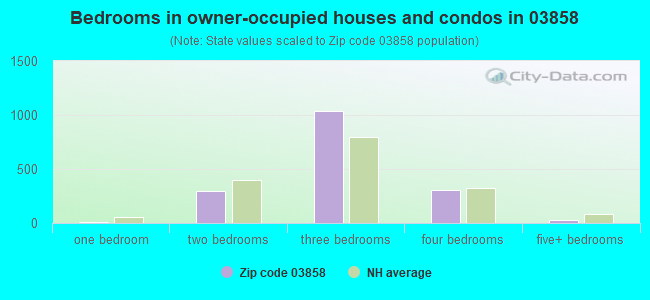
Median number of rooms in houses and condos:
Here:
6.3
State:
6.4
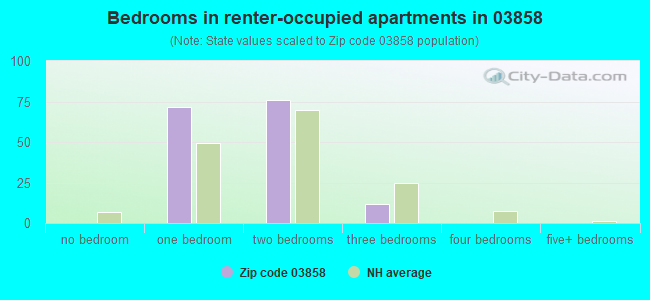
Median number of rooms in apartments:
Here:
3.5
State:
4.0
Notable locations in this zip code not listed on our city pages
Churches in zip code 03858 include: First Baptist Church (A), First Christian Church (B), Free Will Baptist Meeting House (C), Mary Mother of the Church Roman Catholic Church (D). Display/hide their locations on the map
Size of family households: 601 2-persons, 311 3-persons, 292 4-persons, 122 5-persons, 15 6-persons, 10 7-or-more-persons
Size of nonfamily households: 311 1-person, 163 2-persons
651 married couples with children.
73 single-parent households (20 men, 53 women).
97.5% of residents of 03858 zip code speak English at home.
2.0% of residents speak other Indo-European language at home (100% very well).
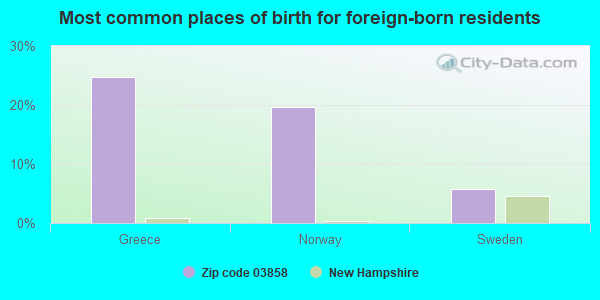
Foreign born population: 161 (3.3%) (60.3% of them are naturalized citizens)
This zip code:
3.3%
Whole state:
6.2%
25%Greece
20%Norway
6%Sweden
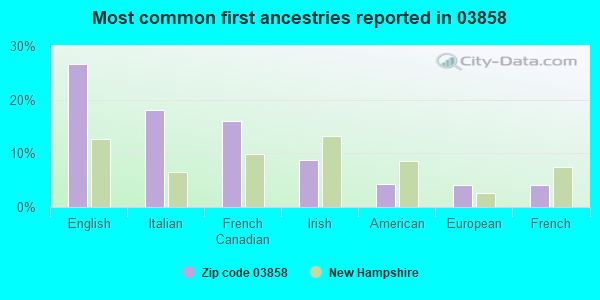
27%English
18%Italian
16%French Canadian
9%Irish
4%American
4%European
4%French
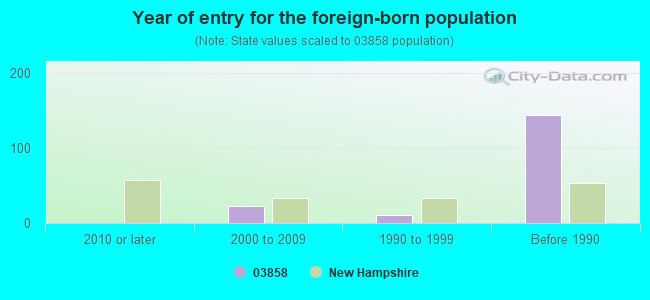
Year of entry for the foreign-born population
02010 or later
232000 to 2009
111990 to 1999
144Before 1990
Major facilities with environmental interests located in this zip code:
SANBORN REGIONAL MIDDLE SCHOOL (31A WEST MAIN ST in NEWTON, NH)
(Geographic Names Information System) COMPLIANCE ACTIVITY (Tracking inspections of insecticide, fungicide, and rodenticide, and toxic substances) (National Center for Education Statistics) - STATE ID-71747640320630 Organizations: SANBORN REGIONAL SCHOOL DISTRICT (SCHOOL DISTRICT)
CONTINENTAL BIO-MASS INDUSTRIES (22 WHITTIER STREET in NEWTON, NH)
AIR MINOR (AIRS/AFS) Conditionally Exempt Small Quantity Generators, less than 100 kg/month of hazardous waste (Resource Conservation and Recovery Act (tracking hazardous waste)) - notification HAZARDOUS WASTE BIENNIAL REPORTER (Resource Conservation and Recovery Act (tracking hazardous waste)) Business SIC classification: INDUSTRIAL AND COMMERCIAL MACHINERY AND EQUIPMENT Business NAICS classification: ALL OTHER INDUSTRIAL MACHINERY MANUFACTURING.; CONVEYOR AND CONVEYING EQUIPMENT MANUFACTURING. Alternative names: CONTINENTAL BIOMASS INDUSTRIES INC
HARTMANN OIL (32 AMESBURY RD in NEWTON, NH)
HAZARDOUS WASTE BIENNIAL REPORTER (Resource Conservation and Recovery Act (tracking hazardous waste)) (Resource Conservation and Recovery Act (tracking hazardous waste)) Organizations: NEWTON GREENHOUSE INC (CONTACT/OWNER)
Alternative names: HARTMAN OIL
OAKES PETER (7 THORNELL RD in NEWTON, NH)
(Resource Conservation and Recovery Act (tracking hazardous waste)) Organizations: PETER S OAKES (CONTACT/OWNER)
ALS STATE LINE STORE (97 AMESBURY RD in NEWTON, NH)
(Resource Conservation and Recovery Act (tracking hazardous waste))
BEARCE CHESTER E INC (MERRIMACK RD in NEWTON, NH)
(Resource Conservation and Recovery Act (tracking hazardous waste))
BOUCHER GEORGE (23 CHASE RD in NEWTON, NH)
(Resource Conservation and Recovery Act (tracking hazardous waste))
BRADFORD OIL CO (21 S MAIN ST in NEWTON, NH)
(Resource Conservation and Recovery Act (tracking hazardous waste))
BROWN KEVIN RESIDENCE (14 WHITTIER ST EXT in NEWTON, NH)
(Resource Conservation and Recovery Act (tracking hazardous waste))
BUSH E K TRUCKING (83 N MAIN ST in NEWTON, NH)
(Resource Conservation and Recovery Act (tracking hazardous waste))
DEPT OF VETERANS AFFAIRS (61 S MAIN ST in NEWTON, NH)
(Resource Conservation and Recovery Act (tracking hazardous waste))
ESTABROOKS (26 S MAIN ST in NEWTON, NH)
(Resource Conservation and Recovery Act (tracking hazardous waste))
EVELETH & SONS (9 BRIMSTONE CIRCLE in NEWTON, NH)
(Resource Conservation and Recovery Act (tracking hazardous waste))
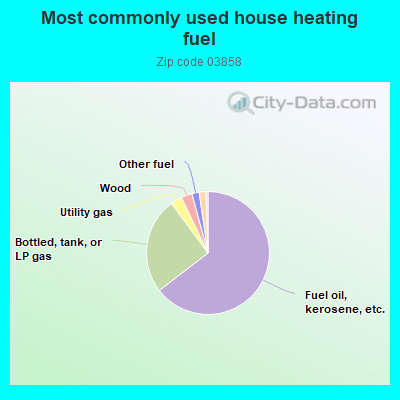
64.7%Fuel oil, kerosene, etc.
25.4%Bottled, tank, or LP gas
3.0%Utility gas
2.9%Wood
1.9%Other fuel
1.8%Electricity
0.5%Solar energy
Population in 1990: 2,944. Population change in the 1990s: +1,345 (+45.7%).
Place of birth for U.S.-born residents:
This state: 879
Northeast: 3,505
Midwest: 103
South: 47
West: 85
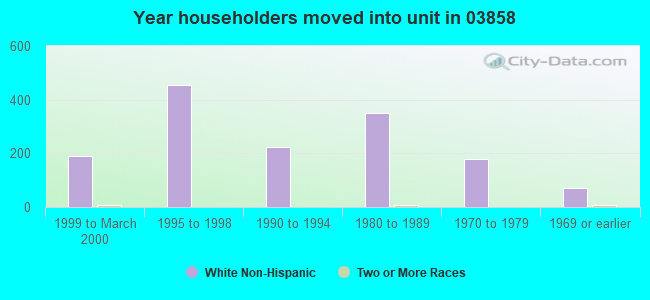
57% of the 03858 zip code residents lived in the same house 5 years ago. Out of people who lived in different houses, 30% lived in this county. Out of people who lived in different counties, 50% lived in New Hampshire.
97% of the 03858 zip code residents lived in the same house 1 year ago. Out of people who lived in different houses, 30% moved from this county. Out of people who lived in different houses, 34% moved from different county within same state. Out of people who lived in different houses, 57% moved from different state. Out of people who lived in different houses, 6% moved from abroad.
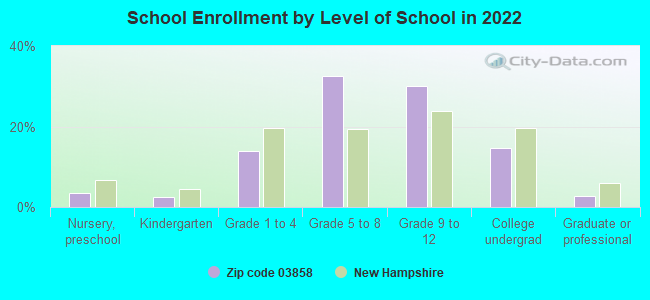
Private vs. public school enrollment:
Students in private schools in grades 1 to 8 (elementary and middle school): 22
Here:
5.8%
New Hampshire:
11.4%
Students in private schools in grades 9 to 12 (high school): 82
Here:
32.3%
New Hampshire:
14.0%
Students in private undergraduate colleges: 64
Here:
51.2%
New Hampshire:
38.0%
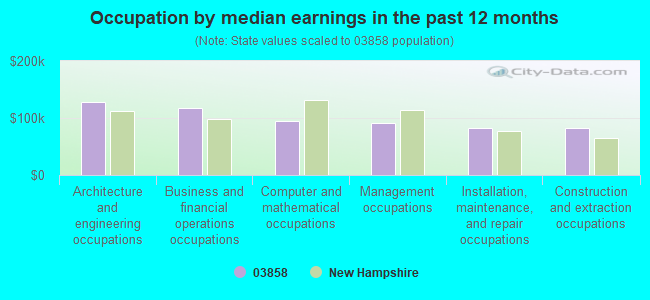
Occupation by median earnings in the past 12 months ($)
128,514Architecture and engineering occupations
117,432Business and financial operations occupations
94,943Computer and mathematical occupations
91,808Management occupations
83,008Installation, maintenance, and repair occupations
82,076Construction and extraction occupations
Top industries in this zip code by the number of employees in 2005:
Health Care and Social Assistance: Child Day Care Services (10-19 employees: 1 establishment, 1-4 employees: 2 establishments)
Wholesale Trade: Other Electronic Parts and Equipment Merchant Wholesalers (10-19: 1, 1-4: 1)
Wholesale Trade: Toy and Hobby Goods and Supplies Merchant Wholesalers (10-19: 1)
Real Estate and Rental and Leasing: Other Commercial and Industrial Machinery and Equipment Rental and Leasing (10-19: 1)
Finance and Insurance: Commercial Banking (10-19: 1)
Construction: Site Preparation Contractors (5-9: 1, 1-4: 2)
Other Services (except Public Administration): Religious Organizations (5-9: 1, 1-4: 1)
Fatal accident statistics in 2014:
Fatal accident count: 1
Vehicles involved in fatal accidents: 1
Fatal accidents caused by drunken drivers: 1
Fatalities: 1
Persons involved in fatal accidents: 1
Pedestrians involved in fatal accidents: 0
Home Mortgage Disclosure Act Aggregated Statistics For Year 2009 (Based on 2 full tracts)
A) FHA, FSA/RHS & VA Home Purchase Loans
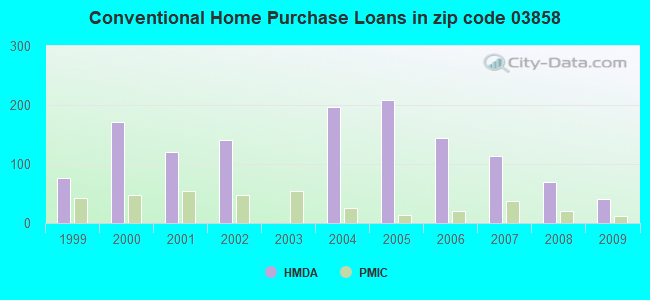
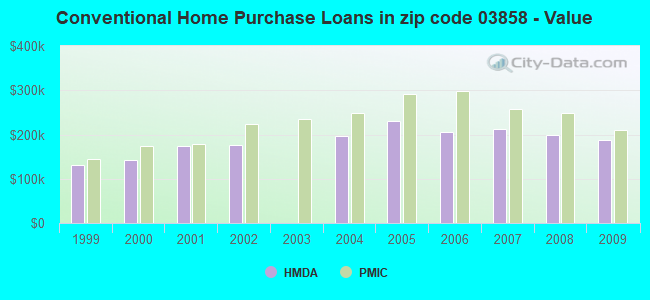
B) Conventional Home Purchase Loans
C) Refinancings
D) Home Improvement Loans
E) Loans on Dwellings For 5+ Families
F) Non-occupant Loans on < 5 Family Dwellings (A B C & D)
G) Loans On Manufactured Home Dwelling (A B C & D)
Number
Average Value
Number
Average Value
Number
Average Value
Number
Average Value
Number
Average Value
Number
Average Value
Number
Average Value
LOANS ORIGINATED
70
$237,115
40
$186,588
323
$205,826
18
$71,119
2
$187,435
0
$0
4
$53,838
APPLICATIONS APPROVED, NOT ACCEPTED
4
$199,898
2
$59,820
32
$200,833
0
$0
0
$0
0
$0
2
$59,820
APPLICATIONS DENIED
10
$194,415
18
$149,439
142
$248,492
12
$82,418
0
$0
2
$177,465
6
$86,075
APPLICATIONS WITHDRAWN
4
$273,178
4
$122,132
82
$244,289
2
$49,850
0
$0
0
$0
2
$59,820
FILES CLOSED FOR INCOMPLETENESS
2
$219,340
0
$0
14
$242,699
0
$0
0
$0
0
$0
0
$0
Aggregated Statistics For Year 2008 (Based on 2 full tracts)
A) FHA, FSA/RHS & VA Home Purchase Loans
B) Conventional Home Purchase Loans
C) Refinancings
D) Home Improvement Loans
E) Loans on Dwellings For 5+ Families
F) Non-occupant Loans on < 5 Family Dwellings (A B C & D)
G) Loans On Manufactured Home Dwelling (A B C & D)
Number
Average Value
Number
Average Value
Number
Average Value
Number
Average Value
Number
Average Value
Number
Average Value
Number
Average Value
LOANS ORIGINATED
46
$255,969
70
$198,916
201
$210,689
48
$94,923
2
$2,492,500
24
$150,132
2
$33,900
APPLICATIONS APPROVED, NOT ACCEPTED
0
$0
8
$243,268
36
$182,728
6
$29,910
0
$0
0
$0
0
$0
APPLICATIONS DENIED
4
$141,075
8
$190,676
116
$225,872
20
$127,217
2
$478,560
4
$228,312
0
$0
APPLICATIONS WITHDRAWN
2
$438,680
14
$243,553
60
$227,283
6
$168,825
0
$0
0
$0
0
$0
FILES CLOSED FOR INCOMPLETENESS
0
$0
2
$41,875
12
$238,449
0
$0
0
$0
0
$0
0
$0
Aggregated Statistics For Year 2007 (Based on 2 full tracts)
A) FHA, FSA/RHS & VA Home Purchase Loans
B) Conventional Home Purchase Loans
C) Refinancings
D) Home Improvement Loans
F) Non-occupant Loans on < 5 Family Dwellings (A B C & D)
G) Loans On Manufactured Home Dwelling (A B C & D)
Number
Average Value
Number
Average Value
Number
Average Value
Number
Average Value
Number
Average Value
Number
Average Value
LOANS ORIGINATED
4
$298,102
114
$212,711
205
$201,880
62
$83,684
16
$164,131
2
$171,485
APPLICATIONS APPROVED, NOT ACCEPTED
0
$0
14
$154,677
40
$216,000
6
$111,997
0
$0
2
$79,760
APPLICATIONS DENIED
2
$322,030
8
$247,006
191
$237,067
36
$83,692
0
$0
2
$219,340
APPLICATIONS WITHDRAWN
0
$0
10
$257,425
70
$233,697
12
$178,629
4
$214,852
0
$0
FILES CLOSED FOR INCOMPLETENESS
0
$0
4
$232,800
14
$254,235
0
$0
0
$0
0
$0
Aggregated Statistics For Year 2006 (Based on 2 full tracts)
B) Conventional Home Purchase Loans
C) Refinancings
D) Home Improvement Loans
E) Loans on Dwellings For 5+ Families
F) Non-occupant Loans on < 5 Family Dwellings (A B C & D)
G) Loans On Manufactured Home Dwelling (A B C & D)
Number
Average Value
Number
Average Value
Number
Average Value
Number
Average Value
Number
Average Value
Number
Average Value
LOANS ORIGINATED
144
$205,119
313
$189,424
70
$92,294
2
$232,300
8
$279,409
6
$64,473
APPLICATIONS APPROVED, NOT ACCEPTED
14
$171,484
50
$207,536
6
$77,767
0
$0
4
$277,665
2
$19,940
APPLICATIONS DENIED
10
$98,703
217
$221,499
40
$27,467
0
$0
10
$149,949
0
$0
APPLICATIONS WITHDRAWN
10
$200,198
124
$203,034
8
$149,550
0
$0
2
$30,905
0
$0
FILES CLOSED FOR INCOMPLETENESS
0
$0
34
$278,515
0
$0
0
$0
0
$0
0
$0
Aggregated Statistics For Year 2005 (Based on 2 full tracts)
A) FHA, FSA/RHS & VA Home Purchase Loans
B) Conventional Home Purchase Loans
C) Refinancings
D) Home Improvement Loans
F) Non-occupant Loans on < 5 Family Dwellings (A B C & D)
G) Loans On Manufactured Home Dwelling (A B C & D)
Number
Average Value
Number
Average Value
Number
Average Value
Number
Average Value
Number
Average Value
Number
Average Value
LOANS ORIGINATED
2
$247,255
209
$229,701
381
$195,381
70
$107,562
8
$200,646
2
$159,520
APPLICATIONS APPROVED, NOT ACCEPTED
0
$0
18
$250,801
76
$175,288
6
$148,553
0
$0
0
$0
APPLICATIONS DENIED
4
$201,892
22
$147,465
156
$216,196
28
$79,048
8
$210,865
4
$59,322
APPLICATIONS WITHDRAWN
0
$0
12
$199,400
140
$224,767
16
$165,252
4
$201,395
2
$44,865
FILES CLOSED FOR INCOMPLETENESS
0
$0
6
$236,622
74
$225,430
2
$119,640
2
$399,795
0
$0
Aggregated Statistics For Year 2004 (Based on 2 full tracts)
A) FHA, FSA/RHS & VA Home Purchase Loans
B) Conventional Home Purchase Loans
C) Refinancings
D) Home Improvement Loans
F) Non-occupant Loans on < 5 Family Dwellings (A B C & D)
G) Loans On Manufactured Home Dwelling (A B C & D)
Number
Average Value
Number
Average Value
Number
Average Value
Number
Average Value
Number
Average Value
Number
Average Value
LOANS ORIGINATED
10
$244,464
197
$197,366
399
$186,397
64
$83,405
10
$173,279
2
$131,605
APPLICATIONS APPROVED, NOT ACCEPTED
2
$271,185
22
$230,760
58
$167,977
12
$32,402
2
$19,940
2
$19,940
APPLICATIONS DENIED
6
$172,482
20
$325,122
128
$181,625
16
$66,674
2
$269,190
4
$139,580
APPLICATIONS WITHDRAWN
0
$0
18
$159,742
154
$182,347
8
$114,655
0
$0
2
$9,970
FILES CLOSED FOR INCOMPLETENESS
0
$0
12
$207,708
26
$205,459
2
$49,850
2
$176,470
0
$0
Aggregated Statistics For Year 2002 (Based on 2 full tracts)
A) FHA, FSA/RHS & VA Home Purchase Loans
B) Conventional Home Purchase Loans
C) Refinancings
D) Home Improvement Loans
E) Loans on Dwellings For 5+ Families
F) Non-occupant Loans on < 5 Family Dwellings (A B C & D)
Number
Average Value
Number
Average Value
Number
Average Value
Number
Average Value
Number
Average Value
Number
Average Value
LOANS ORIGINATED
12
$214,853
140
$176,697
618
$154,751
28
$38,741
2
$247,255
10
$131,803
APPLICATIONS APPROVED, NOT ACCEPTED
2
$188,435
22
$158,342
84
$148,885
18
$29,134
0
$0
0
$0
APPLICATIONS DENIED
0
$0
20
$106,280
156
$139,107
28
$22,575
0
$0
0
$0
APPLICATIONS WITHDRAWN
0
$0
18
$181,676
92
$132,254
12
$37,222
0
$0
2
$185,440
FILES CLOSED FOR INCOMPLETENESS
0
$0
2
$99,700
42
$142,761
0
$0
0
$0
0
$0
Aggregated Statistics For Year 2001 (Based on 2 full tracts)
A) FHA, FSA/RHS & VA Home Purchase Loans
B) Conventional Home Purchase Loans
C) Refinancings
D) Home Improvement Loans
F) Non-occupant Loans on < 5 Family Dwellings (A B C & D)
Number
Average Value
Number
Average Value
Number
Average Value
Number
Average Value
Number
Average Value
LOANS ORIGINATED
10
$168,892
120
$172,946
497
$138,978
28
$39,381
4
$83,748
APPLICATIONS APPROVED, NOT ACCEPTED
0
$0
12
$107,012
74
$123,008
18
$25,036
0
$0
APPLICATIONS DENIED
0
$0
14
$127,331
146
$110,544
24
$26,753
2
$104,685
APPLICATIONS WITHDRAWN
2
$168,495
10
$173,079
110
$123,791
16
$22,059
4
$68,792
FILES CLOSED FOR INCOMPLETENESS
0
$0
0
$0
20
$111,963
0
$0
0
$0
Aggregated Statistics For Year 2000 (Based on 2 full tracts)
A) FHA, FSA/RHS & VA Home Purchase Loans
B) Conventional Home Purchase Loans
C) Refinancings
D) Home Improvement Loans
F) Non-occupant Loans on < 5 Family Dwellings (A B C & D)
Number
Average Value
Number
Average Value
Number
Average Value
Number
Average Value
Number
Average Value
LOANS ORIGINATED
26
$163,968
171
$143,323
162
$117,757
26
$27,916
6
$98,038
APPLICATIONS APPROVED, NOT ACCEPTED
2
$128,615
26
$137,586
32
$98,018
18
$38,329
0
$0
APPLICATIONS DENIED
2
$128,615
20
$143,169
64
$84,870
14
$43,156
2
$94,715
APPLICATIONS WITHDRAWN
2
$138,585
10
$125,024
62
$113,433
6
$34,563
0
$0
FILES CLOSED FOR INCOMPLETENESS
2
$177,465
4
$100,198
14
$122,346
0
$0
0
$0
Aggregated Statistics For Year 1999 (Based on 1 full tract)
A) FHA, FSA/RHS & VA Home Purchase Loans
B) Conventional Home Purchase Loans
C) Refinancings
D) Home Improvement Loans
F) Non-occupant Loans on < 5 Family Dwellings (A B C & D)
Detailed PMIC statistics for the following Tracts:1021.00
2002 - 2018 National Fire Incident Reporting System (NFIRS) incidents
Based on the data from the years 2002 - 2018 the average number of fires per year is 12. The highest number of fires - 25 took place in 2015, and the least - 3 in 2002. The data has a rising trend.
When looking into fire subcategories, the most incidents belonged to: Structure Fires (55.0%), and Outside Fires (28.7%).
Fire incident types reported to NFIRS in Zip Code 03858


 Nearest zip codes: 01860, 03848, 03865, 03827, 01830, 03826.
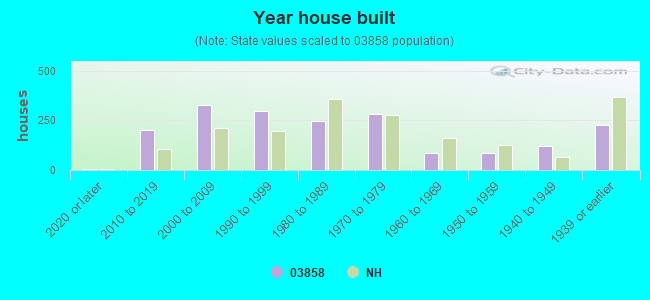


 Based on the data from the years 2002 - 2018 the average number of fires per year is 12. The highest number of fires - 25 took place in 2015, and the least - 3 in 2002. The data has a rising trend.
 When looking into fire subcategories, the most incidents belonged to: Structure Fires (55.0%), and Outside Fires (28.7%).