Estimated zip code population in 2022: 2,506 Zip code population in 2010: 2,208 Zip code population in 2000: 1,473
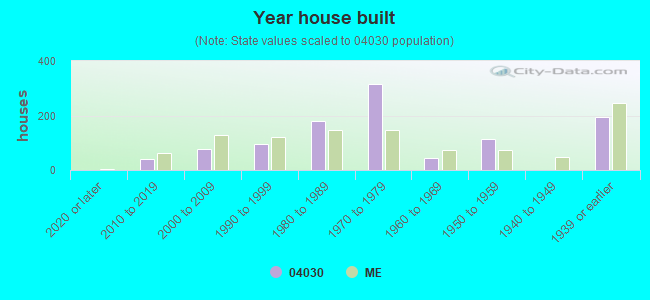
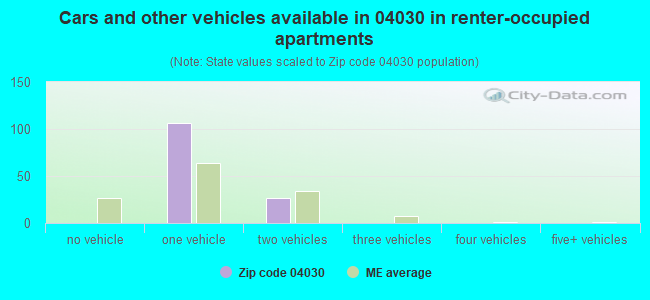
Houses and condos: 1,083 Renter-occupied apartments: 136
% of renters here:
15%
State:
26%
March 2022 cost of living index in zip code 04030: 100.6 (near average, U.S. average is 100)
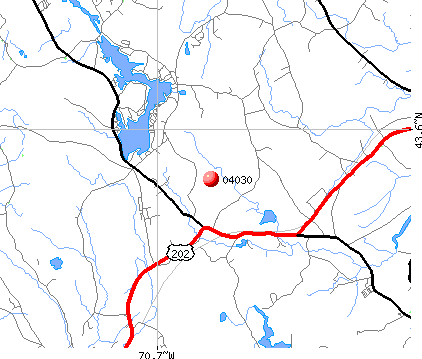
Land area: 16.6 sq. mi. Water area: 0.9 sq. mi.
Population density: 151 people per square mile
(very low).
OSM Map
Google Map
MSN Map
OSM Map
General Map
Google Map
MSN Map
OSM Map
Google Map
MSN Map
OSM Map
Google Map
MSN Map
Please wait while loading the map...
Real estate property taxes paid for housing units in 2022:
This zip code:
0.8% ($2,859)
Maine:
1.0% ($2,785)
Median real estate property taxes paid for housing units with mortgages in 2022: $2,845 (0.8%) Median real estate property taxes paid for housing units with no mortgage in 2022: $2,991 (1.2%)
Business Search- 14 Million verified businesses
Males: 1,086
(43.4%)
Females: 1,419
(56.6%)
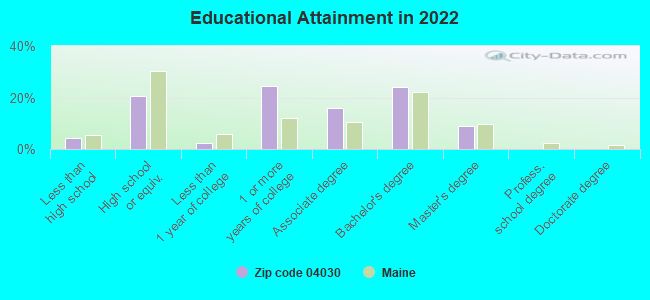
For population 25 years and over in 04030:
High school or higher: 94.2%
Bachelor's degree or higher: 32.2%
Graduate or professional degree: 8.7%
Unemployed: 1.1%
Mean travel time to work (commute): 34.5 minutes
For population 15 years and over in 04030:
Never married: 30.7%
Now married: 56.8%
Separated: 0.4%
Widowed: 2.9%
Divorced: 9.3%
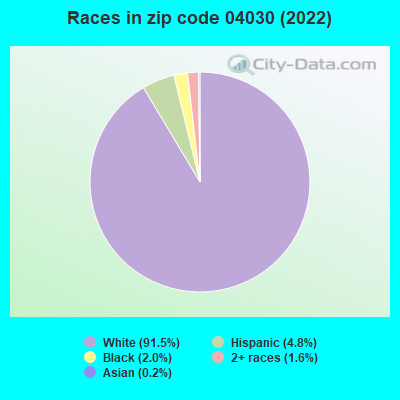
Zip code 04030 compared to state average:
Unemployed percentage significantly below state average.
Hispanic race population percentage above state average.
Median age significantly below state average.
Renting percentage below state average.
Length of stay since moving in significantly below state average.
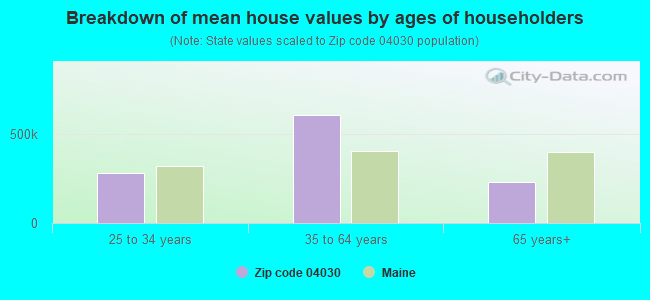
Estimated median house/condo value in 2022: $338,915
04030:
$338,915
Maine:
$290,600
According to our research of Maine and other state lists, there were 3 registered sex offenders living in 04030 zip code as of May 28, 2024. The ratio of all residents to sex offenders in zip code 04030 is 901 to 1. The ratio of registered sex offenders to all residents in this zip code is lower than the state average.
Median resident age:
This zip code:
34.8 years
Maine median age:
45.1 years
Average household size:
This zip code:
2.8 people
Maine:
2.2 people
Averages for the 2020 tax year for zip code 04030, filed in 2021:
Average Adjusted Gross Income (AGI) in 2020: $61,334 (Individual Income Tax Returns)
Here:
$61,334
State:
$68,227
Salary/wage: $57,219 (reported on 84.1% of returns)
Here:
$57,219
State:
$55,127
(% of AGI for various income ranges: 1230.0% for AGIs below $25k, 3745.8% for AGIs $25k-50k, 5806.9% for AGIs $50k-75k, 10156.0% for AGIs $75k-100k, 15537.5% for AGIs $100k-200k)
Taxable interest for individuals: $333 (reported on 40.7% of returns)
This zip code:
$333
Maine:
$1,162
(% of AGI for various income ranges: 17.6% for AGIs below $25k, 11.7% for AGIs $25k-50k, 14.4% for AGIs $50k-75k, 28.0% for AGIs $75k-100k, 36.7% for AGIs $100k-200k)
Ordinary dividends: $1,594 (reported on 14.2% of returns)
Here:
$1,594
State:
$7,695
(% of AGI for various income ranges: 18.2% for AGIs below $25k, 10.4% for AGIs $25k-50k, 26.9% for AGIs $50k-75k, 130.0% for AGIs $100k-200k)
Net capital gain/loss in AGI: +$7,050 (reported on 10.6% of returns)
Here:
+$7,050
State:
+$22,201
(% of AGI for various income ranges: 25.8% for AGIs $25k-50k, 85.0% for AGIs $50k-75k, 540.0% for AGIs $100k-200k)
Profit/loss from business: +$13,093 (reported on 13.3% of returns)
Here:
+$13,093
State:
+$15,095
(% of AGI for various income ranges: 135.9% for AGIs below $25k, 152.1% for AGIs $25k-50k, 264.4% for AGIs $50k-75k, 787.5% for AGIs $100k-200k)
Taxable individual retirement arrangement distribution: $12,364 (reported on 9.7% of returns)
04030:
$12,364
Maine:
$18,314
(% of AGI for various income ranges: 224.7% for AGIs below $25k, 238.8% for AGIs $50k-75k, 596.0% for AGIs $75k-100k)
Total itemized deductions: $22,100 (reported on 5.3% of returns)
Here:
$22,100
State:
$31,197
(% of AGI for various income ranges: 486.9% for AGIs $50k-75k, 455.8% for AGIs $100k-200k)
Charity contributions: $1,267 (reported on 2.7% of returns)
Here:
$1,267
State:
$9,863
(% of AGI for various income ranges: 38.0% for AGIs $75k-100k)
Taxes paid: $7,043 (reported on 6.2% of returns)
04030:
$7,043
State:
$8,241
(% of AGI for various income ranges: 180.0% for AGIs $50k-75k, 170.8% for AGIs $100k-200k)
Earned income credit: $2,150 (reported on 8.8% of returns)
Here:
$2,150
State:
$1,960
(% of AGI for various income ranges: 75.3% for AGIs below $25k, 36.2% for AGIs $25k-50k)
Percentage of individuals using paid preparers for their 2020 taxes: 92.9%
Here:
93%
State:
92%
(% for various income ranges: 89.7% for AGIs below $25k, 93.3% for AGIs $25k-50k, 95.0% for AGIs $50k-75k, 92.9% for AGIs $75k-100k, 94.4% for AGIs $100k-200k, 100.0% for AGIs over 200k)
Averages for the 2012 tax year for zip code 04030, filed in 2013:
Average Adjusted Gross Income (AGI) in 2012: $48,545 (Individual Income Tax Returns)
Here:
$48,545
State:
$52,375
Salary/wage: $45,292 (reported on 88.8% of returns)
Here:
$45,292
State:
$43,415
(% of AGI for various income ranges: 76.0% for AGIs below $25k, 82.1% for AGIs $25k-50k, 81.4% for AGIs $50k-75k, 85.2% for AGIs $75k-100k, 84.8% for AGIs $100k-200k)
Taxable interest for individuals: $413 (reported on 30.6% of returns)
This zip code:
$413
Maine:
$1,221
(% of AGI for various income ranges: 0.6% for AGIs below $25k, 0.3% for AGIs $25k-50k, 0.1% for AGIs $50k-75k, 0.1% for AGIs $75k-100k, 0.3% for AGIs $100k-200k)
Ordinary dividends: $1,200 (reported on 13.3% of returns)
Here:
$1,200
State:
$5,812
(% of AGI for various income ranges: 0.5% for AGIs below $25k, 0.5% for AGIs $25k-50k, 0.2% for AGIs $50k-75k, 0.2% for AGIs $75k-100k, 0.4% for AGIs $100k-200k)
Net capital gain/loss in AGI: +$1,167 (reported on 9.2% of returns)
Here:
+$1,167
State:
+$11,897
(% of AGI for various income ranges: 0.4% for AGIs $25k-50k, 0.2% for AGIs $50k-75k, 0.7% for AGIs $75k-100k)
Profit/loss from business: +$12,060 (reported on 15.3% of returns)
Here:
+$12,060
State:
+$12,144
(% of AGI for various income ranges: 6.8% for AGIs below $25k, 3.6% for AGIs $25k-50k, 1.3% for AGIs $50k-75k, 9.6% for AGIs $75k-100k)
Taxable individual retirement arrangement distribution: $9,633 (reported on 9.2% of returns)
04030:
$9,633
Maine:
$13,385
(% of AGI for various income ranges: 4.0% for AGIs below $25k, 2.5% for AGIs $25k-50k, 4.5% for AGIs $50k-75k)
Total itemized deductions: $18,531 (24% of AGI, reported on 35.7% of returns)
Here:
$18,531
State:
$21,859
Here:
23.5% of AGI
State:
20.9% of AGI
(% of AGI for various income ranges: 10.1% for AGIs below $25k, 10.6% for AGIs $25k-50k, 14.2% for AGIs $50k-75k, 13.8% for AGIs $75k-100k, 16.5% for AGIs $100k-200k)
Charity contributions: $1,554 (reported on 26.5% of returns)
Here:
$1,554
State:
$2,741
(% of AGI for various income ranges: 0.8% for AGIs $25k-50k, 1.2% for AGIs $50k-75k, 0.9% for AGIs $75k-100k, 0.9% for AGIs $100k-200k)
Taxes paid: $7,663 (reported on 35.7% of returns)
04030:
$7,663
State:
$9,996
(% of AGI for various income ranges: 2.2% for AGIs below $25k, 3.7% for AGIs $25k-50k, 5.1% for AGIs $50k-75k, 5.9% for AGIs $75k-100k, 8.4% for AGIs $100k-200k)
Earned income credit: $2,040 (reported on 15.3% of returns)
Here:
$2,040
State:
$1,959
(% of AGI for various income ranges: 5.1% for AGIs below $25k, 0.9% for AGIs $25k-50k)
Percentage of individuals using paid preparers for their 2012 taxes: 49.0%
Here:
49%
State:
48%
(% for various income ranges: 41.2% for AGIs below $25k, 48.0% for AGIs $25k-50k, 58.8% for AGIs $50k-75k, 53.8% for AGIs $75k-100k, 55.6% for AGIs $100k-200k)
Averages for the 2004 tax year for zip code 04030, filed in 2005:
Average Adjusted Gross Income (AGI) in 2004: $40,120 (Individual Income Tax Returns)
Here:
$40,120
State:
$42,606
Salary/wage: $39,012 (reported on 87.9% of returns)
Here:
$39,012
State:
$36,376
(% of AGI for various income ranges: 97.2% for AGIs below $10k, 74.6% for AGIs $10k-25k, 83.5% for AGIs $25k-50k, 88.7% for AGIs $50k-75k, 92.0% for AGIs $75k-100k, 77.8% for AGIs over 100k)
Taxable interest for individuals: $452 (reported on 46.0% of returns)
This zip code:
$452
Maine:
$1,367
(% of AGI for various income ranges: 2.8% for AGIs below $10k, 1.6% for AGIs $10k-25k, 0.5% for AGIs $25k-50k, 0.2% for AGIs $50k-75k, 0.3% for AGIs $75k-100k, 0.6% for AGIs over 100k)
Taxable dividends: $936 (reported on 14.8% of returns)
Here:
$936
State:
$3,533
(% of AGI for various income ranges: 0.6% for AGIs below $10k, 0.4% for AGIs $10k-25k, 0.4% for AGIs $25k-50k, 0.3% for AGIs $50k-75k, 0.3% for AGIs $75k-100k, 0.4% for AGIs over 100k)
Net capital gain/loss: +$4,824 (reported on 11.4% of returns)
Here:
+$4,824
State:
+$11,433
(% of AGI for various income ranges: -0.1% for AGIs $10k-25k, -0.3% for AGIs $25k-50k, 0.8% for AGIs $50k-75k, -0.0% for AGIs $75k-100k, 8.9% for AGIs over 100k)
Profit/loss from business: +$9,348 (reported on 16.4% of returns)
Here:
+$9,348
State:
+$10,755
(% of AGI for various income ranges: 20.9% for AGIs below $10k, 8.8% for AGIs $10k-25k, 7.0% for AGIs $25k-50k, 2.8% for AGIs $50k-75k, -0.1% for AGIs $75k-100k)
IRA payment deduction: $2,440 (reported on 2.6% of returns)
04030:
$2,440
Maine:
$3,014
Total itemized deductions: $15,035 (24% of AGI, reported on 39.0% of returns)
Here:
$15,035
State:
$18,231
Here:
23.9% of AGI
State:
21.7% of AGI
(% of AGI for various income ranges: 14.5% for AGIs $10k-25k, 13.2% for AGIs $25k-50k, 15.9% for AGIs $50k-75k, 16.4% for AGIs $75k-100k, 13.9% for AGIs over 100k)
Charity contributions deductions: $1,371 (2% of AGI, reported on 34.0% of returns)
Here:
$1,371
State:
$2,466
Here:
2.2% of AGI
State:
2.8% of AGI
(% of AGI for various income ranges: 0.6% for AGIs $10k-25k, 0.9% for AGIs $25k-50k, 1.2% for AGIs $50k-75k, 1.6% for AGIs $75k-100k, 1.6% for AGIs over 100k)
Total tax: $4,516 (reported on 80.8% of returns)
04030:
$4,516
State:
$6,047
(% of AGI for various income ranges: 4.1% for AGIs below $10k, 4.9% for AGIs $10k-25k, 7.3% for AGIs $25k-50k, 8.2% for AGIs $50k-75k, 10.0% for AGIs $75k-100k, 16.4% for AGIs over 100k)
Earned income credit: $1,270 (reported on 12.2% of returns)
Here:
$1,270
State:
$1,520
Percentage of individuals using paid preparers for their 2004 taxes: 48.6%
Here:
49%
State:
53%
(% for various income ranges: 31.6% for AGIs below $10k, 48.4% for AGIs $10k-25k, 50.4% for AGIs $25k-50k, 62.6% for AGIs $50k-75k, 41.9% for AGIs $75k-100k, 61.8% for AGIs over 100k)
Household received Food Stamps/SNAP in the past 12 months: 24 Household did not receive Food Stamps/SNAP in the past 12 months: 855
Women who had a birth in the past 12 months: 54 (53 now married, 0 unmarried) Women who did not have a birth in the past 12 months: 608 (237 now married, 370 unmarried)
Housing units in zip code 04030 with a mortgage: 689 (88 second mortgage, 89 both second mortgage and home equity loan) Houses without a mortgage: 125
Median monthly owner costs for units with a mortgage: $1,634 Median monthly owner costs for units without a mortgage: $633
Residents with income below the poverty level in 2022:
This zip code:
11.1%
Whole state:
10.8%
Residents with income below 50% of the poverty level in 2022:
This zip code:
6.0%
Whole state:
5.8%
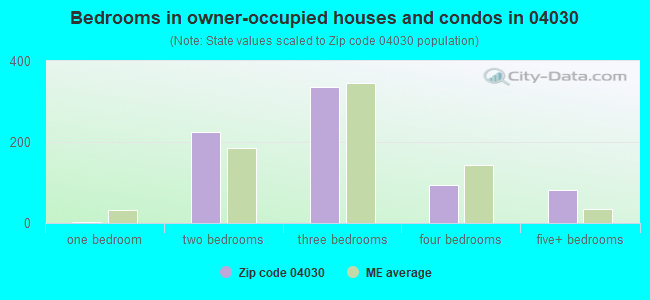
Median number of rooms in houses and condos:
Here:
7.1
State:
6.1
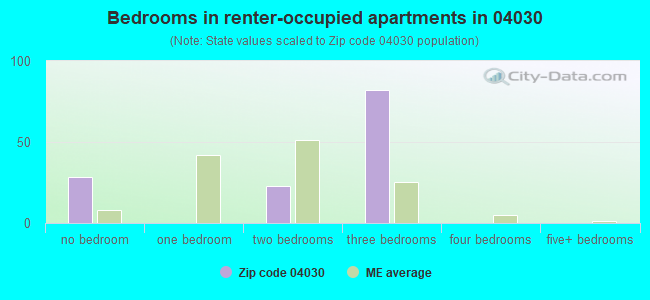
Median number of rooms in apartments:
Here:
4.6
State:
4.0
Notable locations in this zip code not listed on our city pages
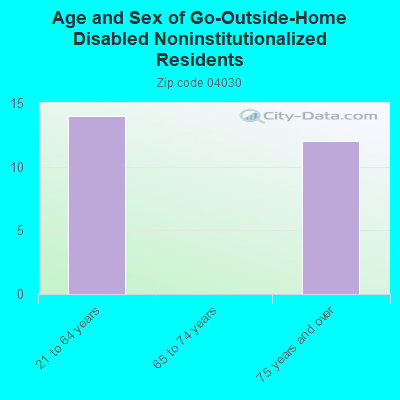
In group quarters: 22 (-1 institutionalized population)
Size of family households: 240 2-persons, 124 3-persons, 66 4-persons, 96 5-persons, 48 6-persons, 41 7-or-more-persons
Size of nonfamily households: 252 1-person, 5 2-persons
376 married couples with children.
117 single-parent households (9 men, 108 women).
92.7% of residents of 04030 zip code speak English at home.
4.2% of residents speak Spanish at home (18% very well, 82% well).
2.0% of residents speak other Indo-European language at home (98% very well, 2% well).
0.2% of residents speak Asian or Pacific Island language at home (100% very well).
0.7% of residents speak other language at home (100% very well).
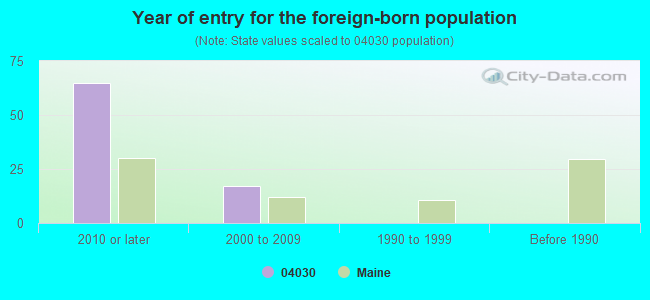
Foreign born population: 74 (3.0%) (28.3% of them are naturalized citizens)
This zip code:
3.0%
Whole state:
4.1%
59%Honduras
28%Ethiopia
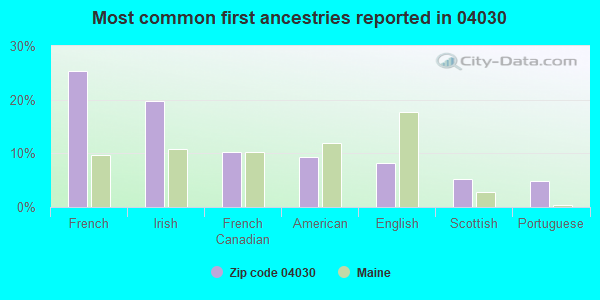
25%French
20%Irish
10%French Canadian
9%American
8%English
5%Scottish
5%Portuguese
Year of entry for the foreign-born population
652010 or later
172000 to 2009
01990 to 1999
0Before 1990
Facilities with environmental interests located in this zip code:
HEATHS VARIETY (PO BOX 339 in EAST WATERBORO, ME)
(Integrated Compliance Information System) - ICIS-01-2002-0018, FORMAL ENFORCEMENT ACTION
SOUTHERN ME FINISHING CORP (RTE 5 in EAST WATERBORO, ME)
(Resource Conservation and Recovery Act (tracking hazardous waste)) Business NAICS classification: ELECTROPLATING, PLATING, POLISHING, ANODIZING, AND COLORING. Organizations: GANNETT STUART SR (CONTACT/OWNER)
ABBOT'S GENERAL STORE (ROUTE 202 in EAST WATERBORO, ME)
AIR MINOR (AIRS/AFS)
70.8%Fuel oil, kerosene, etc.
13.5%Bottled, tank, or LP gas
11.7%Wood
2.6%Electricity
1.8%Utility gas
Population in 1990: 1,153. Population change in the 1990s: +320 (+27.8%).
Place of birth for U.S.-born residents:
This state: 1,774
Northeast: 442
Midwest: 20
South: 121
West: 46
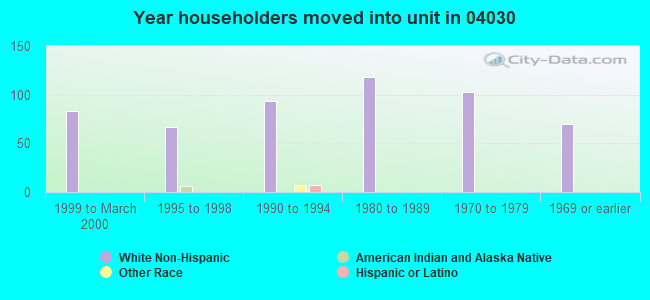
73% of the 04030 zip code residents lived in the same house 5 years ago. Out of people who lived in different houses, 87% lived in this county. Out of people who lived in different counties, 50% lived in Maine.
75% of the 04030 zip code residents lived in the same house 1 year ago. Out of people who lived in different houses, 55% moved from this county. Out of people who lived in different houses, 9% moved from different county within same state. Out of people who lived in different houses, 16% moved from different state. Out of people who lived in different houses, 5% moved from abroad.
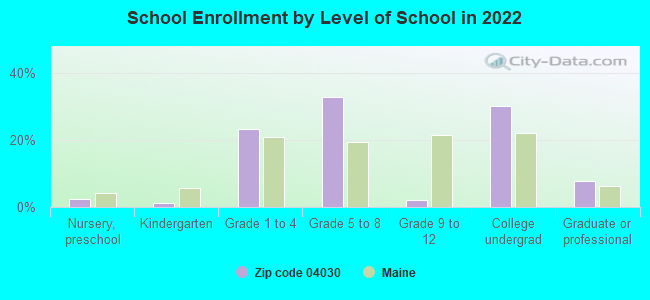
Private vs. public school enrollment:
Students in private schools in grades 1 to 8 (elementary and middle school): 14
Here:
3.9%
Maine:
12.7%
Students in private schools in grades 9 to 12 (high school):
Here:
0.0%
Maine:
12.6%
Students in private undergraduate colleges: 15
Here:
8.2%
Maine:
34.5%
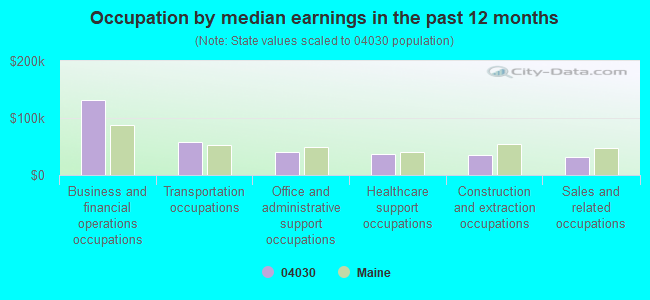
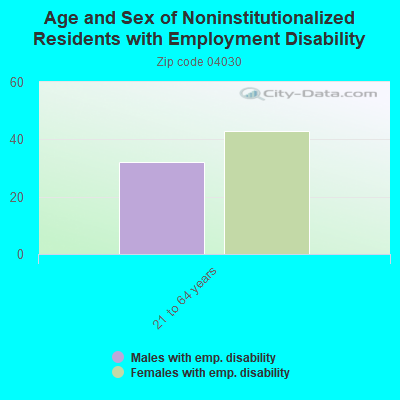
Occupation by median earnings in the past 12 months ($)
130,784Business and financial operations occupations
57,371Transportation occupations
40,891Office and administrative support occupations
37,678Healthcare support occupations
34,809Construction and extraction occupations
31,436Sales and related occupations
Top industries in this zip code by the number of employees in 2005:
Accommodation and Food Services: Limited-Service Restaurants (20-49 employees: 1 establishment)
Finance and Insurance: Savings Institutions (10-19: 1, 5-9: 1)
Accommodation and Food Services: Full-Service Restaurants (10-19: 1, 1-4: 2)
Other Services (except Public Administration): General Automotive Repair (5-9: 1, 1-4: 1)
Construction: New Single-Family Housing Construction (except Operative Builders) (5-9: 1, 1-4: 1)
People in group quarters in 2010:
3 people in college/university student housing
3 people in group homes intended for adults
People in group quarters in 2000:
6 people in homes for the mentally retarded
Fatal accident statistics in 2013:
Fatal accident count: 1
Vehicles involved in fatal accidents: 1
Fatal accidents caused by drunken drivers: 0
Fatalities: 1
Persons involved in fatal accidents: 1
Pedestrians involved in fatal accidents: 0
Home Mortgage Disclosure Act Aggregated Statistics For Year 2009 (Based on 2 partial tracts)
A) FHA, FSA/RHS & VA Home Purchase Loans
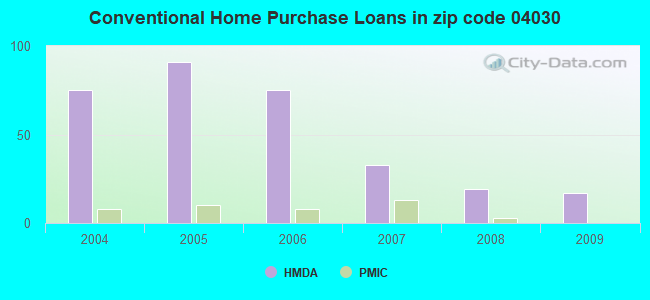
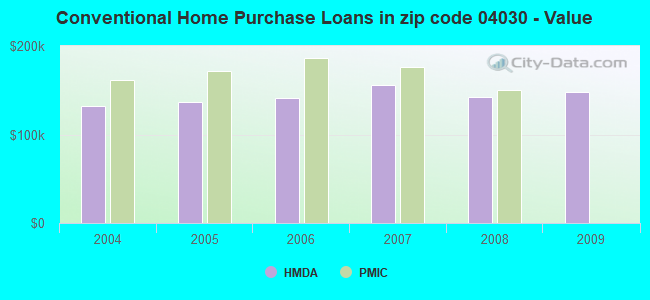
B) Conventional Home Purchase Loans
C) Refinancings
D) Home Improvement Loans
F) Non-occupant Loans on < 5 Family Dwellings (A B C & D)
G) Loans On Manufactured Home Dwelling (A B C & D)
Number
Average Value
Number
Average Value
Number
Average Value
Number
Average Value
Number
Average Value
Number
Average Value
LOANS ORIGINATED
20
$139,990
17
$147,559
78
$156,727
10
$76,729
11
$144,930
1
$98,510
APPLICATIONS APPROVED, NOT ACCEPTED
2
$130,445
0
$0
6
$154,562
1
$77,340
0
$0
0
$0
APPLICATIONS DENIED
2
$144,685
2
$104,090
40
$184,704
5
$54,564
4
$189,322
1
$73,880
APPLICATIONS WITHDRAWN
1
$182,010
1
$174,700
17
$162,408
0
$0
1
$160,080
0
$0
FILES CLOSED FOR INCOMPLETENESS
0
$0
0
$0
5
$196,632
0
$0
0
$0
0
$0
Aggregated Statistics For Year 2008 (Based on 2 partial tracts)
A) FHA, FSA/RHS & VA Home Purchase Loans
B) Conventional Home Purchase Loans
C) Refinancings
D) Home Improvement Loans
F) Non-occupant Loans on < 5 Family Dwellings (A B C & D)
G) Loans On Manufactured Home Dwelling (A B C & D)
Number
Average Value
Number
Average Value
Number
Average Value
Number
Average Value
Number
Average Value
Number
Average Value
LOANS ORIGINATED
8
$162,001
19
$141,890
65
$147,372
16
$54,569
17
$169,697
4
$52,430
APPLICATIONS APPROVED, NOT ACCEPTED
1
$163,920
5
$146,762
11
$149,303
1
$106,970
3
$134,937
0
$0
APPLICATIONS DENIED
3
$155,073
5
$133,680
52
$159,440
10
$31,823
2
$138,530
5
$86,042
APPLICATIONS WITHDRAWN
2
$176,625
0
$0
16
$173,593
1
$28,860
1
$173,540
0
$0
FILES CLOSED FOR INCOMPLETENESS
0
$0
1
$57,340
3
$151,867
0
$0
0
$0
0
$0
Aggregated Statistics For Year 2007 (Based on 2 partial tracts)
A) FHA, FSA/RHS & VA Home Purchase Loans
B) Conventional Home Purchase Loans
C) Refinancings
D) Home Improvement Loans
F) Non-occupant Loans on < 5 Family Dwellings (A B C & D)
G) Loans On Manufactured Home Dwelling (A B C & D)
Number
Average Value
Number
Average Value
Number
Average Value
Number
Average Value
Number
Average Value
Number
Average Value
LOANS ORIGINATED
6
$167,580
33
$155,856
73
$140,747
22
$51,790
10
$164,771
4
$72,150
APPLICATIONS APPROVED, NOT ACCEPTED
0
$0
6
$134,038
18
$157,341
2
$83,310
1
$157,000
1
$86,960
APPLICATIONS DENIED
1
$127,370
8
$181,530
62
$153,157
17
$68,381
3
$172,390
3
$68,110
APPLICATIONS WITHDRAWN
0
$0
4
$185,472
28
$159,019
4
$147,668
2
$133,910
0
$0
FILES CLOSED FOR INCOMPLETENESS
0
$0
1
$70,030
7
$170,576
0
$0
0
$0
0
$0
Aggregated Statistics For Year 2006 (Based on 2 partial tracts)
A) FHA, FSA/RHS & VA Home Purchase Loans
B) Conventional Home Purchase Loans
C) Refinancings
D) Home Improvement Loans
F) Non-occupant Loans on < 5 Family Dwellings (A B C & D)
G) Loans On Manufactured Home Dwelling (A B C & D)
Number
Average Value
Number
Average Value
Number
Average Value
Number
Average Value
Number
Average Value
Number
Average Value
LOANS ORIGINATED
9
$184,490
75
$141,581
123
$134,520
32
$60,077
14
$125,033
5
$65,954
APPLICATIONS APPROVED, NOT ACCEPTED
0
$0
12
$123,713
18
$149,067
2
$129,680
3
$158,667
1
$84,270
APPLICATIONS DENIED
1
$130,450
17
$130,515
83
$141,310
13
$50,232
6
$127,753
4
$77,825
APPLICATIONS WITHDRAWN
1
$123,520
9
$110,780
41
$117,599
5
$67,494
3
$134,553
2
$82,345
FILES CLOSED FOR INCOMPLETENESS
0
$0
1
$185,860
20
$160,520
0
$0
0
$0
0
$0
Aggregated Statistics For Year 2005 (Based on 2 partial tracts)
A) FHA, FSA/RHS & VA Home Purchase Loans
B) Conventional Home Purchase Loans
C) Refinancings
D) Home Improvement Loans
F) Non-occupant Loans on < 5 Family Dwellings (A B C & D)
G) Loans On Manufactured Home Dwelling (A B C & D)
Number
Average Value
Number
Average Value
Number
Average Value
Number
Average Value
Number
Average Value
Number
Average Value
LOANS ORIGINATED
6
$173,930
91
$136,879
139
$134,539
21
$59,790
13
$152,174
4
$95,622
APPLICATIONS APPROVED, NOT ACCEPTED
0
$0
10
$123,521
13
$137,818
2
$43,290
2
$156,035
1
$86,580
APPLICATIONS DENIED
0
$0
12
$130,992
79
$136,302
14
$64,481
3
$130,577
3
$105,437
APPLICATIONS WITHDRAWN
1
$132,760
10
$126,368
63
$133,648
4
$61,568
1
$127,370
0
$0
FILES CLOSED FOR INCOMPLETENESS
0
$0
3
$137,247
18
$156,400
1
$75,040
0
$0
0
$0
Aggregated Statistics For Year 2004 (Based on 2 partial tracts)
A) FHA, FSA/RHS & VA Home Purchase Loans
B) Conventional Home Purchase Loans
C) Refinancings
D) Home Improvement Loans
F) Non-occupant Loans on < 5 Family Dwellings (A B C & D)
G) Loans On Manufactured Home Dwelling (A B C & D)


 Nearest zip codes: 04087, 04061, 04042, 04002, 04048, 04076.