Estimated zip code population in 2022: 749 Zip code population in 2010: 911 Zip code population in 2000: 702
Houses and condos: 359 Renter-occupied apartments: 35
% of renters here:
11%
State:
26%
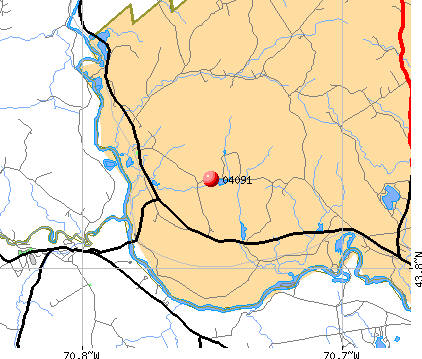
March 2022 cost of living index in zip code 04091: 83.5 (less than average, U.S. average is 100)
Land area: 19.4 sq. mi. Water area: 0.6 sq. mi.
Population density: 39 people per square mile
(very low).
OSM Map
Google Map
MSN Map
OSM Map
General Map
Google Map
MSN Map
OSM Map
Google Map
MSN Map
OSM Map
Google Map
MSN Map
Please wait while loading the map...
Real estate property taxes paid for housing units in 2022:
This zip code:
0.9% ($2,302)
Maine:
1.0% ($2,785)
Median real estate property taxes paid for housing units with mortgages in 2022: $2,456 (0.8%) Median real estate property taxes paid for housing units with no mortgage in 2022: $2,199 (0.9%)
Estimated median house/condo value in 2022: $270,419
04091:
$270,419
Maine:
$290,600
According to our research of Maine and other state lists, there were 2 registered sex offenders living in 04091 zip code as of May 28, 2024. The ratio of all residents to sex offenders in zip code 04091 is 452 to 1. The ratio of registered sex offenders to all residents in this zip code is near the state average.
Median resident age:
This zip code:
48.7 years
Maine median age:
45.1 years
Average household size:
This zip code:
2.4 people
Maine:
2.2 people
Averages for the 2020 tax year for zip code 04091, filed in 2021:
Average Adjusted Gross Income (AGI) in 2020: $53,134 (Individual Income Tax Returns)
Here:
$53,134
State:
$68,227
Salary/wage: $45,416 (reported on 81.1% of returns)
Here:
$45,416
State:
$55,127
(% of AGI for various income ranges: 1217.3% for AGIs below $25k, 3722.7% for AGIs $25k-50k, 6970.0% for AGIs $50k-75k, 11060.0% for AGIs $75k-100k, 21983.3% for AGIs $100k-200k)
Taxable interest for individuals: $271 (reported on 32.1% of returns)
This zip code:
$271
Maine:
$1,162
(% of AGI for various income ranges: 3.6% for AGIs below $25k, 5.5% for AGIs $25k-50k, 6.7% for AGIs $50k-75k, 16.7% for AGIs $75k-100k, 90.0% for AGIs $100k-200k)
Ordinary dividends: $6,500 (reported on 7.5% of returns)
Here:
$6,500
State:
$7,695
(% of AGI for various income ranges: 29.1% for AGIs below $25k, 760.0% for AGIs $75k-100k)
Net capital gain/loss in AGI: +$13,400 (reported on 11.3% of returns)
Here:
+$13,400
State:
+$22,201
(% of AGI for various income ranges: 68.2% for AGIs $25k-50k, 2430.0% for AGIs $100k-200k)
Profit/loss from business: +$8,044 (reported on 17.0% of returns)
Here:
+$8,044
State:
+$15,095
(% of AGI for various income ranges: 423.6% for AGIs below $25k, 430.0% for AGIs $50k-75k)
Taxable individual retirement arrangement distribution: $18,900 (reported on 7.5% of returns)
04091:
$18,900
Maine:
$18,314
(% of AGI for various income ranges: 202.7% for AGIs below $25k, 888.3% for AGIs $50k-75k)
Earned income credit: $1,738 (reported on 15.1% of returns)
Here:
$1,738
State:
$1,960
(% of AGI for various income ranges: 78.2% for AGIs below $25k, 48.2% for AGIs $25k-50k)
Percentage of individuals using paid preparers for their 2020 taxes: 92.5%
Here:
92%
State:
92%
(% for various income ranges: 94.1% for AGIs below $25k, 93.3% for AGIs $25k-50k, 88.9% for AGIs $50k-75k, 100.0% for AGIs $75k-100k, 85.7% for AGIs $100k-200k)
Averages for the 2012 tax year for zip code 04091, filed in 2013:
Average Adjusted Gross Income (AGI) in 2012: $44,614 (Individual Income Tax Returns)
Here:
$44,614
State:
$52,375
Salary/wage: $35,646 (reported on 88.1% of returns)
Here:
$35,646
State:
$43,415
(% of AGI for various income ranges: 66.9% for AGIs below $25k, 80.8% for AGIs $25k-50k, 83.8% for AGIs $50k-75k, 82.4% for AGIs $75k-100k, 44.8% for AGIs $100k-200k)
Taxable interest for individuals: $615 (reported on 31.0% of returns)
This zip code:
$615
Maine:
$1,221
(% of AGI for various income ranges: 0.4% for AGIs below $25k, 0.7% for AGIs $25k-50k, 0.4% for AGIs $50k-75k, 0.8% for AGIs $75k-100k)
Ordinary dividends: $1,025 (reported on 9.5% of returns)
Here:
$1,025
State:
$5,812
Profit/loss from business: +$5,700 (reported on 19.0% of returns)
Here:
+$5,700
State:
+$12,144
(% of AGI for various income ranges: 13.5% for AGIs below $25k, 2.0% for AGIs $25k-50k, 2.0% for AGIs $50k-75k)
Taxable individual retirement arrangement distribution: $8,900 (reported on 7.1% of returns)
04091:
$8,900
Maine:
$13,385
Total itemized deductions: $19,655 (24% of AGI, reported on 26.2% of returns)
Here:
$19,655
State:
$21,859
Here:
24.0% of AGI
State:
20.9% of AGI
(% of AGI for various income ranges: 15.6% for AGIs $25k-50k, 7.7% for AGIs $50k-75k, 12.3% for AGIs $75k-100k, 15.9% for AGIs $100k-200k)
Charity contributions: $1,667 (reported on 14.3% of returns)
Here:
$1,667
State:
$2,741
Taxes paid: $7,582 (reported on 26.2% of returns)
04091:
$7,582
State:
$9,996
(% of AGI for various income ranges: 3.4% for AGIs $25k-50k, 2.9% for AGIs $50k-75k, 5.2% for AGIs $75k-100k, 8.1% for AGIs $100k-200k)
Earned income credit: $2,114 (reported on 16.7% of returns)
Here:
$2,114
State:
$1,959
(% of AGI for various income ranges: 7.0% for AGIs below $25k)
Percentage of individuals using paid preparers for their 2012 taxes: 50.0%
Here:
50%
State:
48%
(% for various income ranges: 44.4% for AGIs below $25k, 45.5% for AGIs $25k-50k, 57.1% for AGIs $50k-75k, 133.3% for AGIs $75k-100k)
Averages for the 2004 tax year for zip code 04091, filed in 2005:
Average Adjusted Gross Income (AGI) in 2004: $39,057 (Individual Income Tax Returns)
Here:
$39,057
State:
$42,606
Salary/wage: $33,038 (reported on 85.3% of returns)
Here:
$33,038
State:
$36,376
(% of AGI for various income ranges: 87.8% for AGIs below $10k, 64.3% for AGIs $10k-25k, 85.8% for AGIs $25k-50k, 85.8% for AGIs $50k-75k, 63.2% for AGIs $75k-100k, 41.1% for AGIs over 100k)
Taxable interest for individuals: $617 (reported on 41.8% of returns)
This zip code:
$617
Maine:
$1,367
(% of AGI for various income ranges: 0.3% for AGIs below $10k, 0.9% for AGIs $10k-25k, 0.3% for AGIs $25k-50k, 0.1% for AGIs $50k-75k, 2.5% for AGIs $75k-100k, 0.6% for AGIs over 100k)
Taxable dividends: $750 (reported on 16.3% of returns)
Here:
$750
State:
$3,533
(% of AGI for various income ranges: 0.6% for AGIs $10k-25k, 0.1% for AGIs $25k-50k, 0.2% for AGIs $50k-75k, 1.3% for AGIs $75k-100k)
Net capital gain/loss: +$8,479 (reported on 13.0% of returns)
Here:
+$8,479
State:
+$11,433
(% of AGI for various income ranges: -0.8% for AGIs $10k-25k, 0.9% for AGIs $50k-75k, 20.0% for AGIs $75k-100k)
Profit/loss from business: +$5,814 (reported on 19.0% of returns)
Here:
+$5,814
State:
+$10,755
(% of AGI for various income ranges: 12.3% for AGIs $10k-25k, 4.8% for AGIs $25k-50k, -0.1% for AGIs $50k-75k, 2.2% for AGIs $75k-100k)
Total itemized deductions: $15,059 (22% of AGI, reported on 27.7% of returns)
Here:
$15,059
State:
$18,231
Here:
21.6% of AGI
State:
21.7% of AGI
(% of AGI for various income ranges: 13.4% for AGIs $25k-50k, 12.3% for AGIs $50k-75k, 11.0% for AGIs $75k-100k, 10.6% for AGIs over 100k)
Charity contributions deductions: $1,523 (2% of AGI, reported on 23.9% of returns)
Here:
$1,523
State:
$2,466
Here:
2.1% of AGI
State:
2.8% of AGI
(% of AGI for various income ranges: 1.3% for AGIs $25k-50k, 1.2% for AGIs $50k-75k, 0.7% for AGIs $75k-100k, 0.8% for AGIs over 100k)
Total tax: $4,597 (reported on 78.3% of returns)
04091:
$4,597
State:
$6,047
(% of AGI for various income ranges: 0.7% for AGIs below $10k, 5.9% for AGIs $10k-25k, 7.0% for AGIs $25k-50k, 7.7% for AGIs $50k-75k, 11.5% for AGIs $75k-100k, 15.6% for AGIs over 100k)
Earned income credit: $1,173 (reported on 14.1% of returns)
Here:
$1,173
State:
$1,520
Percentage of individuals using paid preparers for their 2004 taxes: 52.2%
Here:
52%
State:
53%
(% for various income ranges: 47.8% for AGIs below $10k, 48.8% for AGIs $10k-25k, 41.7% for AGIs $25k-50k, 64.5% for AGIs $50k-75k, 73.9% for AGIs $75k-100k, 82.4% for AGIs over 100k)
Size of family households: 123 2-persons, 47 3-persons, 23 4-persons, 4 5-persons, 3 6-persons, 10 7-or-more-persons
Size of nonfamily households: 78 1-person, 21 2-persons
34 married couples with children.
17 single-parent households (9 men, 8 women).
98.9% of residents of 04091 zip code speak English at home.
1.0% of residents speak other Indo-European language at home (100% very well).
Foreign born population: 4 (0.6%) (100.0% of them are naturalized citizens)
This zip code:
0.6%
Whole state:
4.1%
75%Sweden
75%United Kingdom, excluding England and Scotland
33%English
16%American
10%Irish
7%Canadian
3%German
3%Polish
2%French Canadian
Year of entry for the foreign-born population
02010 or later
02000 to 2009
01990 to 1999
3Before 1990
Facilities with environmental interests located in this zip code:
BALDWIN CONSOLIDATED SCHOOL (536 PEQUAWKET TRAIL in WEST BALDWIN, ME)
(National Center for Education Statistics) - STATE ID-02501 Organizations: MSAD 55 HIRAM (SCHOOL DISTRICT)
FPL ENERGY HIRAM HYDRO STATION (ROUTE 113 SACO RIVER in WEST BALDWIN, ME)
National Pollutant Discharge Elimination System NON-MAJOR (Tracking pollutant discharge elimination systems) - permit Business SIC classification: ELECTRIC SERVICES Organizations: FPL ENERGY MAINE HYDRO HIRAM H (CONTACT/OWNER)
Alternative names: FPL ENERGY HIRAM STATION
LIUDAS NORMANTAS (ROUTE 113 in WEST BALDWIN, ME)
AIR MINOR (AIRS/AFS) Business SIC classification: REFUSE SYSTEMS
MAIETTA ENTERPRISES INCORPORATED (ROUTE 113 in WEST BALDWIN, ME)
AIR MINOR (AIRS/AFS)
PIKE INDUSTRIES (PORTABLE in WEST BALDWIN, ME)
AIR SYNTHETIC MINOR (AIRS/AFS)
Housing units lacking complete plumbing facilities: 0.7% Housing units lacking complete kitchen facilities: 0.7%
78.6%Fuel oil, kerosene, etc.
9.8%Wood
7.5%Bottled, tank, or LP gas
3.0%Electricity
1.0%Utility gas
0.7%Other fuel
Population in 1990: 770.
Place of birth for U.S.-born residents:
This state: 518
Northeast: 163
Midwest: 8
South: 23
West: 25
69% of the 04091 zip code residents lived in the same house 5 years ago. Out of people who lived in different houses, 58% lived in this county. Out of people who lived in different counties, 50% lived in Maine.
93% of the 04091 zip code residents lived in the same house 1 year ago. Out of people who lived in different houses, 63% moved from this county. Out of people who lived in different houses, 17% moved from different county within same state. Out of people who lived in different houses, 10% moved from different state.
Private vs. public school enrollment:
Students in private schools in grades 1 to 8 (elementary and middle school): 7
Here:
20.8%
Maine:
12.7%
Students in private schools in grades 9 to 12 (high school):
Here:
0.0%
Maine:
12.6%
Students in private undergraduate colleges: 3
Here:
9.0%
Maine:
34.5%
Occupation by median earnings in the past 12 months ($)
80,979Installation, maintenance, and repair occupations
78,049Business and financial operations occupations
50,666Material moving occupations
46,291Construction and extraction occupations
44,529Health diagnosing and treating practitioners and other technical occupations
44,061Production occupations
Top industries in this zip code by the number of employees in 2005:
Information: Cable and Other Program Distribution (20-49 employees: 1 establishment)
Accommodation and Food Services: Full-Service Restaurants (20-49: 1)
Construction: Site Preparation Contractors (5-9: 1, 1-4: 1)
Educational Services: Elementary and Secondary Schools (5-9: 1, 1-4: 1)
Professional, Scientific, and Technical Services: Engineering Services (1-4: 2)
Administrative and Support and Waste Management and Remediation Services: Septic Tank and Related Services (1-4: 1)
Fatal accident statistics in 2012:
Fatal accident count: 1
Vehicles involved in fatal accidents: 1
Fatal accidents caused by drunken drivers: 1
Fatalities: 1
Persons involved in fatal accidents: 1
Pedestrians involved in fatal accidents: 0
Home Mortgage Disclosure Act Aggregated Statistics For Year 2009 (Based on 2 partial tracts)
A) FHA, FSA/RHS & VA Home Purchase Loans
B) Conventional Home Purchase Loans
C) Refinancings
D) Home Improvement Loans
F) Non-occupant Loans on < 5 Family Dwellings (A B C & D)
G) Loans On Manufactured Home Dwelling (A B C & D)
Number
Average Value
Number
Average Value
Number
Average Value
Number
Average Value
Number
Average Value
Number
Average Value
LOANS ORIGINATED
7
$148,333
7
$177,917
40
$181,946
4
$58,100
10
$247,174
2
$102,090
APPLICATIONS APPROVED, NOT ACCEPTED
1
$138,610
1
$162,260
5
$160,770
1
$100,430
2
$195,880
0
$0
APPLICATIONS DENIED
1
$159,360
1
$146,080
17
$160,288
5
$83,830
4
$154,172
2
$62,455
APPLICATIONS WITHDRAWN
0
$0
0
$0
7
$182,421
0
$0
0
$0
0
$0
FILES CLOSED FOR INCOMPLETENESS
0
$0
0
$0
2
$123,255
0
$0
1
$197,130
0
$0
Aggregated Statistics For Year 2008 (Based on 2 partial tracts)
A) FHA, FSA/RHS & VA Home Purchase Loans
B) Conventional Home Purchase Loans
C) Refinancings
D) Home Improvement Loans
F) Non-occupant Loans on < 5 Family Dwellings (A B C & D)
G) Loans On Manufactured Home Dwelling (A B C & D)
Number
Average Value
Number
Average Value
Number
Average Value
Number
Average Value
Number
Average Value
Number
Average Value
LOANS ORIGINATED
2
$162,060
5
$165,336
30
$124,486
5
$115,286
8
$153,291
2
$92,335
APPLICATIONS APPROVED, NOT ACCEPTED
0
$0
2
$111,010
4
$117,132
1
$114,540
2
$111,635
1
$83,830
APPLICATIONS DENIED
0
$0
4
$112,880
26
$166,543
8
$76,256
5
$199,116
1
$84,240
APPLICATIONS WITHDRAWN
1
$146,080
0
$0
12
$181,286
0
$0
1
$181,350
0
$0
FILES CLOSED FOR INCOMPLETENESS
0
$0
0
$0
2
$157,075
1
$60,170
0
$0
0
$0
Aggregated Statistics For Year 2007 (Based on 2 partial tracts)
A) FHA, FSA/RHS & VA Home Purchase Loans
B) Conventional Home Purchase Loans
C) Refinancings
D) Home Improvement Loans
F) Non-occupant Loans on < 5 Family Dwellings (A B C & D)
G) Loans On Manufactured Home Dwelling (A B C & D)
Number
Average Value
Number
Average Value
Number
Average Value
Number
Average Value
Number
Average Value
Number
Average Value
LOANS ORIGINATED
2
$204,180
12
$201,759
35
$134,187
8
$51,356
9
$181,770
1
$112,460
APPLICATIONS APPROVED, NOT ACCEPTED
0
$0
3
$151,197
9
$170,934
2
$76,775
2
$106,860
0
$0
APPLICATIONS DENIED
1
$126,990
4
$120,245
27
$149,093
8
$70,654
6
$135,428
2
$134,460
APPLICATIONS WITHDRAWN
0
$0
3
$178,173
13
$217,236
1
$59,760
2
$128,235
0
$0
FILES CLOSED FOR INCOMPLETENESS
0
$0
0
$0
2
$82,170
0
$0
0
$0
0
$0
Aggregated Statistics For Year 2006 (Based on 2 partial tracts)
A) FHA, FSA/RHS & VA Home Purchase Loans
B) Conventional Home Purchase Loans
C) Refinancings
D) Home Improvement Loans
F) Non-occupant Loans on < 5 Family Dwellings (A B C & D)
G) Loans On Manufactured Home Dwelling (A B C & D)
Number
Average Value
Number
Average Value
Number
Average Value
Number
Average Value
Number
Average Value
Number
Average Value
LOANS ORIGINATED
1
$175,540
19
$143,022
46
$147,659
15
$41,583
9
$222,348
3
$99,187
APPLICATIONS APPROVED, NOT ACCEPTED
0
$0
5
$94,370
11
$182,637
0
$0
1
$442,810
0
$0
APPLICATIONS DENIED
1
$124,910
5
$126,658
35
$163,641
7
$54,010
3
$301,427
2
$91,095
APPLICATIONS WITHDRAWN
0
$0
3
$113,987
10
$133,671
3
$111,357
1
$138,190
0
$0
FILES CLOSED FOR INCOMPLETENESS
0
$0
2
$107,900
10
$126,492
0
$0
0
$0
0
$0
Aggregated Statistics For Year 2005 (Based on 2 partial tracts)
A) FHA, FSA/RHS & VA Home Purchase Loans
B) Conventional Home Purchase Loans
C) Refinancings
D) Home Improvement Loans
F) Non-occupant Loans on < 5 Family Dwellings (A B C & D)
G) Loans On Manufactured Home Dwelling (A B C & D)
Number
Average Value
Number
Average Value
Number
Average Value
Number
Average Value
Number
Average Value
Number
Average Value
LOANS ORIGINATED
2
$125,120
27
$146,541
61
$136,875
14
$45,116
12
$152,409
4
$99,705
APPLICATIONS APPROVED, NOT ACCEPTED
0
$0
1
$171,390
6
$123,047
2
$92,755
0
$0
0
$0
APPLICATIONS DENIED
0
$0
5
$169,486
35
$127,357
10
$37,640
2
$252,110
5
$75,114
APPLICATIONS WITHDRAWN
0
$0
1
$85,080
27
$145,911
2
$107,485
1
$106,660
1
$151,890
FILES CLOSED FOR INCOMPLETENESS
0
$0
0
$0
5
$158,612
0
$0
0
$0
0
$0
Aggregated Statistics For Year 2004 (Based on 2 partial tracts)
A) FHA, FSA/RHS & VA Home Purchase Loans
B) Conventional Home Purchase Loans
C) Refinancings
D) Home Improvement Loans
F) Non-occupant Loans on < 5 Family Dwellings (A B C & D)
G) Loans On Manufactured Home Dwelling (A B C & D)


 Nearest zip codes: 04024, 04029, 04041, 04020, 04049, 04085.


