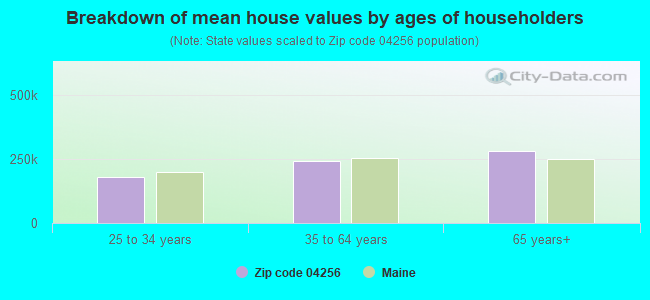
Estimated median house/condo value in 2022: $252,257
04256:
$252,257
Maine:
$290,600
According to our research of Maine and other state lists, there were 7 registered sex offenders living in 04256 zip code as of May 30, 2024. The ratio of all residents to sex offenders in zip code 04256 is 430 to 1. The ratio of registered sex offenders to all residents in this zip code is near the state average.
Median resident age:
This zip code:
36.0 years
Maine median age:
45.1 years
Average household size:
This zip code:
2.7 people
Maine:
2.2 people
Averages for the 2020 tax year for zip code 04256, filed in 2021:
Average Adjusted Gross Income (AGI) in 2020: $49,158 (Individual Income Tax Returns)
Here:
$49,158
State:
$68,227
Salary/wage: $44,404 (reported on 88.8% of returns)
Here:
$44,404
State:
$55,127
(% of AGI for various income ranges: 1336.1% for AGIs below $25k, 3740.5% for AGIs $25k-50k, 7161.1% for AGIs $50k-75k, 10754.0% for AGIs $75k-100k, 19226.7% for AGIs $100k-200k)
Taxable interest for individuals: $514 (reported on 24.3% of returns)
This zip code:
$514
Maine:
$1,162
(% of AGI for various income ranges: 3.9% for AGIs below $25k, 2.8% for AGIs $25k-50k, 45.6% for AGIs $50k-75k, 13.0% for AGIs $75k-100k, 78.9% for AGIs $100k-200k)
Ordinary dividends: $1,071 (reported on 9.2% of returns)
Here:
$1,071
State:
$7,695
(% of AGI for various income ranges: 8.8% for AGIs below $25k, 10.0% for AGIs $25k-50k, 23.3% for AGIs $50k-75k, 44.4% for AGIs $100k-200k)
Net capital gain/loss in AGI: +$3,425 (reported on 7.9% of returns)
Here:
+$3,425
State:
+$22,201
(% of AGI for various income ranges: 12.6% for AGIs $25k-50k, 63.3% for AGIs $50k-75k, 275.6% for AGIs $100k-200k)
Profit/loss from business: +$9,719 (reported on 10.5% of returns)
Here:
+$9,719
State:
+$15,095
(% of AGI for various income ranges: 90.0% for AGIs below $25k, 125.1% for AGIs $25k-50k, 141.1% for AGIs $50k-75k, 147.0% for AGIs $75k-100k, 410.0% for AGIs $100k-200k)
Taxable individual retirement arrangement distribution: $11,500 (reported on 6.6% of returns)
04256:
$11,500
Maine:
$18,314
(% of AGI for various income ranges: 55.8% for AGIs below $25k, 124.9% for AGIs $25k-50k, 479.0% for AGIs $75k-100k)
Total itemized deductions: $19,967 (reported on 2.0% of returns)
Here:
$19,967
State:
$31,197
(% of AGI for various income ranges: 332.8% for AGIs $50k-75k)
Taxes paid: $5,733 (reported on 2.0% of returns)
04256:
$5,733
State:
$8,241
(% of AGI for various income ranges: 95.6% for AGIs $50k-75k)
Earned income credit: $2,274 (reported on 15.1% of returns)
Here:
$2,274
State:
$1,960
(% of AGI for various income ranges: 84.8% for AGIs below $25k, 62.3% for AGIs $25k-50k)
Percentage of individuals using paid preparers for their 2020 taxes: 91.4%
Here:
91%
State:
92%
(% for various income ranges: 88.9% for AGIs below $25k, 96.0% for AGIs $25k-50k, 88.5% for AGIs $50k-75k, 86.7% for AGIs $75k-100k, 93.8% for AGIs $100k-200k)
Averages for the 2012 tax year for zip code 04256, filed in 2013:
Average Adjusted Gross Income (AGI) in 2012: $39,393 (Individual Income Tax Returns)
Here:
$39,393
State:
$52,375
Salary/wage: $36,536 (reported on 91.0% of returns)
Here:
$36,536
State:
$43,415
(% of AGI for various income ranges: 81.3% for AGIs below $25k, 84.7% for AGIs $25k-50k, 86.8% for AGIs $50k-75k, 92.2% for AGIs $75k-100k, 75.5% for AGIs $100k-200k)
Taxable interest for individuals: $529 (reported on 23.1% of returns)
This zip code:
$529
Maine:
$1,221
(% of AGI for various income ranges: 0.7% for AGIs below $25k, 0.3% for AGIs $25k-50k, 0.4% for AGIs $50k-75k, 0.2% for AGIs $100k-200k)
Ordinary dividends: $1,085 (reported on 9.7% of returns)
Here:
$1,085
State:
$5,812
(% of AGI for various income ranges: 0.2% for AGIs below $25k, 0.4% for AGIs $25k-50k, 0.5% for AGIs $50k-75k)
Net capital gain/loss in AGI: +$912 (reported on 6.0% of returns)
Here:
+$912
State:
+$11,897
Profit/loss from business: +$8,600 (reported on 12.7% of returns)
Here:
+$8,600
State:
+$12,144
(% of AGI for various income ranges: 4.6% for AGIs below $25k, 4.2% for AGIs $25k-50k, 2.6% for AGIs $50k-75k, 2.2% for AGIs $75k-100k)
Taxable individual retirement arrangement distribution: $7,990 (reported on 7.5% of returns)
04256:
$7,990
Maine:
$13,385
(% of AGI for various income ranges: 2.6% for AGIs below $25k, 1.8% for AGIs $25k-50k, 2.7% for AGIs $50k-75k)
Total itemized deductions: $17,429 (23% of AGI, reported on 20.9% of returns)
Here:
$17,429
State:
$21,859
Here:
22.8% of AGI
State:
20.9% of AGI
(% of AGI for various income ranges: 3.3% for AGIs below $25k, 6.8% for AGIs $25k-50k, 8.5% for AGIs $50k-75k, 12.7% for AGIs $75k-100k, 15.1% for AGIs $100k-200k)
Charity contributions: $1,475 (reported on 14.9% of returns)
Here:
$1,475
State:
$2,741
(% of AGI for various income ranges: 0.7% for AGIs $25k-50k, 0.3% for AGIs $50k-75k, 0.8% for AGIs $75k-100k, 0.9% for AGIs $100k-200k)
Taxes paid: $7,071 (reported on 20.9% of returns)
04256:
$7,071
State:
$9,996
(% of AGI for various income ranges: 0.8% for AGIs below $25k, 2.0% for AGIs $25k-50k, 3.2% for AGIs $50k-75k, 5.6% for AGIs $75k-100k, 7.7% for AGIs $100k-200k)
Earned income credit: $2,041 (reported on 20.1% of returns)
Here:
$2,041
State:
$1,959
(% of AGI for various income ranges: 5.2% for AGIs below $25k, 1.3% for AGIs $25k-50k)
Percentage of individuals using paid preparers for their 2012 taxes: 44.0%
Here:
44%
State:
48%
(% for various income ranges: 38.2% for AGIs below $25k, 46.2% for AGIs $25k-50k, 50.0% for AGIs $50k-75k, 45.5% for AGIs $75k-100k, 57.1% for AGIs $100k-200k)
Averages for the 2004 tax year for zip code 04256, filed in 2005:
Average Adjusted Gross Income (AGI) in 2004: $34,141 (Individual Income Tax Returns)
Here:
$34,141
State:
$42,606
Salary/wage: $32,581 (reported on 92.3% of returns)
Here:
$32,581
State:
$36,376
(% of AGI for various income ranges: 97.6% for AGIs below $10k, 84.1% for AGIs $10k-25k, 90.1% for AGIs $25k-50k, 92.6% for AGIs $50k-75k, 89.0% for AGIs $75k-100k, 67.8% for AGIs over 100k)
Taxable interest for individuals: $658 (reported on 34.0% of returns)
This zip code:
$658
Maine:
$1,367
(% of AGI for various income ranges: 2.6% for AGIs below $10k, 1.0% for AGIs $10k-25k, 0.9% for AGIs $25k-50k, 0.3% for AGIs $50k-75k, 0.1% for AGIs $75k-100k, 0.5% for AGIs over 100k)
Taxable dividends: $590 (reported on 10.2% of returns)
Here:
$590
State:
$3,533
(% of AGI for various income ranges: 2.4% for AGIs below $10k, 0.3% for AGIs $10k-25k, 0.2% for AGIs $25k-50k, 0.0% for AGIs $50k-75k, 0.0% for AGIs $75k-100k, 0.2% for AGIs over 100k)
Net capital gain/loss: +$3,857 (reported on 7.2% of returns)
Here:
+$3,857
State:
+$11,433
(% of AGI for various income ranges: 1.1% for AGIs below $10k, 0.0% for AGIs $10k-25k, 0.1% for AGIs $25k-50k, 0.6% for AGIs $50k-75k, 6.8% for AGIs over 100k)
Profit/loss from business: +$5,863 (reported on 12.8% of returns)
Here:
+$5,863
State:
+$10,755
(% of AGI for various income ranges: 8.1% for AGIs below $10k, 4.6% for AGIs $10k-25k, 2.8% for AGIs $25k-50k, 1.2% for AGIs $50k-75k, 0.9% for AGIs $75k-100k)
IRA payment deduction: $2,350 (reported on 2.9% of returns)
04256:
$2,350
Maine:
$3,014
Total itemized deductions: $13,437 (23% of AGI, reported on 25.0% of returns)
Here:
$13,437
State:
$18,231
Here:
23.3% of AGI
State:
21.7% of AGI
(% of AGI for various income ranges: 6.5% for AGIs $10k-25k, 7.7% for AGIs $25k-50k, 11.0% for AGIs $50k-75k, 14.8% for AGIs $75k-100k, 15.1% for AGIs over 100k)
Charity contributions deductions: $1,247 (2% of AGI, reported on 20.7% of returns)
Here:
$1,247
State:
$2,466
Here:
2.1% of AGI
State:
2.8% of AGI
(% of AGI for various income ranges: 0.4% for AGIs $10k-25k, 0.6% for AGIs $25k-50k, 0.7% for AGIs $50k-75k, 1.5% for AGIs $75k-100k, 1.2% for AGIs over 100k)
Total tax: $3,355 (reported on 75.9% of returns)
04256:
$3,355
State:
$6,047
(% of AGI for various income ranges: 3.1% for AGIs below $10k, 4.2% for AGIs $10k-25k, 6.2% for AGIs $25k-50k, 7.8% for AGIs $50k-75k, 10.0% for AGIs $75k-100k, 14.0% for AGIs over 100k)
Earned income credit: $1,735 (reported on 16.5% of returns)
Here:
$1,735
State:
$1,520
Percentage of individuals using paid preparers for their 2004 taxes: 49.6%
Here:
50%
State:
53%
(% for various income ranges: 34.8% for AGIs below $10k, 46.5% for AGIs $10k-25k, 54.1% for AGIs $25k-50k, 56.6% for AGIs $50k-75k, 49.2% for AGIs $75k-100k, 75.0% for AGIs over 100k)
Churches in zip code 04256 include: First Congregational Church (A), Church of the Nazarene (B), Advent Church (C), Pleasant Street Baptist Church (D). Display/hide their locations on the map
In group quarters: 51 (-1 institutionalized population)
Size of family households: 250 2-persons, 158 3-persons, 159 4-persons, 83 5-persons, 111 6-persons, 20 7-or-more-persons
Size of nonfamily households: 287 1-person, 85 2-persons
334 married couples with children.
384 single-parent households (62 men, 322 women).
96.6% of residents of 04256 zip code speak English at home.
0.6% of residents speak other Indo-European language at home (100% well).
2.4% of residents speak Asian or Pacific Island language at home (30% very well, 46% well, 24% not well).
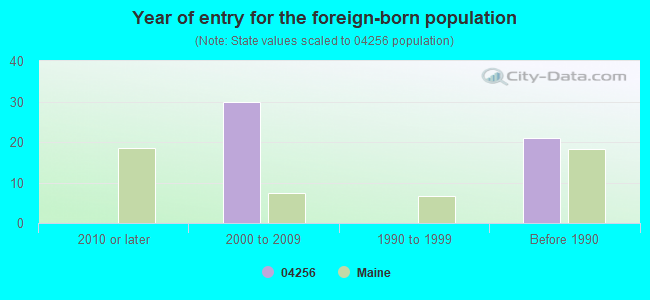
Foreign born population: 60 (1.9%) (82.7% of them are naturalized citizens)
This zip code:
1.9%
Whole state:
4.1%
18%Malaysia
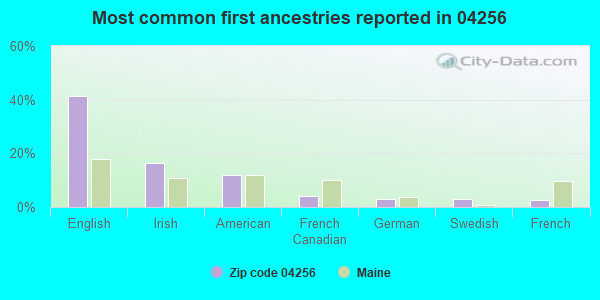
41%English
16%Irish
12%American
4%French Canadian
3%German
3%Swedish
3%French
Year of entry for the foreign-born population
02010 or later
302000 to 2009
01990 to 1999
21Before 1990
Facilities with environmental interests located in this zip code:
MECHANIC FALLS ME PUBLIC WORKS GARAGE (108 LEWISTON ST in MECHANIC FALLS, ME)
ENFORCEMENT/COMPLIANCE ACTIVITY (Integrated Compliance Information System) - ICIS-01-2003-9180, FORMAL ENFORCEMENT ACTION (Integrated Compliance Information System) - ICIS-01-2003-9180, FORMAL ENFORCEMENT ACTION
ELM STREET SCHOOL (129 ELM STREET in MECHANIC FALLS, ME)
(Geographic Names Information System) (National Center for Education Statistics) - STATE ID-26902 Organizations: MECHANIC FALLS SCHOOL DEPARTMENT (SCHOOL DISTRICT)
MAINE WOOD TREATERS INC (58 WALKER ROAD in MECHANIC FALLS, ME)
HAZARDOUS WASTE BIENNIAL REPORTER (Resource Conservation and Recovery Act (tracking hazardous waste)) Large Quantity Generators, more that 1000 kg of hazardous waste/month (Resource Conservation and Recovery Act (tracking hazardous waste)) TRI REPORTER (Tracking of toxic chemicals releasing facilities) Business SIC classification: WOOD PRESERVING Organizations: HAROLD I BUMBY (CONTACT/OPERATOR)
NEW ENGLAND TELE CO (PLEASANT ST in MECHANIC FALLS, ME)
(Resource Conservation and Recovery Act (tracking hazardous waste)) Organizations: NEW ENGLAND TELEPHONE CO BOSTON (CONTACT/OWNER)
CUMBERLAND FARMS #1825 (4 NORTH MAIN STREET in MECHANIC FALLS, ME)
Small Quantity Generators, between 100 kg and 1000 kg of hazardous waste/month (Resource Conservation and Recovery Act (tracking hazardous waste)) Organizations: CUMBERLAND FARMS INC (CONTACT/OPERATOR)
MECHANIC FALLS TRANSFER STATION (AUSTIN RD in MECHANIC FALLS, ME)
Conditionally Exempt Small Quantity Generators, less than 100 kg/month of hazardous waste (Resource Conservation and Recovery Act (tracking hazardous waste)) - notification TRANSPORTER (Resource Conservation and Recovery Act (tracking hazardous waste)) - notification Organizations: TOWN OF MECHANIC FALLS (CONTACT/OWNER)
MECHANIC FALLS TREATMENT PLANT (56 LEWISTON ST in MECHANIC FALLS, ME)
National Pollutant Discharge Elimination System MAJOR (Tracking pollutant discharge elimination systems) - permit Business SIC classification: SEWERAGE SYSTEMS Organizations: MECHANIC FALLS SANITARY DIST (CONTACT/OPERATOR)
Alternative names: MECHANIC FALLS SANITARY DIST
PARSONS JENNIFER (9 NORTH ST #9 in MECHANIC FALLS, ME)
ENFORCEMENT/COMPLIANCE ACTIVITY (Integrated Compliance Information System)
Housing units lacking complete plumbing facilities: 1.8% Housing units lacking complete kitchen facilities: 2.9%
84.8%Fuel oil, kerosene, etc.
6.9%Bottled, tank, or LP gas
4.2%Wood
2.3%Electricity
1.5%Utility gas
Population in 1990: 6,247.
Place of birth for U.S.-born residents:
This state: 2,361
Northeast: 273
Midwest: 38
South: 216
West: 139
59% of the 04256 zip code residents lived in the same house 5 years ago. Out of people who lived in different houses, 60% lived in this county. Out of people who lived in different counties, 50% lived in Maine.
92% of the 04256 zip code residents lived in the same house 1 year ago. Out of people who lived in different houses, 77% moved from this county. Out of people who lived in different houses, 10% moved from different county within same state.
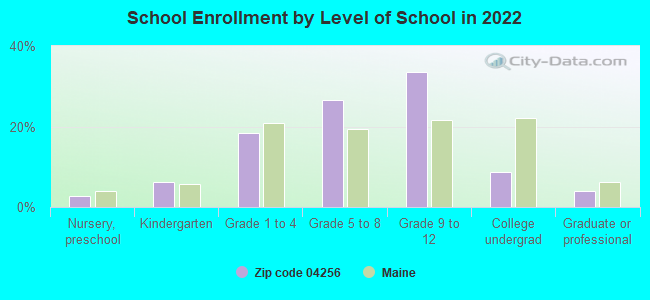
Private vs. public school enrollment:
Students in private schools in grades 1 to 8 (elementary and middle school): 42
Here:
8.3%
Maine:
12.7%
Students in private schools in grades 9 to 12 (high school): 15
Here:
4.1%
Maine:
12.6%
Students in private undergraduate colleges: 34
Here:
34.6%
Maine:
34.5%
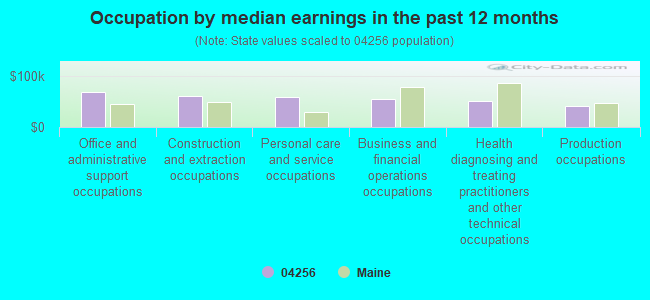
Occupation by median earnings in the past 12 months ($)
68,016Office and administrative support occupations
60,151Construction and extraction occupations
59,385Personal care and service occupations
55,777Business and financial operations occupations
51,945Health diagnosing and treating practitioners and other technical occupations
40,628Production occupations
Companies with federal contracts located in this zip code:
AUBURN MANUFACTURING INCORPORA (WALKER RD in MECHANIC FALLS, ME; small business) : $5,047,668 in 8 contractsfrom 2000 to 2005
Contracts for Textile Fabrics, Water Distillation Equipment, Marine and Industrial by Defense Logistics Agency, Navy Signed by year:2000: $1,572,953; 2001: $1,619,885; 2002: $0; 2003: $56,950; 2004: $1,793,158; 2005: $4,722; 2006: $0.
Biggest contracts:
$1,619,885 with Defense Logistics Agency for Textile Fabrics. Signed on 2001-02-20. Completion date: 2002-05-06.
$1,572,953, same as above.Signed on 2000-02-14. Completion date: 2001-05-14.
$1,351,958, same as above.Signed on 2004-11-10. Completion date: 2005-12-07.
$221,000 with Navy for Textile Fabrics. Signed on 2004-05-07. Completion date: 2004-06-04.
DOWN EAST MACHINE & ENGINEERIN (26 MAPLE ST in MECHANIC FALLS, ME; small business) : $7,100 in 4 contractsfrom 2001 to 2002
$2,836 with Navy for Other Housekeeping Services. Signed on 2002-04-02. Completion date: 2002-04-30.
$1,891, same as above.Signed on 2002-01-08. Completion date: 2001-12-12.
$1,428, same as above.Signed on 2002-07-03. Completion date: 2002-09-30.
$945, same as above.Signed on 2001-12-12. Completion date: 2001-12-12.
Top industries in this zip code by the number of employees in 2005:
Health Care and Social Assistance: Residential Mental Retardation Facilities (20-49 employees: 1 establishment, 10-19 employees: 1 establishment, 5-9 employees: 2 establishments, 1-4 employees: 1 establishment)
Accommodation and Food Services: Full-Service Restaurants (20-49: 1, 1-4: 1)
Health Care and Social Assistance: Vocational Rehabilitation Services (20-49: 1)
People in group quarters in 2010:
13 people in nursing facilities/skilled-nursing facilities
7 people in group homes intended for adults
People in group quarters in 2000:
17 people in homes for the mentally retarded
14 people in nursing homes
2 people in other noninstitutional group quarters
Fatal accident statistics in 2011:
Fatal accident count: 1
Vehicles involved in fatal accidents: 1
Fatal accidents caused by drunken drivers: 0
Fatalities: 2
Persons involved in fatal accidents: 4
Pedestrians involved in fatal accidents: 0
Fatal accident statistics in 2010:
Fatal accident count: 1
Vehicles involved in fatal accidents: 2
Fatal accidents caused by drunken drivers: 0
Fatalities: 1
Persons involved in fatal accidents: 2
Pedestrians involved in fatal accidents: 0
Home Mortgage Disclosure Act Aggregated Statistics For Year 2009 (Based on 2 partial tracts)
A) FHA, FSA/RHS & VA Home Purchase Loans
B) Conventional Home Purchase Loans
C) Refinancings
D) Home Improvement Loans
F) Non-occupant Loans on < 5 Family Dwellings (A B C & D)
G) Loans On Manufactured Home Dwelling (A B C & D)
Number
Average Value
Number
Average Value
Number
Average Value
Number
Average Value
Number
Average Value
Number
Average Value
LOANS ORIGINATED
11
$139,767
16
$113,180
84
$150,250
15
$51,122
4
$92,408
11
$59,493
APPLICATIONS APPROVED, NOT ACCEPTED
1
$81,060
2
$162,660
11
$148,365
2
$47,015
2
$105,650
1
$49,180
APPLICATIONS DENIED
2
$152,665
5
$109,268
24
$145,840
5
$26,480
2
$69,980
4
$102,270
APPLICATIONS WITHDRAWN
1
$152,930
1
$24,320
13
$179,745
1
$16,210
1
$41,610
1
$24,320
FILES CLOSED FOR INCOMPLETENESS
1
$77,280
1
$23,780
5
$134,668
0
$0
0
$0
1
$60,520
Aggregated Statistics For Year 2008 (Based on 2 partial tracts)
A) FHA, FSA/RHS & VA Home Purchase Loans
B) Conventional Home Purchase Loans
C) Refinancings
D) Home Improvement Loans
F) Non-occupant Loans on < 5 Family Dwellings (A B C & D)
G) Loans On Manufactured Home Dwelling (A B C & D)
Number
Average Value
Number
Average Value
Number
Average Value
Number
Average Value
Number
Average Value
Number
Average Value
LOANS ORIGINATED
5
$163,634
18
$161,129
63
$132,227
25
$51,878
5
$163,200
8
$60,322
APPLICATIONS APPROVED, NOT ACCEPTED
1
$82,680
4
$157,258
8
$153,339
2
$8,105
0
$0
2
$68,900
APPLICATIONS DENIED
0
$0
5
$115,862
39
$145,783
9
$43,952
2
$134,290
4
$51,068
APPLICATIONS WITHDRAWN
0
$0
1
$165,900
14
$145,136
5
$73,062
1
$143,750
1
$36,210
FILES CLOSED FOR INCOMPLETENESS
0
$0
0
$0
2
$160,230
1
$61,070
0
$0
1
$39,450
Aggregated Statistics For Year 2007 (Based on 2 partial tracts)
A) FHA, FSA/RHS & VA Home Purchase Loans
B) Conventional Home Purchase Loans
C) Refinancings
D) Home Improvement Loans
F) Non-occupant Loans on < 5 Family Dwellings (A B C & D)
G) Loans On Manufactured Home Dwelling (A B C & D)
Number
Average Value
Number
Average Value
Number
Average Value
Number
Average Value
Number
Average Value
Number
Average Value
LOANS ORIGINATED
3
$138,163
34
$145,224
52
$114,689
27
$42,731
1
$32,420
11
$45,639
APPLICATIONS APPROVED, NOT ACCEPTED
0
$0
6
$153,833
12
$127,129
2
$36,205
1
$83,760
2
$51,610
APPLICATIONS DENIED
1
$185,360
11
$114,123
46
$133,796
8
$40,462
3
$148,250
9
$75,356
APPLICATIONS WITHDRAWN
0
$0
2
$107,000
20
$115,376
1
$102,680
0
$0
1
$33,500
FILES CLOSED FOR INCOMPLETENESS
0
$0
0
$0
2
$129,155
1
$38,370
0
$0
0
$0
Aggregated Statistics For Year 2006 (Based on 2 partial tracts)
A) FHA, FSA/RHS & VA Home Purchase Loans
B) Conventional Home Purchase Loans
C) Refinancings
D) Home Improvement Loans
E) Loans on Dwellings For 5+ Families
F) Non-occupant Loans on < 5 Family Dwellings (A B C & D)
G) Loans On Manufactured Home Dwelling (A B C & D)
Number
Average Value
Number
Average Value
Number
Average Value
Number
Average Value
Number
Average Value
Number
Average Value
Number
Average Value
LOANS ORIGINATED
6
$171,217
55
$129,018
77
$117,934
26
$40,925
0
$0
8
$87,815
17
$52,228
APPLICATIONS APPROVED, NOT ACCEPTED
0
$0
5
$131,534
17
$115,518
3
$56,200
1
$121,590
1
$136,180
2
$70,250
APPLICATIONS DENIED
1
$100,510
8
$143,476
56
$132,765
20
$58,714
1
$81,600
2
$84,575
8
$63,835
APPLICATIONS WITHDRAWN
2
$122,130
5
$158,554
45
$123,487
3
$23,957
0
$0
3
$108,440
1
$99,430
FILES CLOSED FOR INCOMPLETENESS
1
$74,580
2
$142,125
6
$129,967
0
$0
0
$0
1
$61,610
0
$0
Aggregated Statistics For Year 2005 (Based on 2 partial tracts)
A) FHA, FSA/RHS & VA Home Purchase Loans
B) Conventional Home Purchase Loans
C) Refinancings
D) Home Improvement Loans
F) Non-occupant Loans on < 5 Family Dwellings (A B C & D)
G) Loans On Manufactured Home Dwelling (A B C & D)
Number
Average Value
Number
Average Value
Number
Average Value
Number
Average Value
Number
Average Value
Number
Average Value
LOANS ORIGINATED
4
$126,452
72
$122,288
97
$110,737
20
$49,960
8
$111,862
22
$69,098
APPLICATIONS APPROVED, NOT ACCEPTED
1
$88,630
5
$132,398
10
$102,568
3
$66,110
1
$123,750
2
$80,520
APPLICATIONS DENIED
0
$0
12
$87,094
48
$134,897
14
$59,907
2
$32,425
9
$59,384
APPLICATIONS WITHDRAWN
0
$0
6
$151,852
43
$114,954
5
$117,374
2
$68,090
1
$32,420
FILES CLOSED FOR INCOMPLETENESS
0
$0
1
$12,430
5
$182,980
1
$51,880
0
$0
0
$0
Aggregated Statistics For Year 2004 (Based on 2 partial tracts)
A) FHA, FSA/RHS & VA Home Purchase Loans
B) Conventional Home Purchase Loans
C) Refinancings
D) Home Improvement Loans
F) Non-occupant Loans on < 5 Family Dwellings (A B C & D)
G) Loans On Manufactured Home Dwelling (A B C & D)
Number
Average Value
Number
Average Value
Number
Average Value
Number
Average Value
Number
Average Value
Number
Average Value
LOANS ORIGINATED
10
$115,105
58
$117,733
96
$107,889
18
$43,082
4
$97,542
18
$66,649
APPLICATIONS APPROVED, NOT ACCEPTED
0
$0
6
$145,187
17
$127,026
2
$11,620
1
$35,670
2
$10,270
APPLICATIONS DENIED
0
$0
12
$95,516
53
$99,862
9
$48,036
4
$85,382
9
$64,548
APPLICATIONS WITHDRAWN
0
$0
5
$138,018
48
$101,359
2
$45,935
2
$78,630
1
$77,820
FILES CLOSED FOR INCOMPLETENESS
0
$0
1
$154,550
10
$102,298
2
$54,580
0
$0
1
$50,800
Aggregated Statistics For Year 2003 (Based on 2 partial tracts)
A) FHA, FSA/RHS & VA Home Purchase Loans
B) Conventional Home Purchase Loans
C) Refinancings
D) Home Improvement Loans
E) Loans on Dwellings For 5+ Families
F) Non-occupant Loans on < 5 Family Dwellings (A B C & D)
Number
Average Value
Number
Average Value
Number
Average Value
Number
Average Value
Number
Average Value
Number
Average Value
LOANS ORIGINATED
1
$92,410
38
$108,137
146
$92,753
10
$48,582
1
$68,630
4
$91,598
APPLICATIONS APPROVED, NOT ACCEPTED
0
$0
5
$90,572
12
$113,304
2
$16,480
0
$0
1
$69,710
APPLICATIONS DENIED
1
$109,160
11
$51,780
36
$80,069
11
$13,854
0
$0
2
$53,770
APPLICATIONS WITHDRAWN
0
$0
3
$87,543
32
$117,706
2
$24,590
0
$0
1
$48,640
FILES CLOSED FOR INCOMPLETENESS
0
$0
1
$54,040
3
$76,737
1
$13,510
0
$0
0
$0
Aggregated Statistics For Year 2002 (Based on 2 partial tracts)
A) FHA, FSA/RHS & VA Home Purchase Loans
B) Conventional Home Purchase Loans
C) Refinancings
D) Home Improvement Loans
F) Non-occupant Loans on < 5 Family Dwellings (A B C & D)
Number
Average Value
Number
Average Value
Number
Average Value
Number
Average Value
Number
Average Value
LOANS ORIGINATED
10
$85,870
33
$100,662
96
$95,972
8
$25,534
5
$74,792
APPLICATIONS APPROVED, NOT ACCEPTED
0
$0
3
$90,967
8
$94,098
0
$0
1
$23,780
APPLICATIONS DENIED
1
$21,620
8
$75,251
32
$86,802
6
$23,958
2
$65,390
APPLICATIONS WITHDRAWN
1
$79,980
4
$85,248
22
$91,033
1
$16,210
0
$0
FILES CLOSED FOR INCOMPLETENESS
0
$0
0
$0
2
$81,330
0
$0
0
$0
Aggregated Statistics For Year 2001 (Based on 2 partial tracts)
A) FHA, FSA/RHS & VA Home Purchase Loans
B) Conventional Home Purchase Loans
C) Refinancings
D) Home Improvement Loans
F) Non-occupant Loans on < 5 Family Dwellings (A B C & D)
Number
Average Value
Number
Average Value
Number
Average Value
Number
Average Value
Number
Average Value
LOANS ORIGINATED
7
$79,824
30
$109,575
70
$84,287
11
$9,236
3
$57,643
APPLICATIONS APPROVED, NOT ACCEPTED
0
$0
5
$67,766
6
$89,977
1
$15,670
1
$48,100
APPLICATIONS DENIED
1
$53,500
15
$51,518
32
$69,070
11
$20,535
1
$38,910
APPLICATIONS WITHDRAWN
1
$32,420
1
$43,230
22
$65,536
2
$21,615
1
$45,390
FILES CLOSED FOR INCOMPLETENESS
0
$0
0
$0
3
$88,267
0
$0
0
$0
Aggregated Statistics For Year 2000 (Based on 2 partial tracts)
A) FHA, FSA/RHS & VA Home Purchase Loans
B) Conventional Home Purchase Loans
C) Refinancings
D) Home Improvement Loans
F) Non-occupant Loans on < 5 Family Dwellings (A B C & D)
Number
Average Value
Number
Average Value
Number
Average Value
Number
Average Value
Number
Average Value
LOANS ORIGINATED
8
$67,752
35
$83,901
22
$54,335
21
$14,694
2
$24,860
APPLICATIONS APPROVED, NOT ACCEPTED
0
$0
4
$93,895
3
$38,007
4
$19,860
1
$9,190
APPLICATIONS DENIED
2
$45,665
18
$54,581
19
$46,162
8
$15,131
0
$0
APPLICATIONS WITHDRAWN
1
$70,790
2
$82,410
10
$59,768
0
$0
0
$0
FILES CLOSED FOR INCOMPLETENESS
0
$0
0
$0
4
$74,710
1
$11,350
0
$0
Aggregated Statistics For Year 1999 (Based on 1 partial tract)
A) FHA, FSA/RHS & VA Home Purchase Loans
B) Conventional Home Purchase Loans
C) Refinancings
D) Home Improvement Loans
F) Non-occupant Loans on < 5 Family Dwellings (A B C & D)
Detailed PMIC statistics for the following Tracts:0415.00
2003 - 2018 National Fire Incident Reporting System (NFIRS) incidents
Based on the data from the years 2003 - 2018 the average number of fire incidents per year is 12. The highest number of reported fires - 26 took place in 2018, and the least - 0 in 2006. The data has an increasing trend.
When looking into fire subcategories, the most reports belonged to: Structure Fires (51.3%), and Outside Fires (32.8%).
Fire incident types reported to NFIRS in Zip Code 04256


 Nearest zip codes: 04274, 04258, 04238, 04270, 04210, 04281.


 Based on the data from the years 2003 - 2018 the average number of fire incidents per year is 12. The highest number of reported fires - 26 took place in 2018, and the least - 0 in 2006. The data has an increasing trend.
 When looking into fire subcategories, the most reports belonged to: Structure Fires (51.3%), and Outside Fires (32.8%).