Estimated zip code population in 2022: 881 Zip code population in 2010: 779 Zip code population in 2000: 969
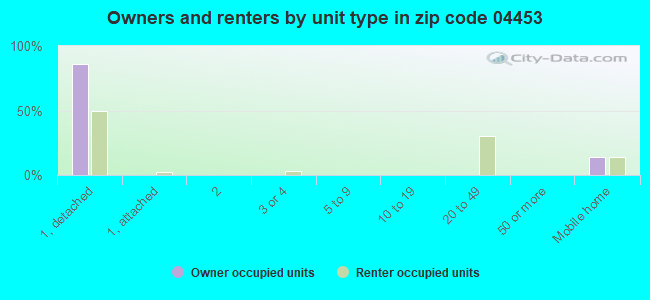
Houses and condos: 435 Renter-occupied apartments: 93
% of renters here:
27%
State:
26%
March 2022 cost of living index in zip code 04453: 85.6 (less than average, U.S. average is 100)
Land area: 67.6 sq. mi. Water area: 0.3 sq. mi.
Population density: 13 people per square mile
(very low).
OSM Map
Google Map
MSN Map
OSM Map
General Map
Google Map
MSN Map
OSM Map
Google Map
MSN Map
OSM Map
Google Map
MSN Map
Please wait while loading the map...
Real estate property taxes paid for housing units in 2022:
This zip code:
0.9% ($1,180)
Maine:
1.0% ($2,785)
Median real estate property taxes paid for housing units with mortgages in 2022: $1,369 (0.8%) Median real estate property taxes paid for housing units with no mortgage in 2022: $836 (0.7%)
Business Search- 14 Million verified businesses
Males: 468
(53.1%)
Females: 413
(46.9%)
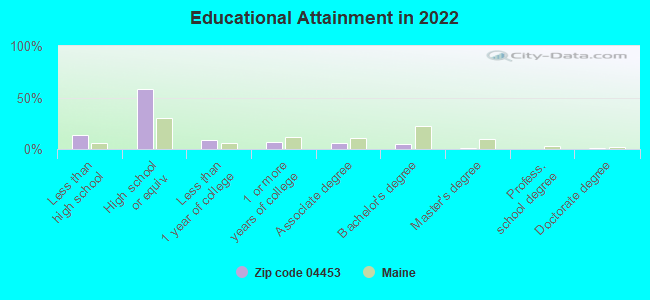
For population 25 years and over in 04453:
High school or higher: 81.7%
Bachelor's degree or higher: 6.2%
Graduate or professional degree: 1.6%
Unemployed: 6.6%
Mean travel time to work (commute): 36.6 minutes
For population 15 years and over in 04453:
Never married: 27.2%
Now married: 51.3%
Separated: 1.3%
Widowed: 5.5%
Divorced: 14.7%
Zip code 04453 compared to state average:
Median household income below state average.
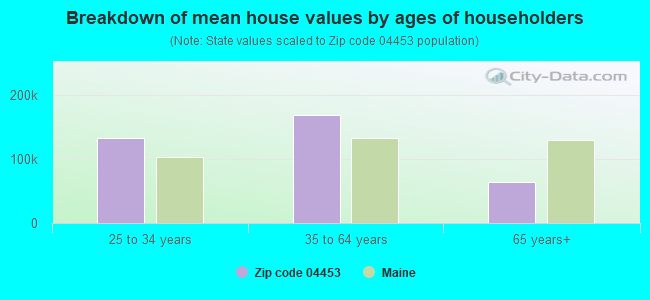
Median house value significantly below state average.
Unemployed percentage above state average.
Black race population percentage significantly below state average.
Hispanic race population percentage significantly below state average.
Foreign-born population percentage significantly below state average.
Length of stay since moving in significantly above state average.
Number of college students below state average.
Percentage of population with a bachelor's degree or higher significantly below state average.
Averages for the 2020 tax year for zip code 04453, filed in 2021:
Average Adjusted Gross Income (AGI) in 2020: $37,469 (Individual Income Tax Returns)
Here:
$37,469
State:
$68,227
Salary/wage: $35,226 (reported on 77.1% of returns)
Here:
$35,226
State:
$55,127
(% of AGI for various income ranges: 1092.0% for AGIs below $25k, 3218.0% for AGIs $25k-50k, 5292.5% for AGIs $50k-75k, 10280.0% for AGIs $75k-100k)
Taxable interest for individuals: $129 (reported on 20.0% of returns)
This zip code:
$129
Maine:
$1,162
(% of AGI for various income ranges: 7.0% for AGIs below $25k, 5.0% for AGIs $50k-75k)
Profit/loss from business: +$3,920 (reported on 14.3% of returns)
Here:
+$3,920
State:
+$15,095
(% of AGI for various income ranges: 90.0% for AGIs below $25k, 106.0% for AGIs $25k-50k)
Earned income credit: $2,362 (reported on 22.9% of returns)
Here:
$2,362
State:
$1,960
(% of AGI for various income ranges: 125.0% for AGIs below $25k, 64.0% for AGIs $25k-50k)
Percentage of individuals using paid preparers for their 2020 taxes: 97.1%
Here:
97%
State:
92%
(% for various income ranges: 92.9% for AGIs below $25k, 100.0% for AGIs $25k-50k, 100.0% for AGIs $50k-75k, 100.0% for AGIs $75k-100k)
Averages for the 2012 tax year for zip code 04453, filed in 2013:
Average Adjusted Gross Income (AGI) in 2012: $35,179 (Individual Income Tax Returns)
Here:
$35,179
State:
$52,375
Salary/wage: $31,142 (reported on 85.7% of returns)
Here:
$31,142
State:
$43,415
(% of AGI for various income ranges: 73.5% for AGIs below $25k, 81.4% for AGIs $25k-50k, 79.8% for AGIs $50k-75k, 67.2% for AGIs $75k-100k)
Taxable interest for individuals: $360 (reported on 17.9% of returns)
This zip code:
$360
Maine:
$1,221
Profit/loss from business: +$5,600 (reported on 14.3% of returns)
Here:
+$5,600
State:
+$12,144
Total itemized deductions: $15,525 (22% of AGI, reported on 14.3% of returns)
Here:
$15,525
State:
$21,859
Here:
21.8% of AGI
State:
20.9% of AGI
Taxes paid: $5,800 (reported on 14.3% of returns)
04453:
$5,800
State:
$9,996
Earned income credit: $1,986 (reported on 25.0% of returns)
Here:
$1,986
State:
$1,959
(% of AGI for various income ranges: 9.3% for AGIs below $25k)
Percentage of individuals using paid preparers for their 2012 taxes: 50.0%
Here:
50%
State:
48%
(% for various income ranges: 41.7% for AGIs below $25k, 50.0% for AGIs $25k-50k, 100.0% for AGIs $50k-75k)
Averages for the 2004 tax year for zip code 04453, filed in 2005:
Average Adjusted Gross Income (AGI) in 2004: $30,122 (Individual Income Tax Returns)
Here:
$30,122
State:
$42,606
Salary/wage: $27,884 (reported on 86.2% of returns)
Here:
$27,884
State:
$36,376
(% of AGI for various income ranges: 78.9% for AGIs below $10k, 77.6% for AGIs $10k-25k, 84.8% for AGIs $25k-50k, 87.5% for AGIs $50k-75k, 62.0% for AGIs $75k-100k)
Taxable interest for individuals: $429 (reported on 28.5% of returns)
This zip code:
$429
Maine:
$1,367
(% of AGI for various income ranges: 0.3% for AGIs $10k-25k, 1.0% for AGIs $25k-50k, 0.1% for AGIs $50k-75k, 0.0% for AGIs $75k-100k)
Taxable dividends: $50 (reported on 6.3% of returns)
Here:
$50
State:
$3,533
Profit/loss from business: +$6,474 (reported on 11.9% of returns)
Here:
+$6,474
State:
+$10,755
Total itemized deductions: $13,226 (21% of AGI, reported on 16.6% of returns)
Here:
$13,226
State:
$18,231
Here:
21.0% of AGI
State:
21.7% of AGI
Charity contributions deductions: $1,206 (2% of AGI, reported on 10.7% of returns)
Here:
$1,206
State:
$2,466
Here:
2.2% of AGI
State:
2.8% of AGI
Total tax: $3,281 (reported on 65.8% of returns)
04453:
$3,281
State:
$6,047
(% of AGI for various income ranges: 1.9% for AGIs below $10k, 3.9% for AGIs $10k-25k, 5.8% for AGIs $25k-50k, 8.7% for AGIs $50k-75k, 10.9% for AGIs $75k-100k)
Earned income credit: $1,919 (reported on 27.0% of returns)
Here:
$1,919
State:
$1,520
Percentage of individuals using paid preparers for their 2004 taxes: 55.2%
Here:
55%
State:
53%
(% for various income ranges: 41.4% for AGIs below $10k, 53.9% for AGIs $10k-25k, 62.7% for AGIs $25k-50k, 58.7% for AGIs $50k-75k, 72.2% for AGIs $75k-100k)
Household received Food Stamps/SNAP in the past 12 months: 119 Household did not receive Food Stamps/SNAP in the past 12 months: 225
Women who had a birth in the past 12 months: 14 (14 now married, 0 unmarried) Women who did not have a birth in the past 12 months: 121 (52 now married, 68 unmarried)
Housing units in zip code 04453 with a mortgage: 109 (10 second mortgage, 10 both second mortgage and home equity loan) Houses without a mortgage: 9
Median monthly owner costs for units with a mortgage: $983 Median monthly owner costs for units without a mortgage: $367
Residents with income below the poverty level in 2022:
This zip code:
23.4%
Whole state:
10.8%
Residents with income below 50% of the poverty level in 2022:
This zip code:
15.3%
Whole state:
5.8%
Median number of rooms in houses and condos:
Here:
5.6
State:
6.1
Median number of rooms in apartments:
Here:
3.7
State:
4.0
Notable locations in this zip code not listed on our city pages
Size of family households: 102 2-persons, 61 3-persons, 22 4-persons, 6 5-persons, 4 6-persons, 20 7-or-more-persons
Size of nonfamily households: 105 1-person, 27 2-persons
143 married couples with children.
35 single-parent households (12 men, 23 women).
97.6% of residents of 04453 zip code speak English at home.
1.4% of residents speak Spanish at home (100% very well).
0.6% of residents speak other Indo-European language at home (100% very well).
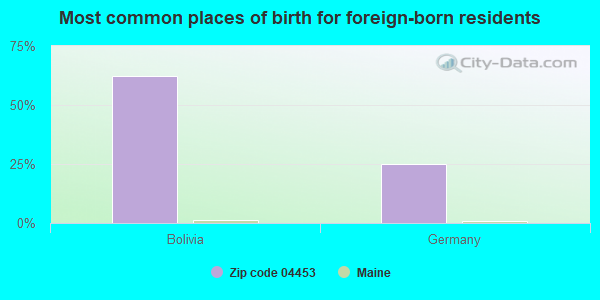
Foreign born population: 8 (1.0%) (100.0% of them are naturalized citizens)
This zip code:
1.0%
Whole state:
4.1%
62%Bolivia
25%Germany
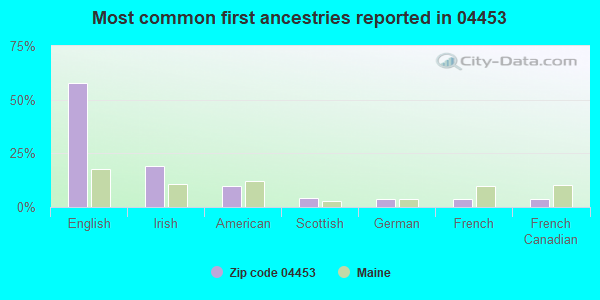
58%English
19%Irish
10%American
4%Scottish
4%German
4%French
4%French Canadian
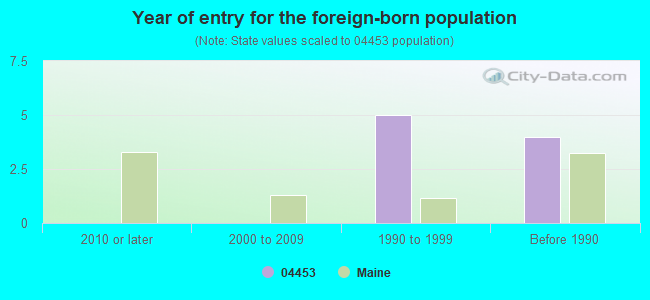
Year of entry for the foreign-born population
02010 or later
02000 to 2009
51990 to 1999
4Before 1990
Facilities with environmental interests located in this zip code:
MARION C COOK SCHOOL (22 HOWLAND ROAD in LAGRANGE, ME)
(National Center for Education Statistics) - STATE ID-22502 Organizations: MSAD 41 MILO (SCHOOL DISTRICT)
ME DEPTMENT OF TRANSPORTATION MAINTENANCE LOT (HOWLAND ROAD RTE 6/155 in LAGRANGE, ME)
Conditionally Exempt Small Quantity Generators, less than 100 kg/month of hazardous waste (Resource Conservation and Recovery Act (tracking hazardous waste)) - notification Organizations: MAINE DEPT OF TRANSPORTATION (CONTACT/OWNER)
Alternative names: MDOT LAGRANGE MAINT FAC, ME DEPT OF TRANSP TRAFFIC ENGR
Housing units lacking complete plumbing facilities: 3.9% Housing units lacking complete kitchen facilities: 5.2%
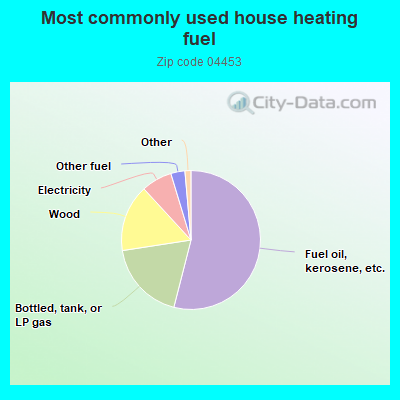
54.3%Fuel oil, kerosene, etc.
18.7%Bottled, tank, or LP gas
15.7%Wood
7.2%Electricity
3.3%Other fuel
0.9%Utility gas
0.6%No fuel used
Population in 1990: 707. Population change in the 1990s: +262 (+37.1%).
Place of birth for U.S.-born residents:
This state: 633
Northeast: 121
Midwest: 34
South: 58
West: 12
59% of the 04453 zip code residents lived in the same house 5 years ago. Out of people who lived in different houses, 60% lived in this county. Out of people who lived in different counties, 50% lived in Maine.
94% of the 04453 zip code residents lived in the same house 1 year ago. Out of people who lived in different houses, 38% moved from this county. Out of people who lived in different houses, 50% moved from different county within same state. Out of people who lived in different houses, 8% moved from different state.
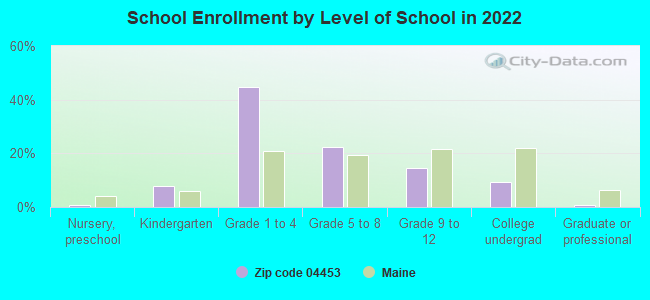
Private vs. public school enrollment:
Students in private schools in grades 1 to 8 (elementary and middle school): 58
Here:
61.1%
Maine:
12.7%
Students in private schools in grades 9 to 12 (high school):
Here:
0.0%
Maine:
12.6%
Students in private undergraduate colleges:
Here:
0.0%
Maine:
34.5%
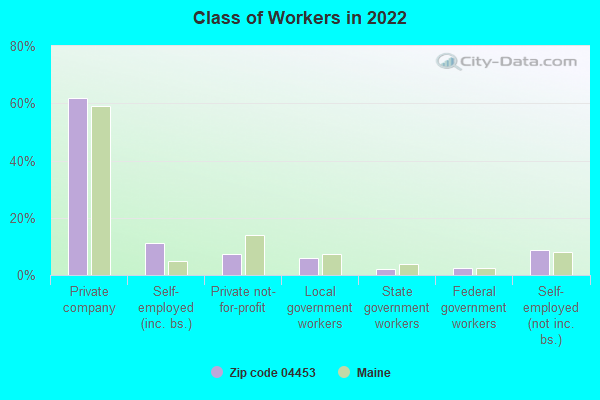
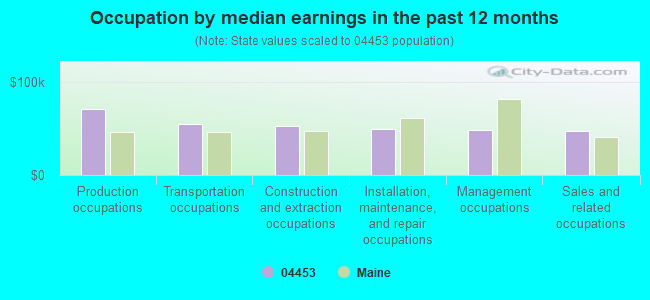
Occupation by median earnings in the past 12 months ($)
70,259Production occupations
54,699Transportation occupations
52,317Construction and extraction occupations
49,701Installation, maintenance, and repair occupations
48,640Management occupations
46,705Sales and related occupations
Top industries in this zip code by the number of employees in 2005:
Construction: Site Preparation Contractors (1-4 employees: 1 establishment)
Construction: Electrical Contractors (1-4: 1)
Wholesale Trade: Wholesale Trade Agents and Brokers (1-4: 1)
Information: Internet Service Providers (1-4: 1)
Professional, Scientific, and Technical Services: Other Accounting Services (1-4: 1)
Fatal accident statistics in 2011:
Fatal accident count: 1
Vehicles involved in fatal accidents: 1
Fatal accidents caused by drunken drivers: 1
Fatalities: 1
Persons involved in fatal accidents: 1
Pedestrians involved in fatal accidents: 0
Home Mortgage Disclosure Act Aggregated Statistics For Year 2009 (Based on 4 partial tracts)
A) FHA, FSA/RHS & VA Home Purchase Loans
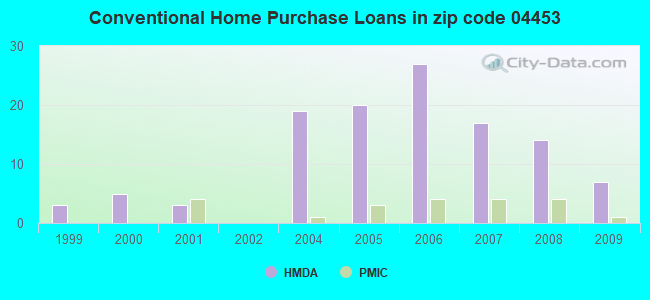
B) Conventional Home Purchase Loans
C) Refinancings
D) Home Improvement Loans
F) Non-occupant Loans on < 5 Family Dwellings (A B C & D)
G) Loans On Manufactured Home Dwelling (A B C & D)
Number
Average Value
Number
Average Value
Number
Average Value
Number
Average Value
Number
Average Value
Number
Average Value
LOANS ORIGINATED
9
$121,077
7
$59,011
28
$99,458
9
$52,258
4
$48,588
4
$60,995
APPLICATIONS APPROVED, NOT ACCEPTED
1
$229,640
0
$0
7
$118,631
0
$0
0
$0
1
$83,890
APPLICATIONS DENIED
2
$110,625
1
$94,730
16
$128,889
5
$76,078
3
$136,383
3
$48,237
APPLICATIONS WITHDRAWN
0
$0
0
$0
3
$180,727
0
$0
0
$0
1
$134,220
FILES CLOSED FOR INCOMPLETENESS
0
$0
0
$0
5
$116,920
0
$0
0
$0
0
$0
Aggregated Statistics For Year 2008 (Based on 4 partial tracts)
A) FHA, FSA/RHS & VA Home Purchase Loans
B) Conventional Home Purchase Loans
C) Refinancings
D) Home Improvement Loans
E) Loans on Dwellings For 5+ Families
F) Non-occupant Loans on < 5 Family Dwellings (A B C & D)
G) Loans On Manufactured Home Dwelling (A B C & D)
Number
Average Value
Number
Average Value
Number
Average Value
Number
Average Value
Number
Average Value
Number
Average Value
Number
Average Value
LOANS ORIGINATED
4
$92,890
14
$113,439
30
$107,019
4
$56,148
1
$159,390
1
$65,550
7
$79,244
APPLICATIONS APPROVED, NOT ACCEPTED
0
$0
3
$54,527
7
$87,360
1
$38,450
0
$0
3
$37,283
3
$30,060
APPLICATIONS DENIED
1
$83,890
4
$79,020
13
$102,262
10
$12,480
0
$0
1
$83,890
5
$39,306
APPLICATIONS WITHDRAWN
0
$0
1
$157,290
9
$83,447
0
$0
0
$0
0
$0
1
$38,800
FILES CLOSED FOR INCOMPLETENESS
0
$0
0
$0
1
$104,860
0
$0
0
$0
0
$0
0
$0
Aggregated Statistics For Year 2007 (Based on 4 partial tracts)
A) FHA, FSA/RHS & VA Home Purchase Loans
B) Conventional Home Purchase Loans
C) Refinancings
D) Home Improvement Loans
F) Non-occupant Loans on < 5 Family Dwellings (A B C & D)
G) Loans On Manufactured Home Dwelling (A B C & D)
Number
Average Value
Number
Average Value
Number
Average Value
Number
Average Value
Number
Average Value
Number
Average Value
LOANS ORIGINATED
4
$59,358
17
$124,738
33
$104,748
14
$46,646
3
$64,410
6
$28,007
APPLICATIONS APPROVED, NOT ACCEPTED
3
$96,883
2
$88,005
11
$109,413
1
$47,200
0
$0
1
$43,260
APPLICATIONS DENIED
1
$177,400
5
$96,654
36
$87,872
6
$74,135
1
$75,160
6
$51,310
APPLICATIONS WITHDRAWN
1
$131,070
0
$0
2
$103,570
1
$54,630
0
$0
0
$0
FILES CLOSED FOR INCOMPLETENESS
0
$0
0
$0
5
$67,462
0
$0
0
$0
0
$0
Aggregated Statistics For Year 2006 (Based on 4 partial tracts)
A) FHA, FSA/RHS & VA Home Purchase Loans
B) Conventional Home Purchase Loans
C) Refinancings
D) Home Improvement Loans
F) Non-occupant Loans on < 5 Family Dwellings (A B C & D)
G) Loans On Manufactured Home Dwelling (A B C & D)
Number
Average Value
Number
Average Value
Number
Average Value
Number
Average Value
Number
Average Value
Number
Average Value
LOANS ORIGINATED
3
$102,883
27
$101,351
45
$91,202
17
$38,805
9
$103,280
6
$53,828
APPLICATIONS APPROVED, NOT ACCEPTED
0
$0
2
$59,820
4
$102,380
3
$71,160
0
$0
0
$0
APPLICATIONS DENIED
0
$0
6
$64,345
39
$84,972
11
$38,792
0
$0
4
$41,922
APPLICATIONS WITHDRAWN
0
$0
1
$148,900
19
$85,188
1
$92,640
1
$31,460
1
$34,600
FILES CLOSED FOR INCOMPLETENESS
0
$0
0
$0
5
$146,130
0
$0
0
$0
0
$0
Aggregated Statistics For Year 2005 (Based on 4 partial tracts)
A) FHA, FSA/RHS & VA Home Purchase Loans
B) Conventional Home Purchase Loans
C) Refinancings
D) Home Improvement Loans
E) Loans on Dwellings For 5+ Families
F) Non-occupant Loans on < 5 Family Dwellings (A B C & D)
G) Loans On Manufactured Home Dwelling (A B C & D)
Number
Average Value
Number
Average Value
Number
Average Value
Number
Average Value
Number
Average Value
Number
Average Value
Number
Average Value
LOANS ORIGINATED
3
$94,537
20
$85,002
56
$80,844
15
$27,843
0
$0
7
$85,353
12
$46,541
APPLICATIONS APPROVED, NOT ACCEPTED
0
$0
6
$74,907
6
$105,352
1
$25,430
0
$0
1
$76,550
0
$0
APPLICATIONS DENIED
0
$0
7
$89,959
39
$91,829
10
$35,673
0
$0
3
$72,940
4
$20,448
APPLICATIONS WITHDRAWN
0
$0
6
$70,478
17
$100,354
2
$120,990
1
$190,850
0
$0
1
$67,110
FILES CLOSED FOR INCOMPLETENESS
0
$0
0
$0
2
$130,010
0
$0
0
$0
0
$0
0
$0
Aggregated Statistics For Year 2004 (Based on 4 partial tracts)
A) FHA, FSA/RHS & VA Home Purchase Loans
B) Conventional Home Purchase Loans
C) Refinancings
D) Home Improvement Loans
F) Non-occupant Loans on < 5 Family Dwellings (A B C & D)
G) Loans On Manufactured Home Dwelling (A B C & D)
Number
Average Value
Number
Average Value
Number
Average Value
Number
Average Value
Number
Average Value
Number
Average Value
LOANS ORIGINATED
3
$104,780
19
$103,188
53
$83,401
19
$29,445
6
$63,050
17
$49,182
APPLICATIONS APPROVED, NOT ACCEPTED
0
$0
1
$143,230
7
$115,363
0
$0
0
$0
0
$0
APPLICATIONS DENIED
1
$108,010
7
$52,070
35
$78,347
11
$31,539
3
$75,417
11
$50,778
APPLICATIONS WITHDRAWN
0
$0
1
$81,970
38
$79,561
1
$59,860
1
$11,530
6
$90,528
FILES CLOSED FOR INCOMPLETENESS
0
$0
0
$0
1
$74,730
2
$41,945
0
$0
0
$0
Aggregated Statistics For Year 2002 (Based on 2 partial tracts)
B) Conventional Home Purchase Loans
C) Refinancings
F) Non-occupant Loans on < 5 Family Dwellings (A B C & D)
Number
Average Value
Number
Average Value
Number
Average Value
LOANS ORIGINATED
0
$0
4
$63,440
1
$34,600
APPLICATIONS APPROVED, NOT ACCEPTED
0
$0
0
$0
0
$0
APPLICATIONS DENIED
1
$63,960
2
$52,430
0
$0
APPLICATIONS WITHDRAWN
0
$0
1
$83,890
0
$0
FILES CLOSED FOR INCOMPLETENESS
0
$0
0
$0
0
$0
Aggregated Statistics For Year 2001 (Based on 2 partial tracts)
B) Conventional Home Purchase Loans
C) Refinancings
D) Home Improvement Loans
Number
Average Value
Number
Average Value
Number
Average Value
LOANS ORIGINATED
3
$56,973
7
$50,633
1
$5,240
APPLICATIONS APPROVED, NOT ACCEPTED
0
$0
1
$62,920
0
$0
APPLICATIONS DENIED
0
$0
1
$78,640
0
$0
APPLICATIONS WITHDRAWN
0
$0
0
$0
0
$0
FILES CLOSED FOR INCOMPLETENESS
0
$0
0
$0
0
$0
Aggregated Statistics For Year 2000 (Based on 2 partial tracts)
A) FHA, FSA/RHS & VA Home Purchase Loans
B) Conventional Home Purchase Loans
C) Refinancings
D) Home Improvement Loans
F) Non-occupant Loans on < 5 Family Dwellings (A B C & D)
Number
Average Value
Number
Average Value
Number
Average Value
Number
Average Value
Number
Average Value
LOANS ORIGINATED
1
$78,640
5
$23,698
17
$34,974
8
$22,939
1
$20,970
APPLICATIONS APPROVED, NOT ACCEPTED
0
$0
0
$0
4
$46,400
1
$34,600
0
$0
APPLICATIONS DENIED
0
$0
1
$23,070
0
$0
3
$18,873
0
$0
APPLICATIONS WITHDRAWN
0
$0
0
$0
0
$0
0
$0
0
$0
FILES CLOSED FOR INCOMPLETENESS
0
$0
0
$0
0
$0
0
$0
0
$0
Aggregated Statistics For Year 1999 (Based on 1 partial tract)


 Nearest zip codes: 04468, 04448, 04410, 04475, 04463, 04449.