Estimated zip code population in 2022: 824 Zip code population in 2010: 923 Zip code population in 2000: 905
Houses and condos: 554 Renter-occupied apartments: 43
% of renters here:
14%
State:
26%
March 2022 cost of living index in zip code 04455: 87.4 (less than average, U.S. average is 100)
Land area: 84.2 sq. mi. Water area: 2.3 sq. mi.
Population density: 10 people per square mile
(very low).
OSM Map
Google Map
MSN Map
OSM Map
General Map
Google Map
MSN Map
OSM Map
Google Map
MSN Map
OSM Map
Google Map
MSN Map
Please wait while loading the map...
Real estate property taxes paid for housing units in 2022:
This zip code:
0.8% ($1,410)
Maine:
1.0% ($2,785)
Median real estate property taxes paid for housing units with mortgages in 2022: $1,439 (0.8%) Median real estate property taxes paid for housing units with no mortgage in 2022: $1,384 (0.8%)
Business Search- 14 Million verified businesses
Males: 399
(48.4%)
Females: 425
(51.6%)
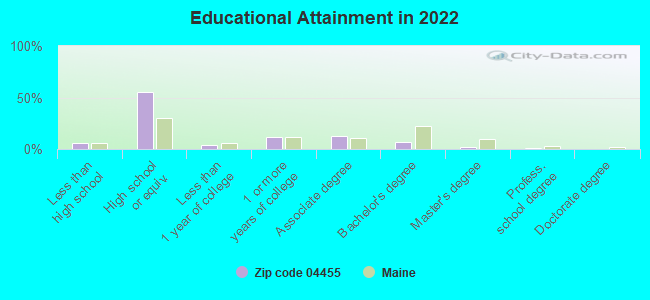
For population 25 years and over in 04455:
High school or higher: 91.5%
Bachelor's degree or higher: 9.8%
Graduate or professional degree: 2.9%
Unemployed: 0.8%
Mean travel time to work (commute): 34.8 minutes
For population 15 years and over in 04455:
Never married: 24.8%
Now married: 59.1%
Separated: 0.5%
Widowed: 4.2%
Divorced: 11.5%
Zip code 04455 compared to state average:
Median house value below state average.
Unemployed percentage significantly below state average.
Hispanic race population percentage significantly below state average.
Foreign-born population percentage below state average.
Renting percentage below state average.
Length of stay since moving in significantly above state average.
Percentage of population with a bachelor's degree or higher significantly below state average.
Averages for the 2020 tax year for zip code 04455, filed in 2021:
Average Adjusted Gross Income (AGI) in 2020: $47,798 (Individual Income Tax Returns)
Here:
$47,798
State:
$68,227
Salary/wage: $41,609 (reported on 80.5% of returns)
Here:
$41,609
State:
$55,127
(% of AGI for various income ranges: 993.6% for AGIs below $25k, 3055.0% for AGIs $25k-50k, 6525.0% for AGIs $50k-75k, 5584.0% for AGIs $75k-100k)
Taxable interest for individuals: $171 (reported on 34.1% of returns)
This zip code:
$171
Maine:
$1,162
(% of AGI for various income ranges: 3.6% for AGIs below $25k, 2.0% for AGIs $25k-50k, 30.0% for AGIs $50k-75k)
Ordinary dividends: $750 (reported on 9.8% of returns)
Here:
$750
State:
$7,695
(% of AGI for various income ranges: 75.0% for AGIs $50k-75k)
Net capital gain/loss in AGI: +$5,100 (reported on 7.3% of returns)
Here:
+$5,100
State:
+$22,201
(% of AGI for various income ranges: 382.5% for AGIs $50k-75k)
Profit/loss from business: +$6,367 (reported on 14.6% of returns)
Here:
+$6,367
State:
+$15,095
(% of AGI for various income ranges: 212.7% for AGIs below $25k, 296.0% for AGIs $75k-100k)
Taxable individual retirement arrangement distribution: $10,767 (reported on 7.3% of returns)
04455:
$10,767
Maine:
$18,314
(% of AGI for various income ranges: 323.0% for AGIs $25k-50k)
Earned income credit: $2,186 (reported on 17.1% of returns)
Here:
$2,186
State:
$1,960
(% of AGI for various income ranges: 76.4% for AGIs below $25k, 69.0% for AGIs $25k-50k)
Percentage of individuals using paid preparers for their 2020 taxes: 92.7%
Here:
93%
State:
92%
(% for various income ranges: 92.9% for AGIs below $25k, 91.7% for AGIs $25k-50k, 100.0% for AGIs $50k-75k, 80.0% for AGIs $75k-100k, 100.0% for AGIs $100k-200k)
Averages for the 2012 tax year for zip code 04455, filed in 2013:
Average Adjusted Gross Income (AGI) in 2012: $43,787 (Individual Income Tax Returns)
Here:
$43,787
State:
$52,375
Salary/wage: $38,073 (reported on 86.8% of returns)
Here:
$38,073
State:
$43,415
(% of AGI for various income ranges: 68.4% for AGIs below $25k, 84.8% for AGIs $25k-50k, 81.5% for AGIs $50k-75k, 75.1% for AGIs $75k-100k, 62.0% for AGIs $100k-200k)
Taxable interest for individuals: $400 (reported on 23.7% of returns)
This zip code:
$400
Maine:
$1,221
(% of AGI for various income ranges: 0.6% for AGIs below $25k, 0.2% for AGIs $25k-50k, 0.1% for AGIs $50k-75k, 0.4% for AGIs $75k-100k)
Ordinary dividends: $1,200 (reported on 13.2% of returns)
Here:
$1,200
State:
$5,812
Net capital gain/loss in AGI: +$800 (reported on 10.5% of returns)
Here:
+$800
State:
+$11,897
Profit/loss from business: +$4,312 (reported on 21.1% of returns)
Here:
+$4,312
State:
+$12,144
Taxable individual retirement arrangement distribution: $9,200 (reported on 7.9% of returns)
04455:
$9,200
Maine:
$13,385
Total itemized deductions: $18,383 (19% of AGI, reported on 15.8% of returns)
Here:
$18,383
State:
$21,859
Here:
19.1% of AGI
State:
20.9% of AGI
Charity contributions: $1,775 (reported on 10.5% of returns)
Here:
$1,775
State:
$2,741
Taxes paid: $7,600 (reported on 15.8% of returns)
04455:
$7,600
State:
$9,996
Earned income credit: $2,200 (reported on 26.3% of returns)
Here:
$2,200
State:
$1,959
(% of AGI for various income ranges: 8.4% for AGIs below $25k, 1.2% for AGIs $25k-50k)
Percentage of individuals using paid preparers for their 2012 taxes: 65.8%
Here:
66%
State:
48%
(% for various income ranges: 60.0% for AGIs below $25k, 58.3% for AGIs $25k-50k, 83.3% for AGIs $50k-75k, 133.3% for AGIs $75k-100k)
Averages for the 2004 tax year for zip code 04455, filed in 2005:
Average Adjusted Gross Income (AGI) in 2004: $31,293 (Individual Income Tax Returns)
Here:
$31,293
State:
$42,606
Salary/wage: $27,700 (reported on 84.1% of returns)
Here:
$27,700
State:
$36,376
(% of AGI for various income ranges: 90.5% for AGIs below $10k, 67.5% for AGIs $10k-25k, 82.1% for AGIs $25k-50k, 76.9% for AGIs $50k-75k, 63.6% for AGIs $75k-100k)
Taxable interest for individuals: $629 (reported on 37.6% of returns)
This zip code:
$629
Maine:
$1,367
(% of AGI for various income ranges: 0.3% for AGIs below $10k, 0.9% for AGIs $10k-25k, 0.8% for AGIs $25k-50k, 1.2% for AGIs $50k-75k, 0.0% for AGIs $75k-100k)
Taxable dividends: $714 (reported on 18.8% of returns)
Here:
$714
State:
$3,533
(% of AGI for various income ranges: 1.3% for AGIs $10k-25k, 0.3% for AGIs $25k-50k, 0.3% for AGIs $50k-75k, 0.2% for AGIs $75k-100k)
Net capital gain/loss: +$2,478 (reported on 12.4% of returns)
Here:
+$2,478
State:
+$11,433
Profit/loss from business: +$1,862 (reported on 15.6% of returns)
Here:
+$1,862
State:
+$10,755
Total itemized deductions: $13,453 (24% of AGI, reported on 14.2% of returns)
Here:
$13,453
State:
$18,231
Here:
23.9% of AGI
State:
21.7% of AGI
Charity contributions deductions: $1,459 (3% of AGI, reported on 9.9% of returns)
Here:
$1,459
State:
$2,466
Here:
2.5% of AGI
State:
2.8% of AGI
Total tax: $3,046 (reported on 75.5% of returns)
04455:
$3,046
State:
$6,047
(% of AGI for various income ranges: 3.0% for AGIs below $10k, 3.9% for AGIs $10k-25k, 5.1% for AGIs $25k-50k, 8.2% for AGIs $50k-75k, 13.4% for AGIs $75k-100k)
Earned income credit: $1,271 (reported on 18.8% of returns)
Here:
$1,271
State:
$1,520
Percentage of individuals using paid preparers for their 2004 taxes: 59.1%
Here:
59%
State:
53%
(% for various income ranges: 38.9% for AGIs below $10k, 52.5% for AGIs $10k-25k, 68.9% for AGIs $25k-50k, 75.5% for AGIs $50k-75k, 75.0% for AGIs $75k-100k)
Household received Food Stamps/SNAP in the past 12 months: 49 Household did not receive Food Stamps/SNAP in the past 12 months: 261
Women who did not have a birth in the past 12 months: 183 (76 now married, 106 unmarried)
Housing units in zip code 04455 with a mortgage: 110 (5 second mortgage, 5 both second mortgage and home equity loan) Median monthly owner costs for units with a mortgage: $1,052 Median monthly owner costs for units without a mortgage: $353
Residents with income below the poverty level in 2022:
This zip code:
20.3%
Whole state:
10.8%
Residents with income below 50% of the poverty level in 2022:
This zip code:
8.2%
Whole state:
5.8%
Median number of rooms in houses and condos:
Here:
6.0
State:
6.1
Median number of rooms in apartments:
Here:
3.3
State:
4.0
Notable locations in this zip code not listed on our city pages
Notable locations in zip code 04455: Maple Grove Campground (A), Poplar Tavern Camp (B), Camp Number Eleven (C), Camp Number Nine (D), Lee Volunteer Fire Department (E). Display/hide their locations on the map
Lakes and reservoirs: Weir Pond (A), Cobb Pond (B), Egg Pond (C), Green Pond (D), House Pond (E), Little Madagascal Pond (F), Merrill Pond (G), Number Three Pond (H). Display/hide their locations on the map
Streams, rivers, and creeks: Taylor Brook (A), Thurlow Brook (B), Turkloin Brook (C), Sucker Brook (D), West Branch Passadumkeag River (E), Wheeler Brook (F), Gott Brook (G), Wyman Brook (H), Rocky Brook (I). Display/hide their locations on the map
In group quarters: 52 (-1 institutionalized population)
Size of family households: 132 2-persons, 37 3-persons, 42 4-persons, 4 5-persons, 14 7-or-more-persons
Size of nonfamily households: 66 1-person, 12 2-persons, 2 3-persons
98 married couples with children.
11 single-parent households (10 men, 1 women).
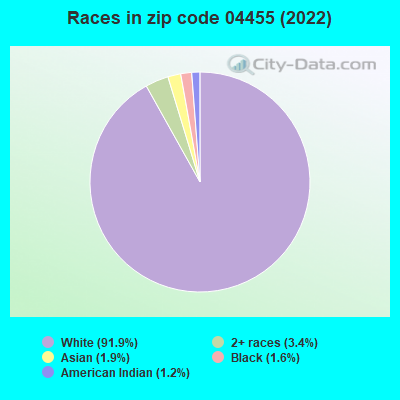
97.9% of residents of 04455 zip code speak English at home.
2.4% of residents speak Asian or Pacific Island language at home (100% very well).
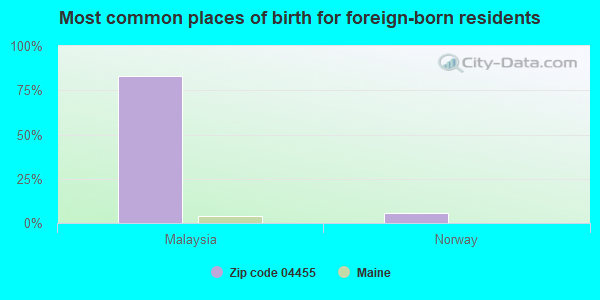
Foreign born population: 19 (2.3%) (11.7% of them are naturalized citizens)
This zip code:
2.3%
Whole state:
4.1%
83%Malaysia
6%Norway
50%English
13%French Canadian
13%American
6%Irish
4%French
3%Welsh
2%Scottish
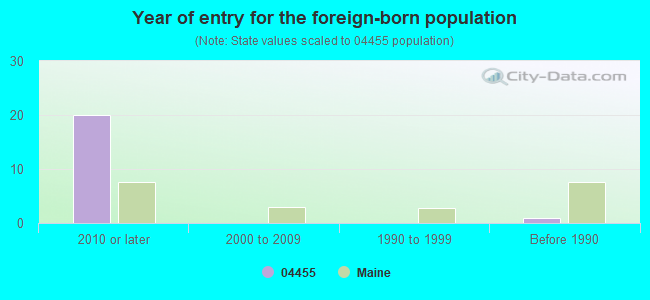
Year of entry for the foreign-born population
202010 or later
02000 to 2009
01990 to 1999
1Before 1990
Facilities with environmental interests located in this zip code:
MT JEFFERSON JR HIGH SCHOOL (61 WINN ROAD in LEE, ME)
(National Center for Education Statistics) - STATE ID-23002 Organizations: MSAD 30 LEE (SCHOOL DISTRICT)
LEE CHRISTIAN SCH (RT 168 in LEE, ME)
(Integrated Compliance Information System) - ICIS-01-1997-0060, FORMAL ENFORCEMENT ACTION
LEE ACADEMY (4 WINN ROAD in LEE, ME)
COMPLIANCE ACTIVITY (Tracking inspections of insecticide, fungicide, and rodenticide, and toxic substances)
SMART, DAVID (15 HALE FARM RD in LEE, ME)
USED OIL PROGRAM (Resource Conservation and Recovery Act (tracking hazardous waste)) Organizations: DAVID SMART (CONTACT/OWNER)
EDITH LOMBARD SCHOOL (RTE 6 in LEE, ME)
COMPLIANCE ACTIVITY (Tracking inspections of insecticide, fungicide, and rodenticide, and toxic substances)
LEE DPW GARAGE (6 WINN RD in LEE, ME)
ENFORCEMENT/COMPLIANCE ACTIVITY (Integrated Compliance Information System)
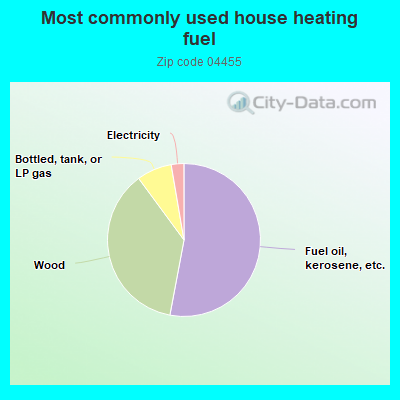
Housing units lacking complete plumbing facilities: 7.8% Housing units lacking complete kitchen facilities: 8.1%
53.5%Fuel oil, kerosene, etc.
37.3%Wood
7.5%Bottled, tank, or LP gas
2.7%Electricity
Population in 1990: 832. Population change in the 1990s: +73 (+8.8%).
Place of birth for U.S.-born residents:
This state: 501
Northeast: 237
Midwest: 29
South: 15
West: 21
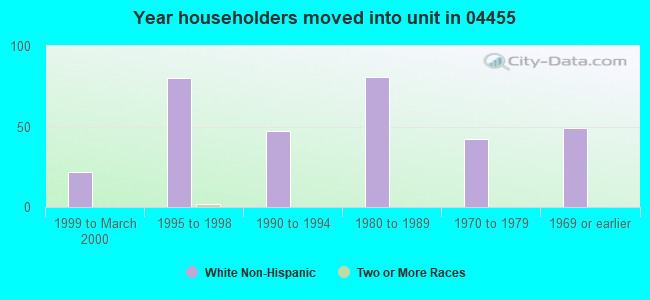
73% of the 04455 zip code residents lived in the same house 5 years ago. Out of people who lived in different houses, 83% lived in this county. Out of people who lived in different counties, 50% lived in Maine.
96% of the 04455 zip code residents lived in the same house 1 year ago. Out of people who lived in different houses, 42% moved from this county. Out of people who lived in different houses, 25% moved from different county within same state. Out of people who lived in different houses, 46% moved from different state.
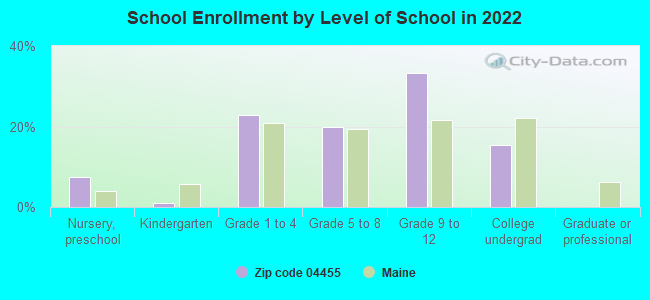
Private vs. public school enrollment:
Students in private schools in grades 1 to 8 (elementary and middle school):
Here:
0.0%
Maine:
12.7%
Students in private schools in grades 9 to 12 (high school): 21
Here:
32.6%
Maine:
12.6%
Students in private undergraduate colleges: 10
Here:
33.1%
Maine:
34.5%
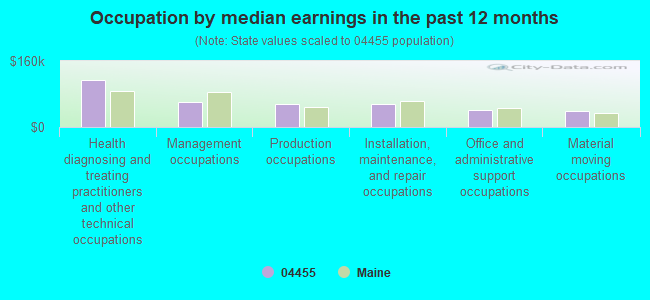
Occupation by median earnings in the past 12 months ($)
114,953Health diagnosing and treating practitioners and other technical occupations
60,098Management occupations
55,691Production occupations
55,271Installation, maintenance, and repair occupations
40,279Office and administrative support occupations
39,031Material moving occupations
Top industries in this zip code by the number of employees in 2005:
Educational Services: Elementary and Secondary Schools (50-99 employees: 1 establishment)
Construction: New Single-Family Housing Construction (except Operative Builders) (10-19: 1)
Arts, Entertainment, and Recreation: Skiing Facilities (5-9: 1)
People in group quarters in 2010:
79 people in workers' group living quarters and job corps centers
People in group quarters in 2000:
8 people in other noninstitutional group quarters
Fatal accident statistics in 2010:
Fatal accident count: 1
Vehicles involved in fatal accidents: 1
Fatal accidents caused by drunken drivers: 1
Fatalities: 1
Persons involved in fatal accidents: 2
Pedestrians involved in fatal accidents: 0
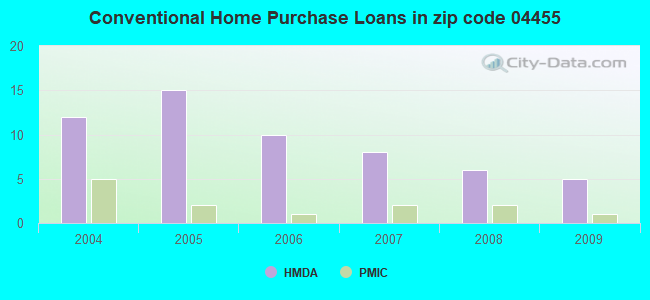
Home Mortgage Disclosure Act Aggregated Statistics For Year 2009 (Based on 2 partial tracts)
A) FHA, FSA/RHS & VA Home Purchase Loans
B) Conventional Home Purchase Loans
C) Refinancings
D) Home Improvement Loans
F) Non-occupant Loans on < 5 Family Dwellings (A B C & D)
G) Loans On Manufactured Home Dwelling (A B C & D)
Number
Average Value
Number
Average Value
Number
Average Value
Number
Average Value
Number
Average Value
Number
Average Value
LOANS ORIGINATED
2
$65,145
5
$120,110
15
$118,857
4
$48,025
2
$198,160
1
$71,510
APPLICATIONS APPROVED, NOT ACCEPTED
0
$0
0
$0
1
$83,020
1
$36,360
0
$0
0
$0
APPLICATIONS DENIED
1
$33,940
1
$87,260
10
$100,838
2
$55,450
2
$167,860
2
$9,395
APPLICATIONS WITHDRAWN
0
$0
1
$64,240
5
$95,020
2
$79,990
1
$64,240
0
$0
FILES CLOSED FOR INCOMPLETENESS
0
$0
0
$0
2
$106,655
0
$0
0
$0
1
$95,750
Aggregated Statistics For Year 2008 (Based on 2 partial tracts)
A) FHA, FSA/RHS & VA Home Purchase Loans
B) Conventional Home Purchase Loans
C) Refinancings
D) Home Improvement Loans
F) Non-occupant Loans on < 5 Family Dwellings (A B C & D)
G) Loans On Manufactured Home Dwelling (A B C & D)
Number
Average Value
Number
Average Value
Number
Average Value
Number
Average Value
Number
Average Value
Number
Average Value
LOANS ORIGINATED
4
$70,145
6
$142,107
10
$112,292
4
$27,422
3
$122,613
2
$86,355
APPLICATIONS APPROVED, NOT ACCEPTED
1
$127,870
1
$18,180
3
$99,787
0
$0
0
$0
1
$18,180
APPLICATIONS DENIED
0
$0
1
$55,750
12
$108,727
2
$9,695
1
$19,390
2
$35,150
APPLICATIONS WITHDRAWN
1
$95,750
1
$138,770
4
$113,020
1
$60,600
1
$158,770
0
$0
FILES CLOSED FOR INCOMPLETENESS
0
$0
0
$0
1
$42,420
0
$0
0
$0
0
$0
Aggregated Statistics For Year 2007 (Based on 2 partial tracts)
A) FHA, FSA/RHS & VA Home Purchase Loans
B) Conventional Home Purchase Loans
C) Refinancings
D) Home Improvement Loans
F) Non-occupant Loans on < 5 Family Dwellings (A B C & D)
G) Loans On Manufactured Home Dwelling (A B C & D)
Number
Average Value
Number
Average Value
Number
Average Value
Number
Average Value
Number
Average Value
Number
Average Value
LOANS ORIGINATED
1
$111,500
8
$99,688
18
$93,796
2
$33,330
5
$94,900
1
$48,480
APPLICATIONS APPROVED, NOT ACCEPTED
1
$52,720
1
$46,060
5
$83,992
1
$76,360
1
$46,060
0
$0
APPLICATIONS DENIED
0
$0
2
$76,355
19
$95,780
1
$68,480
2
$193,615
1
$48,480
APPLICATIONS WITHDRAWN
0
$0
1
$46,660
7
$77,309
1
$58,780
1
$30,300
0
$0
FILES CLOSED FOR INCOMPLETENESS
0
$0
0
$0
4
$83,325
0
$0
0
$0
0
$0
Aggregated Statistics For Year 2006 (Based on 2 partial tracts)
A) FHA, FSA/RHS & VA Home Purchase Loans
B) Conventional Home Purchase Loans
C) Refinancings
D) Home Improvement Loans
F) Non-occupant Loans on < 5 Family Dwellings (A B C & D)
G) Loans On Manufactured Home Dwelling (A B C & D)
Number
Average Value
Number
Average Value
Number
Average Value
Number
Average Value
Number
Average Value
Number
Average Value
LOANS ORIGINATED
2
$65,145
10
$75,932
18
$93,021
8
$32,270
5
$76,962
2
$61,810
APPLICATIONS APPROVED, NOT ACCEPTED
0
$0
2
$63,025
5
$78,780
1
$54,540
1
$49,090
0
$0
APPLICATIONS DENIED
1
$59,990
2
$67,265
13
$70,715
5
$39,026
2
$90,295
2
$56,660
APPLICATIONS WITHDRAWN
0
$0
2
$60,905
16
$87,946
1
$47,870
2
$32,120
1
$57,570
FILES CLOSED FOR INCOMPLETENESS
0
$0
1
$52,120
1
$170,290
0
$0
1
$52,120
0
$0
Aggregated Statistics For Year 2005 (Based on 2 partial tracts)
A) FHA, FSA/RHS & VA Home Purchase Loans
B) Conventional Home Purchase Loans
C) Refinancings
D) Home Improvement Loans
F) Non-occupant Loans on < 5 Family Dwellings (A B C & D)
G) Loans On Manufactured Home Dwelling (A B C & D)
Number
Average Value
Number
Average Value
Number
Average Value
Number
Average Value
Number
Average Value
Number
Average Value
LOANS ORIGINATED
2
$93,020
15
$88,193
22
$93,296
12
$27,977
9
$81,406
2
$52,420
APPLICATIONS APPROVED, NOT ACCEPTED
0
$0
2
$53,330
4
$73,630
0
$0
2
$53,330
0
$0
APPLICATIONS DENIED
1
$59,390
5
$71,630
28
$68,153
8
$27,194
1
$106,660
8
$73,099
APPLICATIONS WITHDRAWN
0
$0
3
$82,820
14
$76,572
1
$121,200
1
$27,270
1
$116,960
FILES CLOSED FOR INCOMPLETENESS
0
$0
1
$46,060
4
$79,538
0
$0
0
$0
0
$0
Aggregated Statistics For Year 2004 (Based on 2 partial tracts)
A) FHA, FSA/RHS & VA Home Purchase Loans
B) Conventional Home Purchase Loans
C) Refinancings
D) Home Improvement Loans
E) Loans on Dwellings For 5+ Families
F) Non-occupant Loans on < 5 Family Dwellings (A B C & D)
G) Loans On Manufactured Home Dwelling (A B C & D)


 Nearest zip codes: 04417, 04487, 04495, 04457, 04493, 04418.