Estimated zip code population in 2022: 4,411 Zip code population in 2010: 4,397 Zip code population in 2000: 4,628
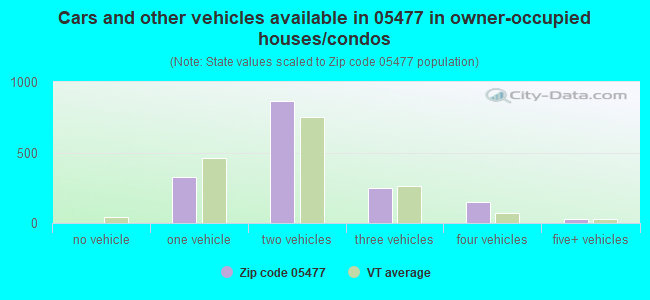
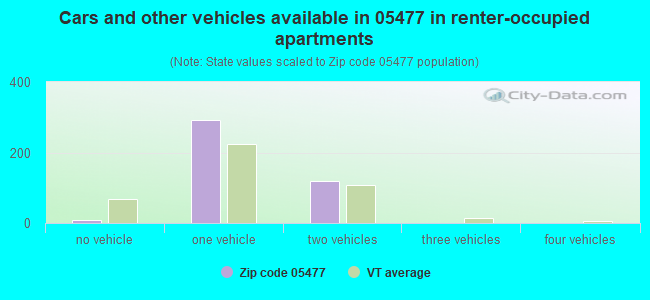
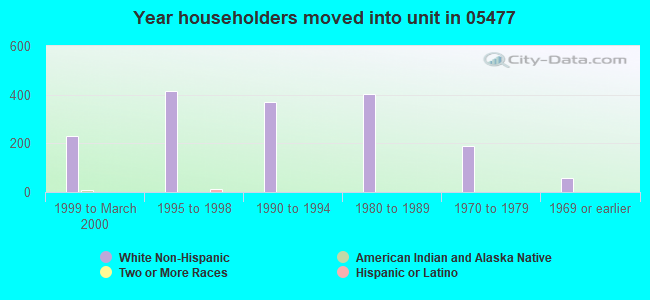
Houses and condos: 2,166 Renter-occupied apartments: 408
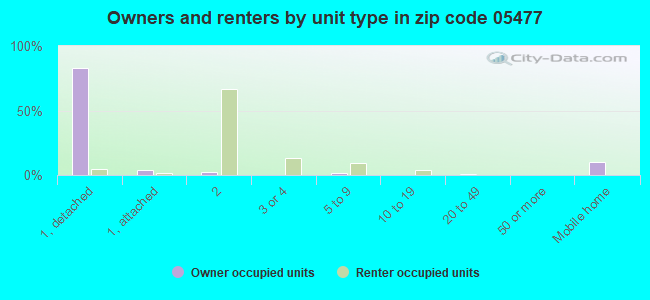
% of renters here:
20%
State:
26%
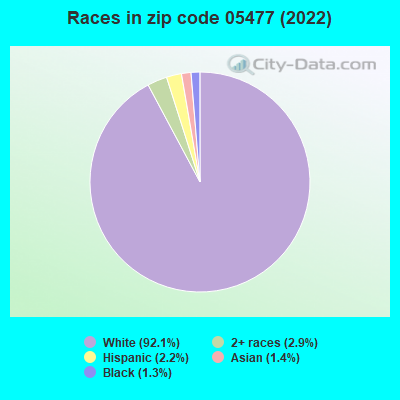
March 2022 cost of living index in zip code 05477: 92.1 (less than average, U.S. average is 100)
Land area: 46.4 sq. mi. Water area: 0.5 sq. mi.
Population density: 95 people per square mile
(very low).
OSM Map
Google Map
MSN Map
OSM Map
General Map
Google Map
MSN Map
OSM Map
Google Map
MSN Map
OSM Map
Google Map
MSN Map
Please wait while loading the map...
Real estate property taxes paid for housing units in 2022:
This zip code:
1.5% ($6,657)
Vermont:
1.6% ($4,787)
Median real estate property taxes paid for housing units with mortgages in 2022: $6,961 (1.6%) Median real estate property taxes paid for housing units with no mortgage in 2022: $6,113 (1.4%)
Business Search- 14 Million verified businesses
Males: 2,257
(51.2%)
Females: 2,153
(48.8%)
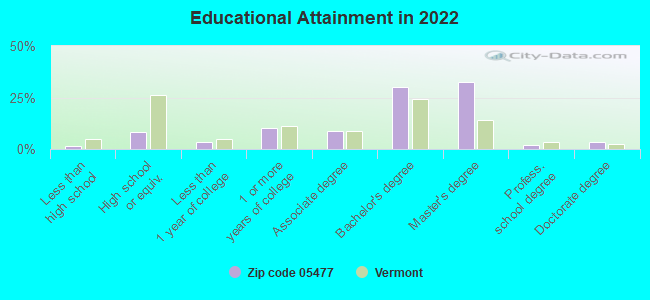
For population 25 years and over in 05477:
High school or higher: 102.5%
Bachelor's degree or higher: 70.6%
Graduate or professional degree: 39.6%
Unemployed: 1.3%
Mean travel time to work (commute): 26.0 minutes
For population 15 years and over in 05477:
Never married: 24.1%
Now married: 60.9%
Separated: 0.3%
Widowed: 6.4%
Divorced: 8.2%
Zip code 05477 compared to state average:
Median household income above state average.
Unemployed percentage below state average.
Length of stay since moving in significantly above state average.
Percentage of population with a bachelor's degree or higher above state average.
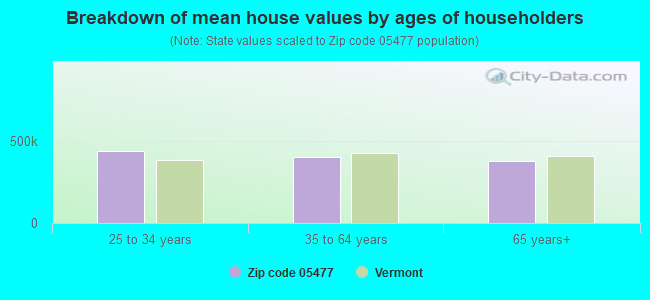
Estimated median house/condo value in 2022: $436,356
05477:
$436,356
Vermont:
$304,700
According to our research of Vermont and other state lists, there were 6 registered sex offenders living in 05477 zip code as of May 23, 2024. The ratio of all residents to sex offenders in zip code 05477 is 762 to 1. The ratio of registered sex offenders to all residents in this zip code is lower than the state average.
Median resident age:
This zip code:
43.8 years
Vermont median age:
43.2 years
Average household size:
This zip code:
2.2 people
Vermont:
2.2 people
Averages for the 2020 tax year for zip code 05477, filed in 2021:
Average Adjusted Gross Income (AGI) in 2020: $89,481 (Individual Income Tax Returns)
Here:
$89,481
State:
$70,107
Salary/wage: $73,257 (reported on 85.6% of returns)
Here:
$73,257
State:
$56,381
(% of AGI for various income ranges: 1207.1% for AGIs below $25k, 3985.6% for AGIs $25k-50k, 6636.0% for AGIs $50k-75k, 9240.0% for AGIs $75k-100k, 18460.6% for AGIs $100k-200k, 63035.7% for AGIs over 200k)
Taxable interest for individuals: $1,111 (reported on 46.9% of returns)
This zip code:
$1,111
Vermont:
$1,276
(% of AGI for various income ranges: 12.9% for AGIs below $25k, 30.3% for AGIs $25k-50k, 76.0% for AGIs $50k-75k, 92.5% for AGIs $75k-100k, 87.7% for AGIs $100k-200k, 705.7% for AGIs over 200k)
Ordinary dividends: $6,765 (reported on 32.9% of returns)
Here:
$6,765
State:
$8,930
(% of AGI for various income ranges: 50.0% for AGIs below $25k, 72.3% for AGIs $25k-50k, 144.8% for AGIs $50k-75k, 277.5% for AGIs $75k-100k, 487.7% for AGIs $100k-200k, 3774.3% for AGIs over 200k)
Net capital gain/loss in AGI: +$15,174 (reported on 27.2% of returns)
Here:
+$15,174
State:
+$19,777
(% of AGI for various income ranges: 28.2% for AGIs below $25k, 63.1% for AGIs $25k-50k, 120.0% for AGIs $50k-75k, 301.9% for AGIs $75k-100k, 716.8% for AGIs $100k-200k, 9525.7% for AGIs over 200k)
Profit/loss from business: +$19,821 (reported on 19.8% of returns)
Here:
+$19,821
State:
+$15,467
(% of AGI for various income ranges: 124.4% for AGIs below $25k, 291.8% for AGIs $25k-50k, 180.8% for AGIs $50k-75k, 580.0% for AGIs $75k-100k, 1003.9% for AGIs $100k-200k, 4944.3% for AGIs over 200k)
Taxable individual retirement arrangement distribution: $16,989 (reported on 11.1% of returns)
05477:
$16,989
Vermont:
$17,245
(% of AGI for various income ranges: 70.3% for AGIs below $25k, 133.1% for AGIs $25k-50k, 122.0% for AGIs $50k-75k, 528.8% for AGIs $75k-100k, 658.4% for AGIs $100k-200k, 910.0% for AGIs over 200k)
Self-employed (Keogh) retirement plans: $21,300 (reported on 1.2% of returns)
05477:
$21,300
Vermont:
$20,735
(% of AGI for various income ranges: 206.1% for AGIs $100k-200k)
Total itemized deductions: $27,396 (reported on 9.5% of returns)
Here:
$27,396
State:
$33,390
(% of AGI for various income ranges: 184.1% for AGIs below $25k, 235.6% for AGIs $50k-75k, 675.6% for AGIs $75k-100k, 582.9% for AGIs $100k-200k, 3140.0% for AGIs over 200k)
Charity contributions: $6,253 (reported on 7.0% of returns)
Here:
$6,253
State:
$11,950
(% of AGI for various income ranges: 9.0% for AGIs $25k-50k, 41.2% for AGIs $75k-100k, 94.5% for AGIs $100k-200k, 955.7% for AGIs over 200k)
Taxes paid: $8,864 (reported on 9.1% of returns)
05477:
$8,864
State:
$8,349
(% of AGI for various income ranges: 39.1% for AGIs below $25k, 97.2% for AGIs $50k-75k, 194.4% for AGIs $75k-100k, 204.5% for AGIs $100k-200k, 898.6% for AGIs over 200k)
Earned income credit: $1,713 (reported on 6.2% of returns)
Here:
$1,713
State:
$1,839
(% of AGI for various income ranges: 47.1% for AGIs below $25k, 24.9% for AGIs $25k-50k)
Percentage of individuals using paid preparers for their 2020 taxes: 93.4%
Here:
93%
State:
93%
(% for various income ranges: 92.6% for AGIs below $25k, 92.5% for AGIs $25k-50k, 91.4% for AGIs $50k-75k, 92.0% for AGIs $75k-100k, 96.4% for AGIs $100k-200k, 95.2% for AGIs over 200k)
Averages for the 2012 tax year for zip code 05477, filed in 2013:
Average Adjusted Gross Income (AGI) in 2012: $68,173 (Individual Income Tax Returns)
Here:
$68,173
State:
$55,225
Salary/wage: $57,665 (reported on 87.3% of returns)
Here:
$57,665
State:
$44,925
(% of AGI for various income ranges: 73.3% for AGIs below $25k, 80.5% for AGIs $25k-50k, 80.5% for AGIs $50k-75k, 77.7% for AGIs $75k-100k, 80.6% for AGIs $100k-200k, 57.2% for AGIs over 200k)
Taxable interest for individuals: $810 (reported on 43.5% of returns)
This zip code:
$810
Vermont:
$1,237
(% of AGI for various income ranges: 1.2% for AGIs below $25k, 0.8% for AGIs $25k-50k, 0.4% for AGIs $50k-75k, 0.4% for AGIs $75k-100k, 0.3% for AGIs $100k-200k, 0.6% for AGIs over 200k)
Ordinary dividends: $4,300 (reported on 29.5% of returns)
Here:
$4,300
State:
$7,010
(% of AGI for various income ranges: 2.5% for AGIs below $25k, 1.1% for AGIs $25k-50k, 1.0% for AGIs $50k-75k, 1.8% for AGIs $75k-100k, 1.7% for AGIs $100k-200k, 2.8% for AGIs over 200k)
Net capital gain/loss in AGI: +$16,073 (reported on 21.9% of returns)
Here:
+$16,073
State:
+$13,197
(% of AGI for various income ranges: 1.9% for AGIs $75k-100k, 2.2% for AGIs $100k-200k, 16.9% for AGIs over 200k)
Profit/loss from business: +$15,958 (reported on 19.0% of returns)
Here:
+$15,958
State:
+$12,941
(% of AGI for various income ranges: 9.4% for AGIs below $25k, 6.0% for AGIs $25k-50k, 4.9% for AGIs $50k-75k, 5.6% for AGIs $75k-100k, 3.6% for AGIs $100k-200k, 2.8% for AGIs over 200k)
Taxable individual retirement arrangement distribution: $12,961 (reported on 9.7% of returns)
05477:
$12,961
Vermont:
$12,934
(% of AGI for various income ranges: 5.5% for AGIs below $25k, 2.4% for AGIs $25k-50k, 1.6% for AGIs $50k-75k, 2.9% for AGIs $75k-100k, 2.1% for AGIs $100k-200k)
Self-employment retirement plans: $15,075 (reported on 1.7% of returns)
05477:
$15,075
Vermont:
$16,094
Total itemized deductions: $22,115 (18% of AGI, reported on 37.6% of returns)
Here:
$22,115
State:
$22,572
Here:
17.6% of AGI
State:
19.9% of AGI
(% of AGI for various income ranges: 8.5% for AGIs below $25k, 7.2% for AGIs $25k-50k, 10.2% for AGIs $50k-75k, 13.1% for AGIs $75k-100k, 15.3% for AGIs $100k-200k, 11.9% for AGIs over 200k)
Charity contributions: $2,327 (reported on 29.5% of returns)
Here:
$2,327
State:
$3,170
(% of AGI for various income ranges: 0.5% for AGIs below $25k, 0.3% for AGIs $25k-50k, 0.7% for AGIs $50k-75k, 1.5% for AGIs $75k-100k, 1.2% for AGIs $100k-200k, 1.1% for AGIs over 200k)
Taxes paid: $11,202 (reported on 37.6% of returns)
05477:
$11,202
State:
$10,425
(% of AGI for various income ranges: 2.1% for AGIs below $25k, 2.2% for AGIs $25k-50k, 4.1% for AGIs $50k-75k, 5.3% for AGIs $75k-100k, 8.0% for AGIs $100k-200k, 8.2% for AGIs over 200k)
Earned income credit: $1,524 (reported on 8.9% of returns)
Here:
$1,524
State:
$1,828
(% of AGI for various income ranges: 2.6% for AGIs below $25k, 0.5% for AGIs $25k-50k)
Percentage of individuals using paid preparers for their 2012 taxes: 45.1%
Here:
45%
State:
49%
(% for various income ranges: 39.5% for AGIs below $25k, 38.9% for AGIs $25k-50k, 48.4% for AGIs $50k-75k, 50.0% for AGIs $75k-100k, 50.0% for AGIs $100k-200k, 80.0% for AGIs over 200k)
Averages for the 2004 tax year for zip code 05477, filed in 2005:
Average Adjusted Gross Income (AGI) in 2004: $53,996 (Individual Income Tax Returns)
Here:
$53,996
State:
$44,564
Salary/wage: $46,599 (reported on 89.9% of returns)
Here:
$46,599
State:
$37,522
(% of AGI for various income ranges: 97.9% for AGIs below $10k, 81.3% for AGIs $10k-25k, 82.5% for AGIs $25k-50k, 84.5% for AGIs $50k-75k, 85.0% for AGIs $75k-100k, 68.6% for AGIs over 100k)
Taxable interest for individuals: $827 (reported on 56.6% of returns)
This zip code:
$827
Vermont:
$1,373
(% of AGI for various income ranges: 5.9% for AGIs below $10k, 1.3% for AGIs $10k-25k, 1.2% for AGIs $25k-50k, 0.6% for AGIs $50k-75k, 0.5% for AGIs $75k-100k, 0.8% for AGIs over 100k)
Taxable dividends: $2,480 (reported on 35.6% of returns)
Here:
$2,480
State:
$4,037
(% of AGI for various income ranges: 9.5% for AGIs below $10k, 1.7% for AGIs $10k-25k, 1.4% for AGIs $25k-50k, 0.9% for AGIs $50k-75k, 0.6% for AGIs $75k-100k, 2.2% for AGIs over 100k)
Net capital gain/loss: +$11,638 (reported on 26.9% of returns)
Here:
+$11,638
State:
+$11,311
(% of AGI for various income ranges: 1.5% for AGIs below $10k, 0.5% for AGIs $10k-25k, 1.5% for AGIs $25k-50k, 0.6% for AGIs $50k-75k, 2.2% for AGIs $75k-100k, 12.2% for AGIs over 100k)
Profit/loss from business: +$11,187 (reported on 19.0% of returns)
Here:
+$11,187
State:
+$11,197
(% of AGI for various income ranges: 4.7% for AGIs below $10k, 6.5% for AGIs $10k-25k, 5.4% for AGIs $25k-50k, 4.4% for AGIs $50k-75k, 4.4% for AGIs $75k-100k, 2.6% for AGIs over 100k)
IRA payment deduction: $2,687 (reported on 4.5% of returns)
05477:
$2,687
Vermont:
$3,004
(% of AGI for various income ranges: 0.2% for AGIs $10k-25k, 0.5% for AGIs $25k-50k, 0.6% for AGIs $50k-75k, 0.1% for AGIs over 100k)
Self-employed pension: $9,757 (reported on 1.7% of returns)
Here:
$9,757
Vermont:
$12,124
Total itemized deductions: $16,922 (18% of AGI, reported on 39.8% of returns)
Here:
$16,922
State:
$17,791
Here:
18.1% of AGI
State:
20.0% of AGI
(% of AGI for various income ranges: 16.8% for AGIs below $10k, 7.2% for AGIs $10k-25k, 9.2% for AGIs $25k-50k, 13.4% for AGIs $50k-75k, 15.3% for AGIs $75k-100k, 12.9% for AGIs over 100k)
Charity contributions deductions: $1,839 (2% of AGI, reported on 34.8% of returns)
Here:
$1,839
State:
$2,686
Here:
1.9% of AGI
State:
2.8% of AGI
(% of AGI for various income ranges: 0.3% for AGIs below $10k, 0.6% for AGIs $10k-25k, 0.5% for AGIs $25k-50k, 1.1% for AGIs $50k-75k, 1.6% for AGIs $75k-100k, 1.5% for AGIs over 100k)
Total tax: $7,777 (reported on 83.8% of returns)
05477:
$7,777
State:
$6,533
(% of AGI for various income ranges: 3.6% for AGIs below $10k, 5.5% for AGIs $10k-25k, 8.1% for AGIs $25k-50k, 8.8% for AGIs $50k-75k, 10.4% for AGIs $75k-100k, 17.0% for AGIs over 100k)
Earned income credit: $1,457 (reported on 7.3% of returns)
Here:
$1,457
State:
$1,432
Percentage of individuals using paid preparers for their 2004 taxes: 44.2%
Here:
44%
State:
54%
(% for various income ranges: 36.3% for AGIs below $10k, 42.6% for AGIs $10k-25k, 46.1% for AGIs $25k-50k, 45.7% for AGIs $50k-75k, 47.6% for AGIs $75k-100k, 49.0% for AGIs over 100k)
Household received Food Stamps/SNAP in the past 12 months: 80 Household did not receive Food Stamps/SNAP in the past 12 months: 1,937
Women who had a birth in the past 12 months: 24 (23 now married, 0 unmarried) Women who did not have a birth in the past 12 months: 959 (546 now married, 422 unmarried)
Housing units in zip code 05477 with a mortgage: 1,049 (173 second mortgage, 171 both second mortgage and home equity loan) Houses without a mortgage: 36
Median monthly owner costs for units with a mortgage: $2,214 Median monthly owner costs for units without a mortgage: $921
Residents with income below the poverty level in 2022:
This zip code:
2.9%
Whole state:
10.4%
Residents with income below 50% of the poverty level in 2022:
This zip code:
2.2%
Whole state:
6.1%
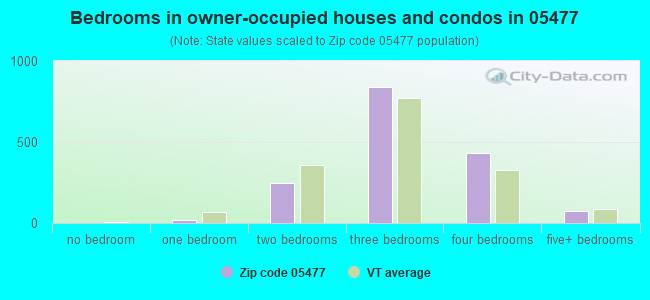
Median number of rooms in houses and condos:
Here:
6.8
State:
6.4
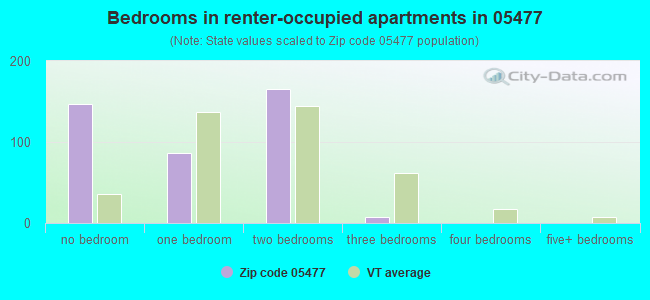
Median number of rooms in apartments:
Here:
2.3
State:
3.9
Notable locations in this zip code not listed on our city pages
Notable locations in zip code 05477: Champlain Council Campfire Girls Camp (A), Cochran Ski Center (B), Richmond Fire Department - Town of Richmond Garage (C), Richmond Fire Department (D), Richmond Rescue Incorporated (E). Display/hide their locations on the map
Size of family households: 632 2-persons, 374 3-persons, 228 4-persons, 50 5-persons, 7 6-persons, 6 7-or-more-persons
Size of nonfamily households: 569 1-person, 150 2-persons, 2 3-persons
725 married couples with children.
136 single-parent households (67 men, 69 women).
98.7% of residents of 05477 zip code speak English at home.
0.6% of residents speak Spanish at home (26% very well, 44% well, 30% not well).
0.4% of residents speak other Indo-European language at home (100% very well).
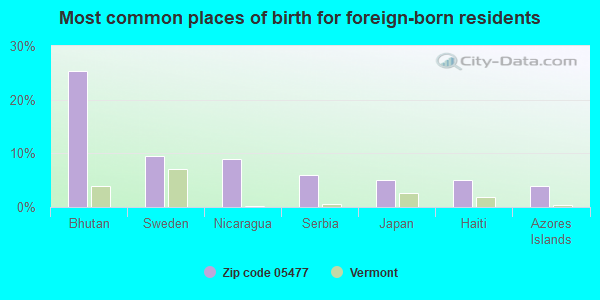
Foreign born population: 183 (4.2%) (45.5% of them are naturalized citizens)
This zip code:
4.2%
Whole state:
4.2%
25%Bhutan
9%Sweden
9%Nicaragua
6%Serbia
5%Japan
5%Haiti
4%Azores Islands
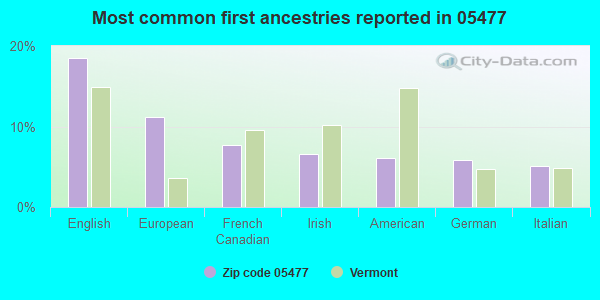
19%English
11%European
8%French Canadian
7%Irish
6%American
6%German
5%Italian
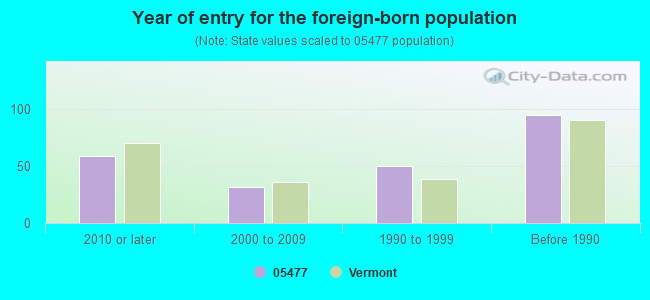
Year of entry for the foreign-born population
592010 or later
322000 to 2009
501990 to 1999
95Before 1990
Major facilities with environmental interests located in this zip code:
RICHMOND ELEMENTARY SCHOOL (125 SCHOOL STREET in RICHMOND, VT)
(Geographic Names Information System) (National Center for Education Statistics) - STATE ID-PS243
CAMELS HUMP MIDDLE USD #17 (173 SCHOOL STREET in RICHMOND, VT)
(National Center for Education Statistics) - STATE ID-PS058 Organizations: MT. MANSFIELD USD #17 (SCHOOL DISTRICT)
CHITTENDEN EAST S.U. (BRIDGE STREET in RICHMOND, VT)
(National Center for Education Statistics) - STATE ID-SU012
CHRISTMAS HILL MHP (RD 2 BOX 234 in RICHMOND, VT)
(Integrated Compliance Information System) - ICIS-01-2001-0076, FORMAL ENFORCEMENT ACTION
JOHNSON & DIX RICHMOND MOBIL (1436 W MAIN ST in RICHMOND, VT)
Conditionally Exempt Small Quantity Generators, less than 100 kg/month of hazardous waste (Resource Conservation and Recovery Act (tracking hazardous waste)) - notification Organizations: JOHNSON & DIX FUEL CORP (CONTACT/OPERATOR)
, MOBIL OIL CORP (CONTACT/OWNER)
, BREED PROPERTIES II LIMITED PARTNERSHIP (CONTACT/OWNER)
, TOM KAMINSKI (CONTACT/OWNER)
Alternative names: MOBIL OIL CORP SS GH8
BOLTON VALLEY RESORT (4302 BOLTON ACCESS RD in RICHMOND, VT)
Conditionally Exempt Small Quantity Generators, less than 100 kg/month of hazardous waste (Resource Conservation and Recovery Act (tracking hazardous waste)) Organizations: ROBERT A FRIES (CONTACT/OPERATOR)
, MT OPERATIONS & DEVELOPMENT CORP (CONTACT/OWNER)
CHITTENDEN SOLID WASTE DIST RICHMOND (83 OLD DUMP RD in RICHMOND, VT)
(Resource Conservation and Recovery Act (tracking hazardous waste)) Organizations: TOWN OF RICHMOND (CONTACT/OWNER)
MANN & MACHINE INC (430 W MAIN ST in RICHMOND, VT)
Conditionally Exempt Small Quantity Generators, less than 100 kg/month of hazardous waste (Resource Conservation and Recovery Act (tracking hazardous waste)) Business NAICS classification: GENERAL AUTOMOTIVE REPAIR. Organizations: PETER & HEIDI BORMANN (CONTACT/OPERATOR)
, MATT TOURVILLE (CONTACT/OWNER)
MILLWORKS LLC THE (3214 EAST MAIN ST in RICHMOND, VT)
Conditionally Exempt Small Quantity Generators, less than 100 kg/month of hazardous waste (Resource Conservation and Recovery Act (tracking hazardous waste)) Organizations: CHARLES W OWENS/THE MILLWORKS LLC (CONTACT/OPERATOR)
, ISAAC COWAN (CONTACT/OWNER)
, THE MILLWORKS LLC (CONTACT/OWNER)
PAULS AUTO BODY (MILLETT ST in RICHMOND, VT)
(Resource Conservation and Recovery Act (tracking hazardous waste)) Organizations: PAUL GUYETTE (CONTACT/OWNER)
PERFECTION MOTORSPORTS & TRAILOR SALES (3216 EAST MAIN ST in RICHMOND, VT)
Conditionally Exempt Small Quantity Generators, less than 100 kg/month of hazardous waste (Resource Conservation and Recovery Act (tracking hazardous waste)) Organizations: P & M PROPERTIES LLC (CONTACT/OWNER)
, PETER MUMFORD PERFECTION MOTORSPORTS (CONTACT/OWNER)
RICHMOND AUTO SALES INC (264 RIVER RD in RICHMOND, VT)
Conditionally Exempt Small Quantity Generators, less than 100 kg/month of hazardous waste (Resource Conservation and Recovery Act (tracking hazardous waste)) Organizations: HARRY W WEED (CONTACT/OWNER)
, WILLIAM DONOVAN INC (CONTACT/OWNER)
PATTERSON FUELS (168 RIVER RD in RICHMOND, VT)
Conditionally Exempt Small Quantity Generators, less than 100 kg/month of hazardous waste (Resource Conservation and Recovery Act (tracking hazardous waste)) Organizations: MAURICE HARVEY (CONTACT/OWNER)
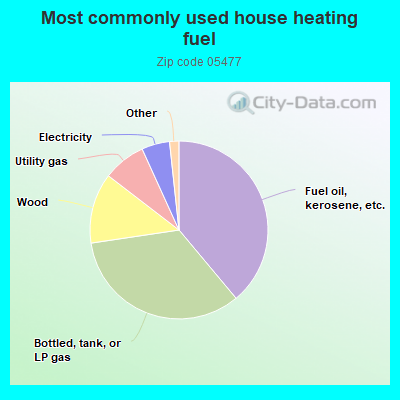
39.0%Fuel oil, kerosene, etc.
33.8%Bottled, tank, or LP gas
12.8%Wood
7.8%Utility gas
5.1%Electricity
0.8%Solar energy
0.5%Coal or coke
0.5%Other fuel
Population in 1990: 3,758. Population change in the 1990s: +870 (+23.2%).
Place of birth for U.S.-born residents:
This state: 2,015
Northeast: 1,644
Midwest: 268
South: 216
West: 40
66% of the 05477 zip code residents lived in the same house 5 years ago. Out of people who lived in different houses, 53% lived in this county. Out of people who lived in different counties, 50% lived in Vermont.
89% of the 05477 zip code residents lived in the same house 1 year ago. Out of people who lived in different houses, 46% moved from this county. Out of people who lived in different houses, 6% moved from different county within same state. Out of people who lived in different houses, 45% moved from different state.
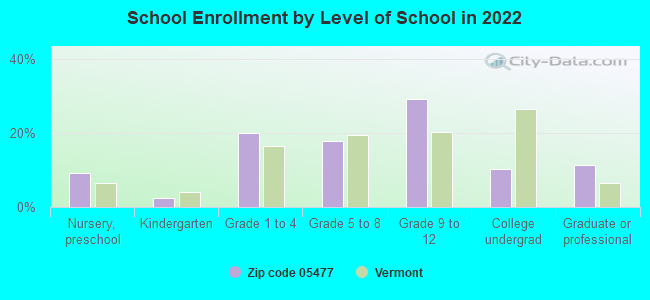
Private vs. public school enrollment:
Students in private schools in grades 1 to 8 (elementary and middle school): 6
Here:
1.7%
Vermont:
10.3%
Students in private schools in grades 9 to 12 (high school):
Here:
0.0%
Vermont:
11.6%
Students in private undergraduate colleges:
Here:
0.0%
Vermont:
29.2%
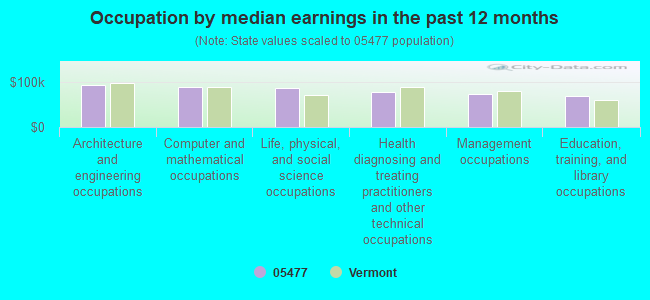
Occupation by median earnings in the past 12 months ($)
92,923Architecture and engineering occupations
88,016Computer and mathematical occupations
86,330Life, physical, and social science occupations
77,097Health diagnosing and treating practitioners and other technical occupations
74,587Management occupations
69,980Education, training, and library occupations
Companies with federal contracts located in this zip code:
J HUTCHINS, INC (88 ROGERS LANE in RICHMOND, VT; small business) : $45,248 in 2 contractsfrom 2000 to 2006
$24,248 with Army for Construction of Structures and Facilities -- Electronic and Communications Facilities. Signed on 2006-04-17. Completion date: 2006-06-01.
$21,000 with Soil Conservation Service (disused code) for Construction of Structures and Facilities -- Restoration of real property. Signed on 2000-12-15. Completion date: 2000-12-15.
PERFECTION AUTO PARTS INC (3216 E MAIN ST in RICHMOND, VT; small business)
$7,558 with Army for Trailers. Signed on 2006-04-14. Completion date: 2006-05-11.
MOUNTAIN OPERATIONS & DEVELOPM (4302 BOLTON VALLEY ACCESS in RICHMOND, VT; small business) : $0 in 2 contractsin 2005
$10,370 with Army for Food Services. Signed on 2005-09-07. Completion date: 2005-09-17.
-$10,370, same as above.Signed on 2005-09-07. Completion date: 2005-09-17.
Top industries in this zip code by the number of employees in 2005:
Professional, Scientific, and Technical Services: Offices of Lawyers (50-99 employees: 1 establishment, 1-4 employees: 2 establishments)
Accommodation and Food Services: Full-Service Restaurants (20-49: 2, 5-9: 1)
Wholesale Trade: Construction and Mining (except Oil Well) Machinery and Equipment Merchant Wholesalers (50-99: 1)
Other Services (except Public Administration): Environment, Conservation and Wildlife Organizations (20-49: 1, 10-19: 2)
Construction: New Single-Family Housing Construction (except Operative Builders) (20-49: 1, 1-4: 4)
Construction: Site Preparation Contractors (20-49: 1, 1-4: 2)
Health Care and Social Assistance: Child Day Care Services (20-49: 1, 1-4: 1)
Information: Periodical Publishers (20-49: 1)
Professional, Scientific, and Technical Services: Environmental Consulting Services (10-19: 2)
People in group quarters in 2010:
13 people in group homes intended for adults
People in group quarters in 2000:
15 people in other noninstitutional group quarters
Fatal accident statistics in 2012:
Fatal accident count: 1
Vehicles involved in fatal accidents: 3
Fatal accidents caused by drunken drivers: 0
Fatalities: 1
Persons involved in fatal accidents: 9
Pedestrians involved in fatal accidents: 0
Fatal accident statistics in 2010:
Fatal accident count: 1
Vehicles involved in fatal accidents: 1
Fatal accidents caused by drunken drivers: 1
Fatalities: 1
Persons involved in fatal accidents: 2
Pedestrians involved in fatal accidents: 0
Home Mortgage Disclosure Act Aggregated Statistics For Year 2009 (Based on 6 partial tracts)
A) FHA, FSA/RHS & VA Home Purchase Loans
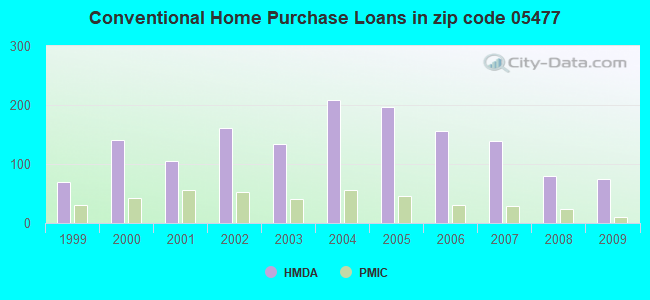
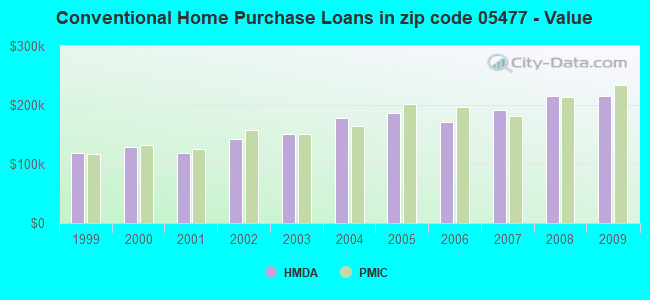
B) Conventional Home Purchase Loans
C) Refinancings
D) Home Improvement Loans
E) Loans on Dwellings For 5+ Families
F) Non-occupant Loans on < 5 Family Dwellings (A B C & D)
G) Loans On Manufactured Home Dwelling (A B C & D)
Number
Average Value
Number
Average Value
Number
Average Value
Number
Average Value
Number
Average Value
Number
Average Value
Number
Average Value
LOANS ORIGINATED
32
$236,631
75
$214,960
527
$189,754
33
$89,113
2
$182,430
18
$155,544
6
$84,517
APPLICATIONS APPROVED, NOT ACCEPTED
2
$201,165
3
$278,163
38
$228,964
3
$72,917
0
$0
2
$204,900
0
$0
APPLICATIONS DENIED
2
$208,545
18
$145,986
73
$194,932
10
$46,712
0
$0
4
$114,695
13
$49,271
APPLICATIONS WITHDRAWN
4
$273,820
5
$237,384
53
$231,042
1
$132,050
0
$0
0
$0
2
$128,195
FILES CLOSED FOR INCOMPLETENESS
0
$0
4
$122,665
7
$195,391
2
$98,610
0
$0
2
$177,500
4
$103,540
Aggregated Statistics For Year 2008 (Based on 6 partial tracts)
A) FHA, FSA/RHS & VA Home Purchase Loans
B) Conventional Home Purchase Loans
C) Refinancings
D) Home Improvement Loans
E) Loans on Dwellings For 5+ Families
F) Non-occupant Loans on < 5 Family Dwellings (A B C & D)
G) Loans On Manufactured Home Dwelling (A B C & D)
Number
Average Value
Number
Average Value
Number
Average Value
Number
Average Value
Number
Average Value
Number
Average Value
Number
Average Value
LOANS ORIGINATED
10
$230,020
79
$214,695
259
$199,832
45
$68,763
2
$261,315
18
$504,275
23
$412,178
APPLICATIONS APPROVED, NOT ACCEPTED
4
$173,678
17
$206,362
28
$150,475
6
$62,430
0
$0
2
$194,055
4
$84,805
APPLICATIONS DENIED
0
$0
12
$203,855
77
$200,384
17
$79,916
0
$0
0
$0
17
$66,096
APPLICATIONS WITHDRAWN
0
$0
8
$138,144
43
$181,158
1
$144,130
0
$0
2
$329,790
2
$110,165
FILES CLOSED FOR INCOMPLETENESS
0
$0
1
$216,600
10
$182,614
1
$20,130
0
$0
0
$0
0
$0
Aggregated Statistics For Year 2007 (Based on 6 partial tracts)
A) FHA, FSA/RHS & VA Home Purchase Loans
B) Conventional Home Purchase Loans
C) Refinancings
D) Home Improvement Loans
E) Loans on Dwellings For 5+ Families
F) Non-occupant Loans on < 5 Family Dwellings (A B C & D)
G) Loans On Manufactured Home Dwelling (A B C & D)
Number
Average Value
Number
Average Value
Number
Average Value
Number
Average Value
Number
Average Value
Number
Average Value
Number
Average Value
LOANS ORIGINATED
8
$189,298
139
$191,901
269
$152,345
57
$83,641
2
$394,440
16
$155,235
9
$95,543
APPLICATIONS APPROVED, NOT ACCEPTED
0
$0
24
$174,110
30
$163,492
1
$56,360
0
$0
5
$235,998
7
$64,287
APPLICATIONS DENIED
0
$0
15
$124,166
53
$152,711
20
$55,971
0
$0
1
$202,510
16
$84,325
APPLICATIONS WITHDRAWN
0
$0
9
$238,932
47
$168,692
1
$43,480
0
$0
2
$213,125
0
$0
FILES CLOSED FOR INCOMPLETENESS
0
$0
2
$398,295
19
$221,011
0
$0
0
$0
1
$151,780
0
$0
Aggregated Statistics For Year 2006 (Based on 6 partial tracts)
A) FHA, FSA/RHS & VA Home Purchase Loans
B) Conventional Home Purchase Loans
C) Refinancings
D) Home Improvement Loans
E) Loans on Dwellings For 5+ Families
F) Non-occupant Loans on < 5 Family Dwellings (A B C & D)
G) Loans On Manufactured Home Dwelling (A B C & D)
Number
Average Value
Number
Average Value
Number
Average Value
Number
Average Value
Number
Average Value
Number
Average Value
Number
Average Value
LOANS ORIGINATED
3
$251,200
156
$170,717
219
$168,380
73
$63,556
2
$400,355
27
$178,362
19
$73,565
APPLICATIONS APPROVED, NOT ACCEPTED
0
$0
34
$176,051
26
$122,910
7
$62,990
0
$0
4
$86,228
2
$37,470
APPLICATIONS DENIED
0
$0
27
$168,136
59
$156,149
15
$50,939
0
$0
3
$179,963
10
$67,576
APPLICATIONS WITHDRAWN
0
$0
26
$129,436
58
$148,451
6
$66,298
0
$0
1
$60,790
2
$143,195
FILES CLOSED FOR INCOMPLETENESS
0
$0
1
$90,990
4
$150,672
0
$0
0
$0
0
$0
0
$0
Aggregated Statistics For Year 2005 (Based on 6 partial tracts)
A) FHA, FSA/RHS & VA Home Purchase Loans
B) Conventional Home Purchase Loans
C) Refinancings
D) Home Improvement Loans
E) Loans on Dwellings For 5+ Families
F) Non-occupant Loans on < 5 Family Dwellings (A B C & D)
G) Loans On Manufactured Home Dwelling (A B C & D)
Number
Average Value
Number
Average Value
Number
Average Value
Number
Average Value
Number
Average Value
Number
Average Value
Number
Average Value
LOANS ORIGINATED
2
$159,430
197
$186,173
274
$170,772
61
$110,413
4
$208,068
17
$157,668
17
$70,386
APPLICATIONS APPROVED, NOT ACCEPTED
0
$0
18
$175,176
27
$152,249
4
$41,528
0
$0
1
$92,600
2
$133,125
APPLICATIONS DENIED
0
$0
29
$106,604
71
$242,913
15
$44,306
0
$0
3
$201,120
15
$69,544
APPLICATIONS WITHDRAWN
0
$0
27
$126,809
73
$171,755
8
$60,944
0
$0
2
$49,720
13
$57,139
FILES CLOSED FOR INCOMPLETENESS
0
$0
5
$146,168
27
$180,762
0
$0
0
$0
1
$42,680
1
$91,390
Aggregated Statistics For Year 2004 (Based on 6 partial tracts)
A) FHA, FSA/RHS & VA Home Purchase Loans
B) Conventional Home Purchase Loans
C) Refinancings
D) Home Improvement Loans
F) Non-occupant Loans on < 5 Family Dwellings (A B C & D)
G) Loans On Manufactured Home Dwelling (A B C & D)
Number
Average Value
Number
Average Value
Number
Average Value
Number
Average Value
Number
Average Value
Number
Average Value
LOANS ORIGINATED
1
$248,810
209
$177,516
348
$151,636
40
$86,897
31
$153,875
8
$101,148
APPLICATIONS APPROVED, NOT ACCEPTED
0
$0
18
$158,299
18
$122,438
6
$68,302
5
$84,336
2
$43,515
APPLICATIONS DENIED
1
$91,390
15
$151,476
73
$125,851
9
$48,757
13
$110,264
1
$46,700
APPLICATIONS WITHDRAWN
0
$0
32
$183,502
49
$140,743
4
$104,200
5
$125,992
0
$0
FILES CLOSED FOR INCOMPLETENESS
0
$0
7
$182,804
21
$173,224
2
$37,240
4
$254,908
0
$0
Aggregated Statistics For Year 2003 (Based on 4 partial tracts)
A) FHA, FSA/RHS & VA Home Purchase Loans
B) Conventional Home Purchase Loans
C) Refinancings
D) Home Improvement Loans
F) Non-occupant Loans on < 5 Family Dwellings (A B C & D)
Number
Average Value
Number
Average Value
Number
Average Value
Number
Average Value
Number
Average Value
LOANS ORIGINATED
0
$0
134
$150,608
747
$137,122
10
$21,891
41
$153,880
APPLICATIONS APPROVED, NOT ACCEPTED
0
$0
10
$109,654
53
$120,044
2
$9,860
6
$180,128
APPLICATIONS DENIED
0
$0
12
$77,244
79
$121,752
4
$22,188
2
$151,860
APPLICATIONS WITHDRAWN
2
$146,930
16
$120,304
49
$134,432
0
$0
8
$90,229
FILES CLOSED FOR INCOMPLETENESS
0
$0
0
$0
14
$127,771
4
$62,125
4
$119,810
Aggregated Statistics For Year 2002 (Based on 6 partial tracts)
A) FHA, FSA/RHS & VA Home Purchase Loans
B) Conventional Home Purchase Loans
C) Refinancings
D) Home Improvement Loans
E) Loans on Dwellings For 5+ Families
F) Non-occupant Loans on < 5 Family Dwellings (A B C & D)
Number
Average Value
Number
Average Value
Number
Average Value
Number
Average Value
Number
Average Value
Number
Average Value
LOANS ORIGINATED
6
$141,342
161
$142,039
463
$139,802
12
$22,601
2
$378,660
42
$150,840
APPLICATIONS APPROVED, NOT ACCEPTED
2
$145,945
8
$116,114
26
$110,882
0
$0
0
$0
0
$0
APPLICATIONS DENIED
0
$0
28
$70,373
34
$120,768
0
$0
0
$0
8
$92,694
APPLICATIONS WITHDRAWN
0
$0
13
$110,355
26
$118,221
0
$0
0
$0
4
$101,075
FILES CLOSED FOR INCOMPLETENESS
0
$0
6
$94,995
10
$179,076
0
$0
0
$0
0
$0
Aggregated Statistics For Year 2001 (Based on 6 partial tracts)
A) FHA, FSA/RHS & VA Home Purchase Loans
B) Conventional Home Purchase Loans
C) Refinancings
D) Home Improvement Loans
F) Non-occupant Loans on < 5 Family Dwellings (A B C & D)
Number
Average Value
Number
Average Value
Number
Average Value
Number
Average Value
Number
Average Value
LOANS ORIGINATED
8
$144,576
105
$117,851
364
$130,330
8
$11,622
18
$115,812
APPLICATIONS APPROVED, NOT ACCEPTED
2
$127,205
6
$60,152
18
$121,031
0
$0
0
$0
APPLICATIONS DENIED
4
$119,470
36
$73,656
22
$170,120
8
$13,559
4
$140,025
APPLICATIONS WITHDRAWN
4
$83,818
10
$133,321
36
$87,609
2
$14,790
2
$146,855
FILES CLOSED FOR INCOMPLETENESS
0
$0
4
$87,762
10
$91,394
0
$0
0
$0
Aggregated Statistics For Year 2000 (Based on 6 partial tracts)
A) FHA, FSA/RHS & VA Home Purchase Loans
B) Conventional Home Purchase Loans
C) Refinancings
D) Home Improvement Loans
F) Non-occupant Loans on < 5 Family Dwellings (A B C & D)
Number
Average Value
Number
Average Value
Number
Average Value
Number
Average Value
Number
Average Value
LOANS ORIGINATED
14
$104,098
141
$128,670
53
$96,764
8
$11,834
12
$82,709
APPLICATIONS APPROVED, NOT ACCEPTED
6
$116,360
8
$75,684
13
$117,102
8
$35,252
0
$0
APPLICATIONS DENIED
0
$0
19
$69,145
52
$69,538
8
$55,715
4
$71,492
APPLICATIONS WITHDRAWN
4
$136,378
12
$91,214
26
$67,586
4
$17,258
4
$116,852
FILES CLOSED FOR INCOMPLETENESS
2
$118,330
0
$0
4
$51,340
0
$0
2
$56,210
Aggregated Statistics For Year 1999 (Based on 3 partial tracts)
A) FHA, FSA/RHS & VA Home Purchase Loans
B) Conventional Home Purchase Loans
C) Refinancings
D) Home Improvement Loans
F) Non-occupant Loans on < 5 Family Dwellings (A B C & D)
Detailed PMIC statistics for the following Tracts:0029.00
, 0030.00
2002 - 2018 National Fire Incident Reporting System (NFIRS) incidents
Based on the data from the years 2002 - 2018 the average number of fire incidents per year is 9. The highest number of fires - 22 took place in 2017, and the least - 1 in 2011. The data has a growing trend.
When looking into fire subcategories, the most reports belonged to: Structure Fires (62.3%), and Outside Fires (21.9%).
Fire incident types reported to NFIRS in Zip Code 05477


 Nearest zip codes: 05465, 05462, 05495, 05452, 05461, 05489.


 Based on the data from the years 2002 - 2018 the average number of fire incidents per year is 9. The highest number of fires - 22 took place in 2017, and the least - 1 in 2011. The data has a growing trend.
 When looking into fire subcategories, the most reports belonged to: Structure Fires (62.3%), and Outside Fires (21.9%).