Estimated zip code population in 2022: 1,744 Zip code population in 2010: 1,498 Zip code population in 2000: 1,540
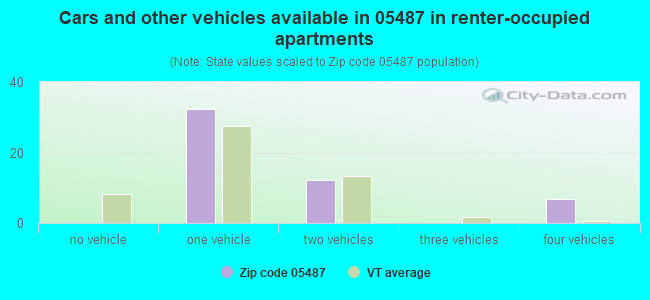
Houses and condos: 689 Renter-occupied apartments: 52
% of renters here:
8%
State:
26%
March 2022 cost of living index in zip code 05487: 93.1 (less than average, U.S. average is 100)
Land area: 45.0 sq. mi. Water area: 0.1 sq. mi.
Population density: 39 people per square mile
(very low).
OSM Map
Google Map
MSN Map
OSM Map
General Map
Google Map
MSN Map
OSM Map
Google Map
MSN Map
OSM Map
Google Map
MSN Map
Please wait while loading the map...
Real estate property taxes paid for housing units in 2022:
This zip code:
1.5% ($4,056)
Vermont:
1.6% ($4,787)
Median real estate property taxes paid for housing units with mortgages in 2022: $4,811 (1.4%) Median real estate property taxes paid for housing units with no mortgage in 2022: $2,945 (1.3%)
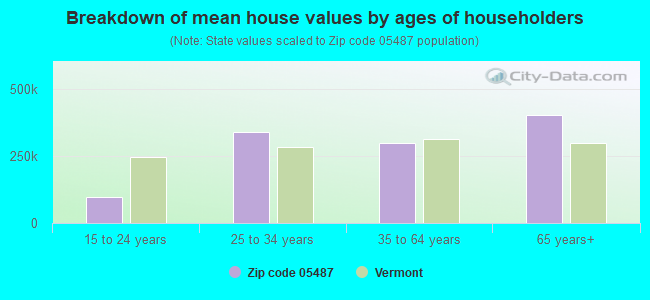
Estimated median house/condo value in 2022: $269,689
05487:
$269,689
Vermont:
$304,700
According to our research of Vermont and other state lists, there were 3 registered sex offenders living in 05487 zip code as of May 23, 2024. The ratio of all residents to sex offenders in zip code 05487 is 497 to 1. The ratio of registered sex offenders to all residents in this zip code is near the state average.
Median resident age:
This zip code:
37.4 years
Vermont median age:
43.2 years
Average household size:
This zip code:
2.8 people
Vermont:
2.2 people
Averages for the 2020 tax year for zip code 05487, filed in 2021:
Average Adjusted Gross Income (AGI) in 2020: $58,595 (Individual Income Tax Returns)
Here:
$58,595
State:
$70,107
Salary/wage: $47,352 (reported on 84.2% of returns)
Here:
$47,352
State:
$56,381
(% of AGI for various income ranges: 1249.3% for AGIs below $25k, 3540.0% for AGIs $25k-50k, 6708.8% for AGIs $50k-75k, 8714.0% for AGIs $75k-100k, 17258.3% for AGIs $100k-200k)
Taxable interest for individuals: $504 (reported on 30.3% of returns)
This zip code:
$504
Vermont:
$1,276
(% of AGI for various income ranges: 7.3% for AGIs below $25k, 6.2% for AGIs $25k-50k, 10.0% for AGIs $50k-75k, 28.0% for AGIs $75k-100k, 121.7% for AGIs $100k-200k)
Ordinary dividends: $4,914 (reported on 18.4% of returns)
Here:
$4,914
State:
$8,930
(% of AGI for various income ranges: 18.7% for AGIs below $25k, 50.0% for AGIs $25k-50k, 226.0% for AGIs $75k-100k, 778.3% for AGIs $100k-200k)
Net capital gain/loss in AGI: +$12,667 (reported on 19.7% of returns)
Here:
+$12,667
State:
+$19,777
(% of AGI for various income ranges: 88.1% for AGIs $25k-50k, 278.0% for AGIs $75k-100k, 2700.0% for AGIs $100k-200k)
Profit/loss from business: +$12,727 (reported on 19.7% of returns)
Here:
+$12,727
State:
+$15,467
(% of AGI for various income ranges: 140.7% for AGIs below $25k, 188.1% for AGIs $25k-50k, 653.8% for AGIs $50k-75k, 1456.7% for AGIs $100k-200k)
Taxable individual retirement arrangement distribution: $14,717 (reported on 7.9% of returns)
05487:
$14,717
Vermont:
$17,245
(% of AGI for various income ranges: 244.0% for AGIs below $25k, 1034.0% for AGIs $75k-100k)
Total itemized deductions: $24,575 (reported on 5.3% of returns)
Here:
$24,575
State:
$33,390
(% of AGI for various income ranges: 1966.0% for AGIs $75k-100k)
Taxes paid: $7,425 (reported on 5.3% of returns)
05487:
$7,425
State:
$8,349
(% of AGI for various income ranges: 594.0% for AGIs $75k-100k)
Earned income credit: $1,673 (reported on 14.5% of returns)
Here:
$1,673
State:
$1,839
(% of AGI for various income ranges: 75.3% for AGIs below $25k, 44.4% for AGIs $25k-50k)
Percentage of individuals using paid preparers for their 2020 taxes: 90.8%
Here:
91%
State:
93%
(% for various income ranges: 91.7% for AGIs below $25k, 90.0% for AGIs $25k-50k, 83.3% for AGIs $50k-75k, 100.0% for AGIs $75k-100k, 90.9% for AGIs $100k-200k, 100.0% for AGIs over 200k)
Averages for the 2012 tax year for zip code 05487, filed in 2013:
Average Adjusted Gross Income (AGI) in 2012: $48,507 (Individual Income Tax Returns)
Here:
$48,507
State:
$55,225
Salary/wage: $40,409 (reported on 90.8% of returns)
Here:
$40,409
State:
$44,925
(% of AGI for various income ranges: 80.4% for AGIs below $25k, 85.1% for AGIs $25k-50k, 81.8% for AGIs $50k-75k, 80.7% for AGIs $75k-100k, 62.9% for AGIs $100k-200k)
Taxable interest for individuals: $528 (reported on 32.9% of returns)
This zip code:
$528
Vermont:
$1,237
(% of AGI for various income ranges: 0.9% for AGIs below $25k, 0.4% for AGIs $25k-50k, 0.5% for AGIs $50k-75k, 0.2% for AGIs $75k-100k, 0.2% for AGIs $100k-200k)
Ordinary dividends: $3,500 (reported on 21.1% of returns)
Here:
$3,500
State:
$7,010
(% of AGI for various income ranges: 0.6% for AGIs below $25k, 1.3% for AGIs $25k-50k, 0.6% for AGIs $50k-75k, 0.9% for AGIs $75k-100k, 2.7% for AGIs $100k-200k)
Net capital gain/loss in AGI: +$8,227 (reported on 14.5% of returns)
Here:
+$8,227
State:
+$13,197
(% of AGI for various income ranges: 2.5% for AGIs $50k-75k, 5.8% for AGIs $100k-200k)
Profit/loss from business: +$11,146 (reported on 17.1% of returns)
Here:
+$11,146
State:
+$12,941
(% of AGI for various income ranges: 7.9% for AGIs below $25k, 6.0% for AGIs $25k-50k, 9.9% for AGIs $50k-75k, 0.3% for AGIs $100k-200k)
Taxable individual retirement arrangement distribution: $9,540 (reported on 6.6% of returns)
05487:
$9,540
Vermont:
$12,934
Total itemized deductions: $18,032 (20% of AGI, reported on 28.9% of returns)
Here:
$18,032
State:
$22,572
Here:
20.4% of AGI
State:
19.9% of AGI
(% of AGI for various income ranges: 8.2% for AGIs below $25k, 7.1% for AGIs $25k-50k, 10.8% for AGIs $50k-75k, 11.2% for AGIs $75k-100k, 13.5% for AGIs $100k-200k)
Charity contributions: $1,913 (reported on 19.7% of returns)
Here:
$1,913
State:
$3,170
(% of AGI for various income ranges: 0.7% for AGIs below $25k, 0.9% for AGIs $50k-75k, 0.6% for AGIs $75k-100k, 1.3% for AGIs $100k-200k)
Taxes paid: $7,541 (reported on 28.9% of returns)
05487:
$7,541
State:
$10,425
(% of AGI for various income ranges: 2.3% for AGIs below $25k, 1.9% for AGIs $25k-50k, 4.0% for AGIs $50k-75k, 4.8% for AGIs $75k-100k, 6.8% for AGIs $100k-200k)
Earned income credit: $1,938 (reported on 17.1% of returns)
Here:
$1,938
State:
$1,828
(% of AGI for various income ranges: 5.1% for AGIs below $25k, 0.9% for AGIs $25k-50k)
Percentage of individuals using paid preparers for their 2012 taxes: 44.7%
Here:
45%
State:
49%
(% for various income ranges: 37.9% for AGIs below $25k, 47.6% for AGIs $25k-50k, 45.5% for AGIs $50k-75k, 42.9% for AGIs $75k-100k, 62.5% for AGIs $100k-200k)
Averages for the 2004 tax year for zip code 05487, filed in 2005:
Average Adjusted Gross Income (AGI) in 2004: $38,881 (Individual Income Tax Returns)
Here:
$38,881
State:
$44,564
Salary/wage: $35,363 (reported on 90.1% of returns)
Here:
$35,363
State:
$37,522
(% of AGI for various income ranges: 69.6% for AGIs below $10k, 82.0% for AGIs $10k-25k, 89.0% for AGIs $25k-50k, 89.5% for AGIs $50k-75k, 88.5% for AGIs $75k-100k, 61.4% for AGIs over 100k)
Taxable interest for individuals: $638 (reported on 44.1% of returns)
This zip code:
$638
Vermont:
$1,373
(% of AGI for various income ranges: 2.9% for AGIs below $10k, 1.9% for AGIs $10k-25k, 0.8% for AGIs $25k-50k, 0.3% for AGIs $50k-75k, 0.3% for AGIs $75k-100k, 0.5% for AGIs over 100k)
Taxable dividends: $2,469 (reported on 22.6% of returns)
Here:
$2,469
State:
$4,037
(% of AGI for various income ranges: 3.8% for AGIs below $10k, 1.7% for AGIs $10k-25k, 1.2% for AGIs $25k-50k, 0.9% for AGIs $50k-75k, 0.2% for AGIs $75k-100k, 2.8% for AGIs over 100k)
Net capital gain/loss: +$5,544 (reported on 17.7% of returns)
Here:
+$5,544
State:
+$11,311
(% of AGI for various income ranges: 0.6% for AGIs below $10k, 0.4% for AGIs $10k-25k, 0.3% for AGIs $25k-50k, 0.3% for AGIs $50k-75k, 3.3% for AGIs $75k-100k, 8.5% for AGIs over 100k)
Profit/loss from business: +$7,352 (reported on 17.3% of returns)
Here:
+$7,352
State:
+$11,197
(% of AGI for various income ranges: 9.6% for AGIs below $10k, 7.4% for AGIs $10k-25k, 3.2% for AGIs $25k-50k, 2.8% for AGIs $50k-75k, 4.4% for AGIs $75k-100k)
IRA payment deduction: $1,600 (reported on 2.1% of returns)
05487:
$1,600
Vermont:
$3,004
Total itemized deductions: $14,312 (21% of AGI, reported on 28.1% of returns)
Here:
$14,312
State:
$17,791
Here:
21.3% of AGI
State:
20.0% of AGI
(% of AGI for various income ranges: 8.0% for AGIs $10k-25k, 7.7% for AGIs $25k-50k, 12.0% for AGIs $50k-75k, 12.0% for AGIs $75k-100k, 13.2% for AGIs over 100k)
Charity contributions deductions: $1,358 (2% of AGI, reported on 20.9% of returns)
Here:
$1,358
State:
$2,686
Here:
1.8% of AGI
State:
2.8% of AGI
(% of AGI for various income ranges: 0.2% for AGIs $10k-25k, 0.3% for AGIs $25k-50k, 1.1% for AGIs $50k-75k, 1.1% for AGIs $75k-100k, 1.1% for AGIs over 100k)
Total tax: $4,522 (reported on 77.5% of returns)
05487:
$4,522
State:
$6,533
(% of AGI for various income ranges: 3.0% for AGIs below $10k, 4.8% for AGIs $10k-25k, 7.2% for AGIs $25k-50k, 8.2% for AGIs $50k-75k, 9.5% for AGIs $75k-100k, 14.7% for AGIs over 100k)
Earned income credit: $1,561 (reported on 17.4% of returns)
Here:
$1,561
State:
$1,432
Percentage of individuals using paid preparers for their 2004 taxes: 48.8%
Here:
49%
State:
54%
(% for various income ranges: 43.0% for AGIs below $10k, 46.9% for AGIs $10k-25k, 50.2% for AGIs $25k-50k, 55.0% for AGIs $50k-75k, 46.9% for AGIs $75k-100k, 54.8% for AGIs over 100k)
Household received Food Stamps/SNAP in the past 12 months: 110 Household did not receive Food Stamps/SNAP in the past 12 months: 514
Women who had a birth in the past 12 months: 35 (34 now married, 0 unmarried) Women who did not have a birth in the past 12 months: 348 (149 now married, 198 unmarried)
Housing units in zip code 05487 with a mortgage: 311 (36 second mortgage, 31 both second mortgage and home equity loan) Houses without a mortgage: 3
Median monthly owner costs for units with a mortgage: $1,661 Median monthly owner costs for units without a mortgage: $633
Residents with income below the poverty level in 2022:
This zip code:
7.5%
Whole state:
10.4%
Residents with income below 50% of the poverty level in 2022:
This zip code:
4.1%
Whole state:
6.1%
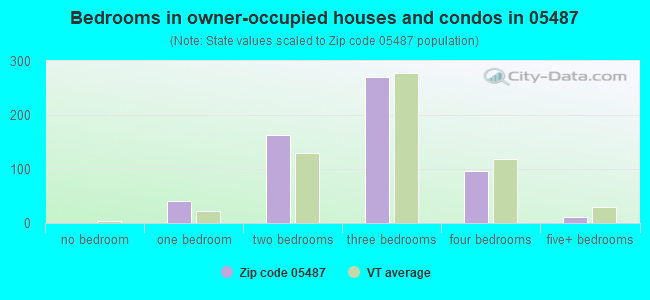
Median number of rooms in houses and condos:
Here:
5.6
State:
6.4
Median number of rooms in apartments:
Here:
3.2
State:
3.9
Notable locations in this zip code not listed on our city pages
Cemeteries: Little Ireland Cemetery (1), Butler Cemetery (2), Taft Cemetery (3), Village Cemetery (4), Gore Cemetery (5), Green Mount Cemetery (6), Hallock Cemetery (7). Display/hide their locations on the map
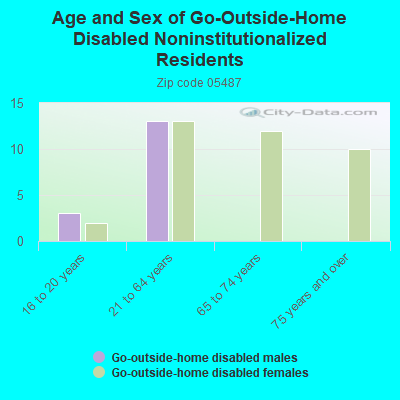
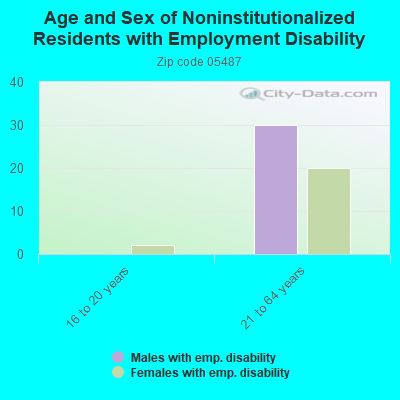
In group quarters: 5 (-1 institutionalized population)
Size of family households: 181 2-persons, 85 3-persons, 63 4-persons, 72 5-persons, 9 6-persons, 8 7-or-more-persons
Size of nonfamily households: 123 1-person, 74 2-persons, 8 3-persons
358 married couples with children.
41 single-parent households (19 men, 22 women).
96.6% of residents of 05487 zip code speak English at home.
1.8% of residents speak Spanish at home (58% very well, 42% well).
0.9% of residents speak other Indo-European language at home (93% very well, 7% well).
0.1% of residents speak other language at home (100% very well).
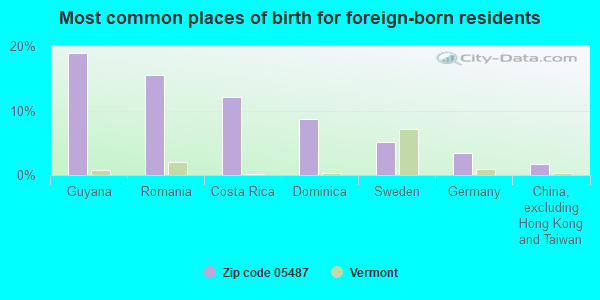
Foreign born population: 57 (3.3%) (79.8% of them are naturalized citizens)
This zip code:
3.3%
Whole state:
4.2%
19%Guyana
16%Romania
12%Costa Rica
9%Dominica
5%Sweden
3%Germany
2%China, excluding Hong Kong and Taiwan
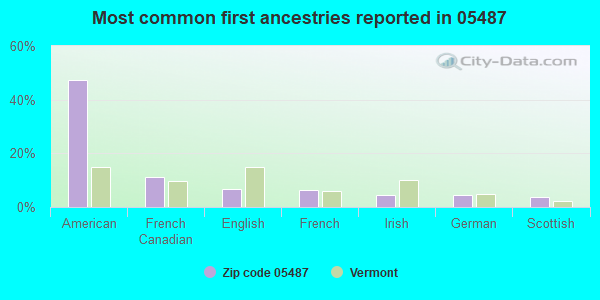
47%American
11%French Canadian
7%English
6%French
5%Irish
4%German
4%Scottish
Year of entry for the foreign-born population
02010 or later
112000 to 2009
291990 to 1999
29Before 1990
Facilities with environmental interests located in this zip code:
ROBINSON SCHOOL (41 PARSONAGE ROAD in STARKSBORO, VT)
(National Center for Education Statistics) - STATE ID-PS246 Organizations: STARKSBORO (SCHOOL DISTRICT)
Housing units lacking complete plumbing facilities: 1.7% Housing units lacking complete kitchen facilities: 1.7%
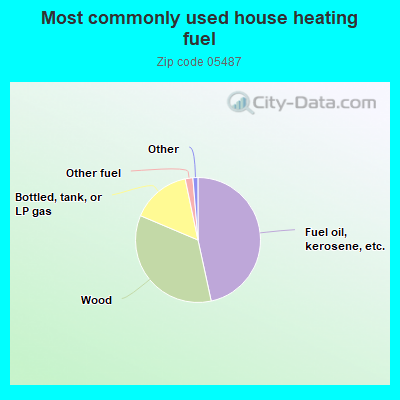
46.8%Fuel oil, kerosene, etc.
34.9%Wood
15.4%Bottled, tank, or LP gas
2.0%Other fuel
0.8%Electricity
0.5%Utility gas
Population in 1990: 1,020. Population change in the 1990s: +520 (+51.0%).
Place of birth for U.S.-born residents:
This state: 1,099
Northeast: 334
Midwest: 110
South: 62
West: 55
72% of the 05487 zip code residents lived in the same house 5 years ago. Out of people who lived in different houses, 33% lived in this county. Out of people who lived in different counties, 50% lived in Vermont.
97% of the 05487 zip code residents lived in the same house 1 year ago. Out of people who lived in different houses, 62% moved from this county. Out of people who lived in different houses, 29% moved from different county within same state. Out of people who lived in different houses, 9% moved from different state.
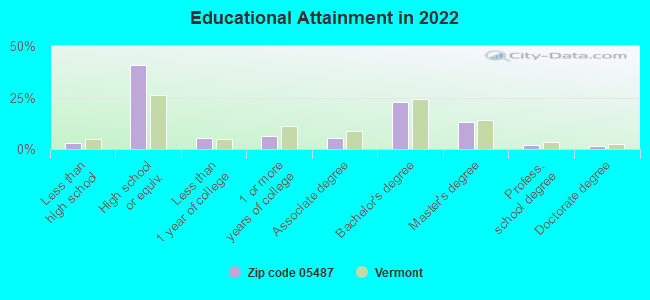
Private vs. public school enrollment:
Students in private schools in grades 1 to 8 (elementary and middle school):
Here:
0.0%
Vermont:
10.3%
Students in private schools in grades 9 to 12 (high school): 6
Here:
3.7%
Vermont:
11.6%
Students in private undergraduate colleges: 3
Here:
18.8%
Vermont:
29.2%
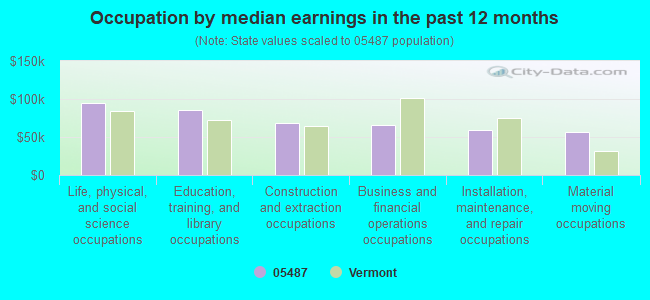
Occupation by median earnings in the past 12 months ($)
94,104Life, physical, and social science occupations
85,351Education, training, and library occupations
68,033Construction and extraction occupations
65,265Business and financial operations occupations
59,483Installation, maintenance, and repair occupations
56,407Material moving occupations
Top industries in this zip code by the number of employees in 2005:
Health Care and Social Assistance: Offices of Physical, Occupational and Speech Therapists, and Audiologists (10-19 employees: 1 establishment)
Construction: Site Preparation Contractors (1-4: 2)
Professional, Scientific, and Technical Services: Other Computer Related Services (1-4: 1)
Construction: New Single-Family Housing Construction (except Operative Builders) (1-4: 1)
Wholesale Trade: Wholesale Trade Agents and Brokers (1-4: 1)
Construction: Painting and Wall Covering Contractors (1-4: 1)
People in group quarters in 2010:
3 people in residential treatment centers for adults
Fatal accident statistics in 2014:
Fatal accident count: 1
Vehicles involved in fatal accidents: 1
Fatal accidents caused by drunken drivers: 0
Fatalities: 1
Persons involved in fatal accidents: 1
Pedestrians involved in fatal accidents: 0
2002 - 2018 National Fire Incident Reporting System (NFIRS) incidents
Based on the data from the years 2002 - 2018 the average number of fires per year is 7. The highest number of fire incidents - 14 took place in 2004, and the least - 0 in 2011. The data has a dropping trend.
When looking into fire subcategories, the most incidents belonged to: Structure Fires (77.7%), and Outside Fires (14.3%).
Fire incident types reported to NFIRS in Zip Code 05487


 Nearest zip codes: 05462, 05443, 05461, 05673, 05674, 05676.


 Based on the data from the years 2002 - 2018 the average number of fires per year is 7. The highest number of fire incidents - 14 took place in 2004, and the least - 0 in 2011. The data has a dropping trend.
 When looking into fire subcategories, the most incidents belonged to: Structure Fires (77.7%), and Outside Fires (14.3%).