Estimated zip code population in 2022: 1,175 Zip code population in 2010: 1,136 Zip code population in 2000: 1,047
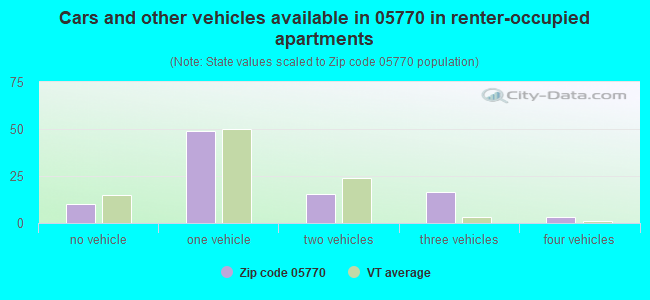
Houses and condos: 558 Renter-occupied apartments: 97
% of renters here:
20%
State:
26%
March 2022 cost of living index in zip code 05770: 92.7 (less than average, U.S. average is 100)
Land area: 41.3 sq. mi. Water area: 0.2 sq. mi.
Population density: 28 people per square mile
(very low).
OSM Map
Google Map
MSN Map
OSM Map
General Map
Google Map
MSN Map
OSM Map
Google Map
MSN Map
OSM Map
Google Map
MSN Map
Please wait while loading the map...
Real estate property taxes paid for housing units in 2022:
This zip code:
1.4% ($4,530)
Vermont:
1.6% ($4,787)
Median real estate property taxes paid for housing units with mortgages in 2022: $4,292 (1.5%) Median real estate property taxes paid for housing units with no mortgage in 2022: $5,097 (1.3%)
Business Search- 14 Million verified businesses
Males: 520
(44.3%)
Females: 655
(55.7%)
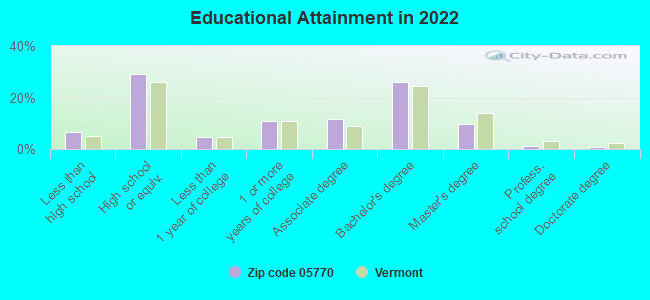
For population 25 years and over in 05770:
High school or higher: 91.4%
Bachelor's degree or higher: 36.6%
Graduate or professional degree: 11.4%
Unemployed: 2.6%
Mean travel time to work (commute): 26.6 minutes
For population 15 years and over in 05770:
Never married: 19.1%
Now married: 61.7%
Separated: 1.6%
Widowed: 5.1%
Divorced: 12.4%
Zip code 05770 compared to state average:
Black race population percentage significantly below state average.
Median age significantly above state average.
Foreign-born population percentage below state average.
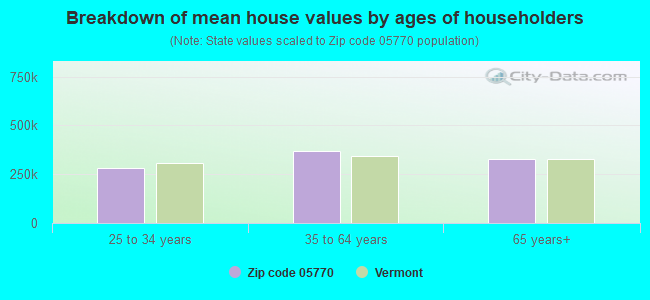
Estimated median house/condo value in 2022: $313,425
05770:
$313,425
Vermont:
$304,700
According to our research of Vermont and other state lists, there were 2 registered sex offenders living in 05770 zip code as of May 23, 2024. The ratio of all residents to sex offenders in zip code 05770 is 526 to 1. The ratio of registered sex offenders to all residents in this zip code is near the state average.
Median resident age:
This zip code:
52.4 years
Vermont median age:
43.2 years
Average household size:
This zip code:
2.4 people
Vermont:
2.2 people
Averages for the 2020 tax year for zip code 05770, filed in 2021:
Average Adjusted Gross Income (AGI) in 2020: $63,181 (Individual Income Tax Returns)
Here:
$63,181
State:
$70,107
Salary/wage: $50,013 (reported on 78.0% of returns)
Here:
$50,013
State:
$56,381
(% of AGI for various income ranges: 1211.1% for AGIs below $25k, 3990.0% for AGIs $25k-50k, 6460.0% for AGIs $50k-75k, 9620.0% for AGIs $75k-100k, 24300.0% for AGIs $100k-200k)
Taxable interest for individuals: $882 (reported on 37.3% of returns)
This zip code:
$882
Vermont:
$1,276
(% of AGI for various income ranges: 22.2% for AGIs below $25k, 48.3% for AGIs $25k-50k, 64.3% for AGIs $50k-75k, 33.3% for AGIs $75k-100k, 152.5% for AGIs $100k-200k)
Ordinary dividends: $8,086 (reported on 23.7% of returns)
Here:
$8,086
State:
$8,930
(% of AGI for various income ranges: 280.0% for AGIs $25k-50k, 365.7% for AGIs $50k-75k, 1350.0% for AGIs $100k-200k)
Net capital gain/loss in AGI: +$32,943 (reported on 23.7% of returns)
Here:
+$32,943
State:
+$19,777
(% of AGI for various income ranges: 213.3% for AGIs $25k-50k, 387.1% for AGIs $50k-75k, 10212.5% for AGIs $100k-200k)
Profit/loss from business: +$8,878 (reported on 15.3% of returns)
Here:
+$8,878
State:
+$15,467
(% of AGI for various income ranges: 271.1% for AGIs below $25k, 275.0% for AGIs $25k-50k, 750.0% for AGIs $75k-100k)
Taxable individual retirement arrangement distribution: $8,733 (reported on 10.2% of returns)
05770:
$8,733
Vermont:
$17,245
(% of AGI for various income ranges: 253.3% for AGIs below $25k, 422.9% for AGIs $50k-75k)
Total itemized deductions: $26,467 (reported on 5.1% of returns)
Here:
$26,467
State:
$33,390
(% of AGI for various income ranges: 661.7% for AGIs $25k-50k)
Taxes paid: $7,400 (reported on 5.1% of returns)
05770:
$7,400
State:
$8,349
(% of AGI for various income ranges: 185.0% for AGIs $25k-50k)
Earned income credit: $2,043 (reported on 11.9% of returns)
Here:
$2,043
State:
$1,839
(% of AGI for various income ranges: 97.8% for AGIs below $25k, 45.8% for AGIs $25k-50k)
Percentage of individuals using paid preparers for their 2020 taxes: 93.2%
Here:
93%
State:
93%
(% for various income ranges: 93.8% for AGIs below $25k, 94.4% for AGIs $25k-50k, 90.9% for AGIs $50k-75k, 80.0% for AGIs $75k-100k, 100.0% for AGIs $100k-200k, 100.0% for AGIs over 200k)
Averages for the 2012 tax year for zip code 05770, filed in 2013:
Average Adjusted Gross Income (AGI) in 2012: $50,952 (Individual Income Tax Returns)
Here:
$50,952
State:
$55,225
Salary/wage: $40,887 (reported on 81.0% of returns)
Here:
$40,887
State:
$44,925
(% of AGI for various income ranges: 70.4% for AGIs below $25k, 74.4% for AGIs $25k-50k, 75.9% for AGIs $50k-75k, 70.7% for AGIs $75k-100k, 49.6% for AGIs $100k-200k)
Taxable interest for individuals: $1,058 (reported on 41.4% of returns)
This zip code:
$1,058
Vermont:
$1,237
(% of AGI for various income ranges: 1.3% for AGIs below $25k, 1.0% for AGIs $25k-50k, 1.3% for AGIs $50k-75k, 0.3% for AGIs $75k-100k, 0.7% for AGIs $100k-200k)
Ordinary dividends: $8,625 (reported on 27.6% of returns)
Here:
$8,625
State:
$7,010
(% of AGI for various income ranges: 4.0% for AGIs below $25k, 2.7% for AGIs $25k-50k, 3.4% for AGIs $50k-75k, 4.4% for AGIs $75k-100k, 6.7% for AGIs $100k-200k)
Net capital gain/loss in AGI: +$12,983 (reported on 20.7% of returns)
Here:
+$12,983
State:
+$13,197
(% of AGI for various income ranges: 3.4% for AGIs below $25k, 8.1% for AGIs $50k-75k, 4.1% for AGIs $75k-100k, 7.5% for AGIs $100k-200k)
Profit/loss from business: +$11,882 (reported on 19.0% of returns)
Here:
+$11,882
State:
+$12,941
(% of AGI for various income ranges: 12.8% for AGIs below $25k, 5.2% for AGIs $25k-50k, 3.5% for AGIs $50k-75k, 8.8% for AGIs $75k-100k)
Taxable individual retirement arrangement distribution: $7,783 (reported on 10.3% of returns)
05770:
$7,783
Vermont:
$12,934
Total itemized deductions: $22,465 (24% of AGI, reported on 29.3% of returns)
Here:
$22,465
State:
$22,572
Here:
24.4% of AGI
State:
19.9% of AGI
(% of AGI for various income ranges: 14.0% for AGIs $25k-50k, 8.9% for AGIs $50k-75k, 10.8% for AGIs $75k-100k, 19.0% for AGIs $100k-200k)
Charity contributions: $3,200 (reported on 20.7% of returns)
Here:
$3,200
State:
$3,170
(% of AGI for various income ranges: 1.4% for AGIs $25k-50k, 1.5% for AGIs $75k-100k, 2.2% for AGIs $100k-200k)
Taxes paid: $9,024 (reported on 29.3% of returns)
05770:
$9,024
State:
$10,425
(% of AGI for various income ranges: 4.0% for AGIs $25k-50k, 3.4% for AGIs $50k-75k, 4.0% for AGIs $75k-100k, 8.7% for AGIs $100k-200k)
Earned income credit: $1,689 (reported on 15.5% of returns)
Here:
$1,689
State:
$1,828
(% of AGI for various income ranges: 3.8% for AGIs below $25k, 1.1% for AGIs $25k-50k)
Percentage of individuals using paid preparers for their 2012 taxes: 65.5%
Here:
66%
State:
49%
(% for various income ranges: 59.1% for AGIs below $25k, 64.3% for AGIs $25k-50k, 66.7% for AGIs $50k-75k, 71.4% for AGIs $75k-100k, 83.3% for AGIs $100k-200k)
Averages for the 2004 tax year for zip code 05770, filed in 2005:
Average Adjusted Gross Income (AGI) in 2004: $42,952 (Individual Income Tax Returns)
Here:
$42,952
State:
$44,564
Salary/wage: $33,956 (reported on 85.4% of returns)
Here:
$33,956
State:
$37,522
(% of AGI for various income ranges: 160.0% for AGIs below $10k, 75.9% for AGIs $10k-25k, 78.2% for AGIs $25k-50k, 81.5% for AGIs $50k-75k, 65.8% for AGIs $75k-100k, 41.5% for AGIs over 100k)
Taxable interest for individuals: $1,834 (reported on 50.3% of returns)
This zip code:
$1,834
Vermont:
$1,373
(% of AGI for various income ranges: 9.9% for AGIs below $10k, 2.4% for AGIs $10k-25k, 2.2% for AGIs $25k-50k, 1.2% for AGIs $50k-75k, 1.1% for AGIs $75k-100k, 3.0% for AGIs over 100k)
Taxable dividends: $5,050 (reported on 27.2% of returns)
Here:
$5,050
State:
$4,037
(% of AGI for various income ranges: 6.3% for AGIs below $10k, 1.2% for AGIs $10k-25k, 2.7% for AGIs $25k-50k, 3.0% for AGIs $50k-75k, 3.4% for AGIs $75k-100k, 4.2% for AGIs over 100k)
Net capital gain/loss: +$8,419 (reported on 25.1% of returns)
Here:
+$8,419
State:
+$11,311
(% of AGI for various income ranges: -4.8% for AGIs below $10k, 3.8% for AGIs $10k-25k, 1.8% for AGIs $25k-50k, 1.4% for AGIs $50k-75k, 8.6% for AGIs $75k-100k, 9.3% for AGIs over 100k)
Profit/loss from business: +$8,584 (reported on 17.1% of returns)
Here:
+$8,584
State:
+$11,197
(% of AGI for various income ranges: 9.6% for AGIs below $10k, 9.6% for AGIs $10k-25k, 6.3% for AGIs $25k-50k, 3.8% for AGIs $50k-75k, 0.4% for AGIs $75k-100k)
Total itemized deductions: $18,813 (23% of AGI, reported on 28.2% of returns)
Here:
$18,813
State:
$17,791
Here:
22.6% of AGI
State:
20.0% of AGI
(% of AGI for various income ranges: 10.3% for AGIs $10k-25k, 8.5% for AGIs $25k-50k, 12.6% for AGIs $50k-75k, 16.5% for AGIs $75k-100k, 14.2% for AGIs over 100k)
Charity contributions deductions: $3,415 (4% of AGI, reported on 22.1% of returns)
Here:
$3,415
State:
$2,686
Here:
3.7% of AGI
State:
2.8% of AGI
(% of AGI for various income ranges: 1.6% for AGIs $10k-25k, 0.5% for AGIs $25k-50k, 1.2% for AGIs $50k-75k, 1.1% for AGIs $75k-100k, 3.6% for AGIs over 100k)
Total tax: $6,138 (reported on 77.6% of returns)
05770:
$6,138
State:
$6,533
(% of AGI for various income ranges: 5.7% for AGIs below $10k, 5.1% for AGIs $10k-25k, 6.7% for AGIs $25k-50k, 8.3% for AGIs $50k-75k, 11.1% for AGIs $75k-100k, 19.0% for AGIs over 100k)
Earned income credit: $1,588 (reported on 11.5% of returns)
Here:
$1,588
State:
$1,432
Percentage of individuals using paid preparers for their 2004 taxes: 70.3%
Here:
70%
State:
54%
(% for various income ranges: 63.9% for AGIs below $10k, 71.3% for AGIs $10k-25k, 68.3% for AGIs $25k-50k, 77.5% for AGIs $50k-75k, 75.0% for AGIs $75k-100k, 69.7% for AGIs over 100k)
Likely homosexual households (counted as self-reported same-sex unmarried-partner households)
Lesbian couples: 0.0% of all households
Gay men: 0.3% of all households
Household received Food Stamps/SNAP in the past 12 months: 56 Household did not receive Food Stamps/SNAP in the past 12 months: 430
Women who had a birth in the past 12 months: 52 (46 now married, 4 unmarried) Women who did not have a birth in the past 12 months: 176 (101 now married, 76 unmarried)
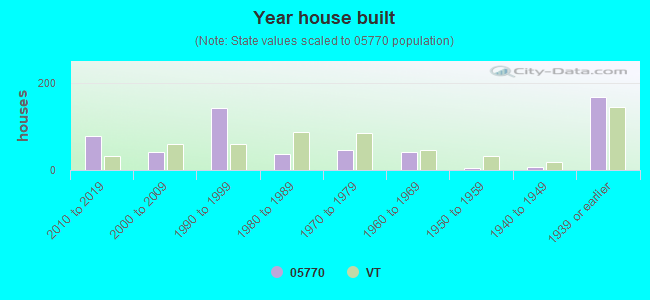
Housing units in zip code 05770 with a mortgage: 266 (14 second mortgage, 1 home equity loan, 10 both second mortgage and home equity loan) Houses without a mortgage: 16
Median monthly owner costs for units with a mortgage: $1,454 Median monthly owner costs for units without a mortgage: $854
Residents with income below the poverty level in 2022:
This zip code:
8.4%
Whole state:
10.4%
Residents with income below 50% of the poverty level in 2022:
This zip code:
5.5%
Whole state:
6.1%
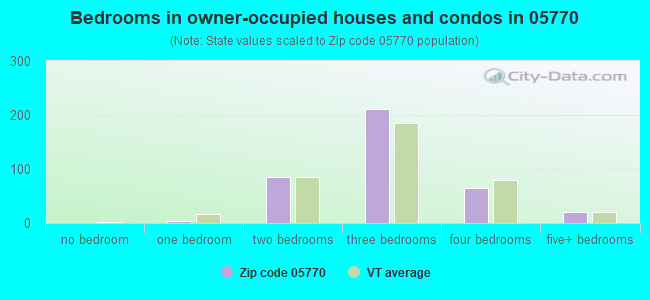
Median number of rooms in houses and condos:
Here:
5.8
State:
6.4
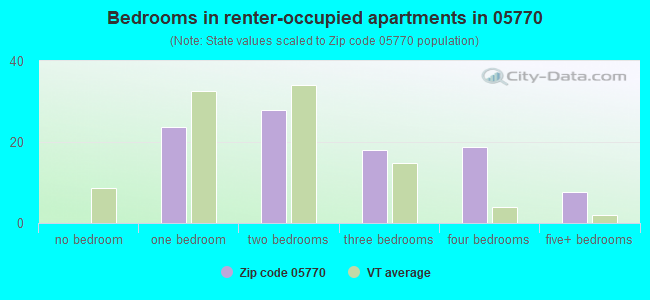
Median number of rooms in apartments:
Here:
4.2
State:
3.9
Notable locations in this zip code not listed on our city pages
Notable locations in zip code 05770: Larrabees Point Station (A), Platt Memorial Library (B), Larrabees Point Complex (C), Shoreham Fire Department (D). Display/hide their locations on the map
Churches in zip code 05770 include: Shoreham Congregational Church (A), Saint Genevieve Church (B), All Saint Chapel (C). Display/hide their locations on the map
Cemeteries: East Shoreham Cemetery (1), Lakeview Cemetery (2), Lapell Cemetery (3), Callender Cemetery (4), Jennison Cemetery (5), Knapp Cemetery (6), Rich Family Cemetery (7). Display/hide their locations on the map
Size of family households: 178 2-persons, 75 3-persons, 64 4-persons, 32 5-persons, 2 6-persons
Size of nonfamily households: 105 1-person, 30 2-persons
110 married couples with children.
48 single-parent households (26 men, 22 women).
97.4% of residents of 05770 zip code speak English at home.
1.7% of residents speak Spanish at home (53% very well, 37% well, 11% not well).
0.3% of residents speak other Indo-European language at home (100% very well).
0.5% of residents speak Asian or Pacific Island language at home (100% well).
0.3% of residents speak other language at home (100% very well).
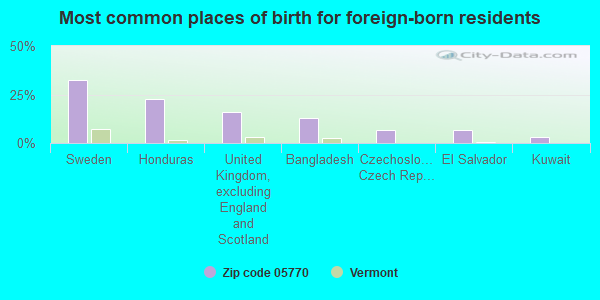
Foreign born population: 28 (2.4%) (44.8% of them are naturalized citizens)
This zip code:
2.4%
Whole state:
4.2%
32%Sweden
23%Honduras
16%United Kingdom, excluding England and Scotland
13%Bangladesh
6%Czechoslovakia (includes Czech Republic and Slovakia)
6%El Salvador
3%Kuwait
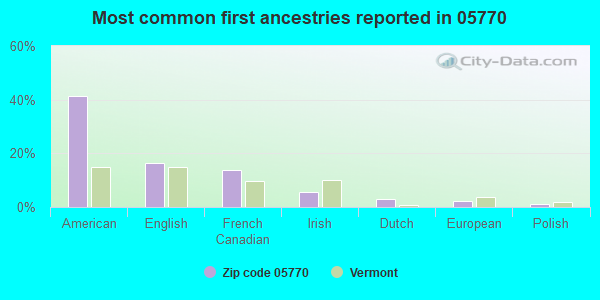
41%American
17%English
14%French Canadian
6%Irish
3%Dutch
2%European
1%Polish
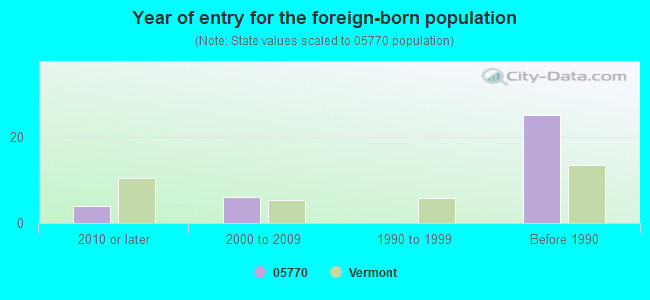
Year of entry for the foreign-born population
42010 or later
62000 to 2009
01990 to 1999
25Before 1990
Facilities with environmental interests located in this zip code:
SHOREHAM ELEMENTARY SCHOOL (130 SCHOOL ROAD in SHOREHAM, VT)
(Geographic Names Information System) (National Center for Education Statistics) - STATE ID-PS268
VALLEE R L SHOREHAM SVC CTR (2949 RTE 22A in SHOREHAM, VT)
Small Quantity Generators, between 100 kg and 1000 kg of hazardous waste/month (Resource Conservation and Recovery Act (tracking hazardous waste)) Organizations: R L VALLEE (CONTACT/OPERATOR)
, ERNIE POMAINVILLE (CONTACT/OPERATOR)
SHOREHAM ELEMENTARY (SCHOOL STREET in SHOREHAM, VT)
COMPLIANCE ACTIVITY (Tracking inspections of insecticide, fungicide, and rodenticide, and toxic substances)
Housing units lacking complete plumbing facilities: 2.3% Housing units lacking complete kitchen facilities: 1.6%
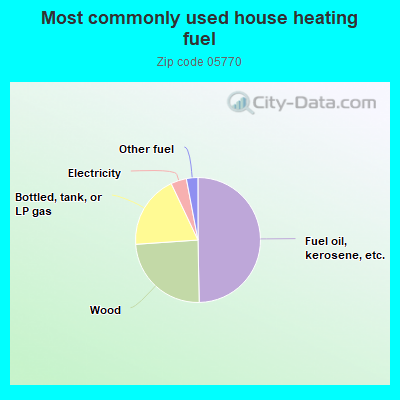
50.1%Fuel oil, kerosene, etc.
24.4%Wood
19.2%Bottled, tank, or LP gas
4.1%Electricity
3.0%Other fuel
Population in 1990: 946. Population change in the 1990s: +101 (+10.7%).
Place of birth for U.S.-born residents:
This state: 704
Northeast: 363
Midwest: 15
South: 24
West: 16
61% of the 05770 zip code residents lived in the same house 5 years ago. Out of people who lived in different houses, 61% lived in this county. Out of people who lived in different counties, 50% lived in Vermont.
95% of the 05770 zip code residents lived in the same house 1 year ago. Out of people who lived in different houses, 52% moved from this county. Out of people who lived in different houses, 20% moved from different county within same state. Out of people who lived in different houses, 26% moved from different state.
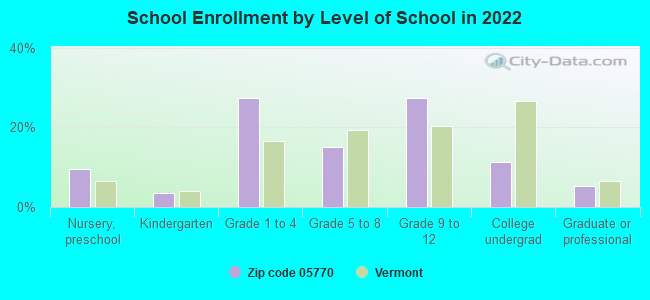
Private vs. public school enrollment:
Students in private schools in grades 1 to 8 (elementary and middle school): 6
Here:
9.2%
Vermont:
10.3%
Students in private schools in grades 9 to 12 (high school): 1
Here:
4.2%
Vermont:
11.6%
Students in private undergraduate colleges: 3
Here:
17.3%
Vermont:
29.2%
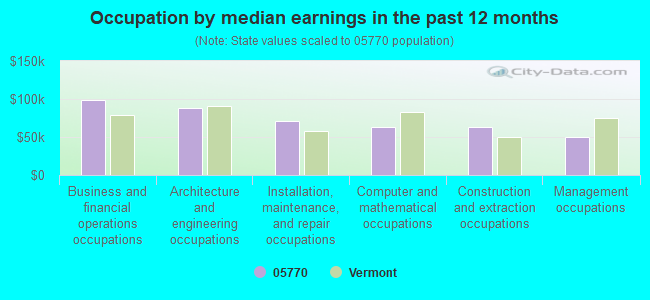
Occupation by median earnings in the past 12 months ($)
99,079Business and financial operations occupations
88,734Architecture and engineering occupations
71,563Installation, maintenance, and repair occupations
63,440Computer and mathematical occupations
62,710Construction and extraction occupations
50,589Management occupations
Top industries in this zip code by the number of employees in 2005:
Accommodation and Food Services: Full-Service Restaurants (10-19 employees: 1 establishment)


 Nearest zip codes: 05760, 05734, 05778, 12861, 05753, 05743.