Estimated zip code population in 2022: 14,652
Zip code population in 2010: 15,474
Zip code population in 2000: 15,078
Houses and condos: 7,081
Renter-occupied apartments: 3,526
% of renters here:
53%State:
34%
March 2022 cost of living index in zip code 06119: 104.9
(near average, U.S. average is 100)
Land area: 2.0
sq. mi.
Water area: 0.0
sq. mi.
Population density: 7,180 people per square mile (high).
OSM Map
Google Map
MSN Map
OSM Map
General Map
Google Map
MSN Map
OSM Map
Google Map
MSN Map
OSM Map
Google Map
MSN Map
Please wait while loading the map...
Real estate property taxes paid for housing units in 2022:
This zip code:
2.2% ($8,216)Connecticut:
1.8% ($6,189)
Median real estate property taxes paid for housing units with mortgages in 2022: $8,643 (2.3%)
Median real estate property taxes paid for housing units with no mortgage in 2022: $7,547 (2.2%)
Profiles of local businesses
Business Search - 14 Million verified businesses
Males: 6,950 Females: 7,701
For population 25 years and over in 06119:
High school or higher: 95.8%Bachelor's degree or higher: 69.8%Graduate or professional degree: 31.1%Unemployed: 3.2%Mean travel time to work (commute): 21.5 minutes
For population 15 years and over in 06119:
Never married: 45.2%Now married: 38.1%Separated: 2.6%Widowed: 4.5%Divorced: 9.7%
Zip code 06119 compared to state average:
Median age below state average. Renting percentage above state average. House age above state average. Percentage of population with a bachelor's degree or higher above state average. 9,707 66.3% White 2,099 14.3% Hispanic or Latino 1,609 11.0% Black 592 4.0% Asian 547 3.7% Two or more races 80 0.5% Some other race 15 0.1% American Indian
Data:
Median household income ($)
Median household income (% change since 2000)
Household income diversity
Ratio of average income to average house value (%)
Ratio of average income to average rent
Median household income ($) - White
Median household income ($) - Black or African American
Median household income ($) - Asian
Median household income ($) - Hispanic or Latino
Median household income ($) - American Indian and Alaska Native
Median household income ($) - Multirace
Median household income ($) - Other Race
Median household income for houses/condos with a mortgage ($)
Median household income for apartments without a mortgage ($)
Races - White alone (%)
Races - White alone (% change since 2000)
Races - Black alone (%)
Races - Black alone (% change since 2000)
Races - American Indian alone (%)
Races - American Indian alone (% change since 2000)
Races - Asian alone (%)
Races - Asian alone (% change since 2000)
Races - Hispanic (%)
Races - Hispanic (% change since 2000)
Races - Native Hawaiian and Other Pacific Islander alone (%)
Races - Native Hawaiian and Other Pacific Islander alone (% change since 2000)
Races - Two or more races (%)
Races - Two or more races (% change since 2000)
Races - Other race alone (%)
Races - Other race alone (% change since 2000)
Racial diversity
Unemployment (%)
Unemployment (% change since 2000)
Unemployment (%) - White
Unemployment (%) - Black or African American
Unemployment (%) - Asian
Unemployment (%) - Hispanic or Latino
Unemployment (%) - American Indian and Alaska Native
Unemployment (%) - Multirace
Unemployment (%) - Other Race
Population density (people per square mile)
Population - Males (%)
Population - Females (%)
Population - Males (%) - White
Population - Males (%) - Black or African American
Population - Males (%) - Asian
Population - Males (%) - Hispanic or Latino
Population - Males (%) - American Indian and Alaska Native
Population - Males (%) - Multirace
Population - Males (%) - Other Race
Population - Females (%) - White
Population - Females (%) - Black or African American
Population - Females (%) - Asian
Population - Females (%) - Hispanic or Latino
Population - Females (%) - American Indian and Alaska Native
Population - Females (%) - Multirace
Population - Females (%) - Other Race
Coronavirus confirmed cases (May 23, 2024)
Deaths caused by coronavirus (May 23, 2024)
Coronavirus confirmed cases (per 100k population) (May 23, 2024)
Deaths caused by coronavirus (per 100k population) (May 23, 2024)
Daily increase in number of cases (May 23, 2024)
Weekly increase in number of cases (May 23, 2024)
Cases doubled (in days) (May 23, 2024)
Hospitalized patients (Apr 18, 2022)
Negative test results (Apr 18, 2022)
Total test results (Apr 18, 2022)
COVID Vaccine doses distributed (per 100k population) (Sep 19, 2023)
COVID Vaccine doses administered (per 100k population) (Sep 19, 2023)
COVID Vaccine doses distributed (Sep 19, 2023)
COVID Vaccine doses administered (Sep 19, 2023)
Likely homosexual households (%)
Likely homosexual households (% change since 2000)
Likely homosexual households - Lesbian couples (%)
Likely homosexual households - Lesbian couples (% change since 2000)
Likely homosexual households - Gay men (%)
Likely homosexual households - Gay men (% change since 2000)
Cost of living index
Median gross rent ($)
Median contract rent ($)
Median monthly housing costs ($)
Median house or condo value ($)
Median house or condo value ($ change since 2000)
Mean house or condo value by units in structure - 1, detached ($)
Mean house or condo value by units in structure - 1, attached ($)
Mean house or condo value by units in structure - 2 ($)
Mean house or condo value by units in structure by units in structure - 3 or 4 ($)
Mean house or condo value by units in structure - 5 or more ($)
Mean house or condo value by units in structure - Boat, RV, van, etc. ($)
Mean house or condo value by units in structure - Mobile home ($)
Median house or condo value ($) - White
Median house or condo value ($) - Black or African American
Median house or condo value ($) - Asian
Median house or condo value ($) - Hispanic or Latino
Median house or condo value ($) - American Indian and Alaska Native
Median house or condo value ($) - Multirace
Median house or condo value ($) - Other Race
Median resident age
Resident age diversity
Median resident age - Males
Median resident age - Females
Median resident age - White
Median resident age - Black or African American
Median resident age - Asian
Median resident age - Hispanic or Latino
Median resident age - American Indian and Alaska Native
Median resident age - Multirace
Median resident age - Other Race
Median resident age - Males - White
Median resident age - Males - Black or African American
Median resident age - Males - Asian
Median resident age - Males - Hispanic or Latino
Median resident age - Males - American Indian and Alaska Native
Median resident age - Males - Multirace
Median resident age - Males - Other Race
Median resident age - Females - White
Median resident age - Females - Black or African American
Median resident age - Females - Asian
Median resident age - Females - Hispanic or Latino
Median resident age - Females - American Indian and Alaska Native
Median resident age - Females - Multirace
Median resident age - Females - Other Race
Commute - mean travel time to work (minutes)
Travel time to work - Less than 5 minutes (%)
Travel time to work - Less than 5 minutes (% change since 2000)
Travel time to work - 5 to 9 minutes (%)
Travel time to work - 5 to 9 minutes (% change since 2000)
Travel time to work - 10 to 19 minutes (%)
Travel time to work - 10 to 19 minutes (% change since 2000)
Travel time to work - 20 to 29 minutes (%)
Travel time to work - 20 to 29 minutes (% change since 2000)
Travel time to work - 30 to 39 minutes (%)
Travel time to work - 30 to 39 minutes (% change since 2000)
Travel time to work - 40 to 59 minutes (%)
Travel time to work - 40 to 59 minutes (% change since 2000)
Travel time to work - 60 to 89 minutes (%)
Travel time to work - 60 to 89 minutes (% change since 2000)
Travel time to work - 90 or more minutes (%)
Travel time to work - 90 or more minutes (% change since 2000)
Marital status - Never married (%)
Marital status - Now married (%)
Marital status - Separated (%)
Marital status - Widowed (%)
Marital status - Divorced (%)
Median family income ($)
Median family income (% change since 2000)
Median non-family income ($)
Median non-family income (% change since 2000)
Median per capita income ($)
Median per capita income (% change since 2000)
Median family income ($) - White
Median family income ($) - Black or African American
Median family income ($) - Asian
Median family income ($) - Hispanic or Latino
Median family income ($) - American Indian and Alaska Native
Median family income ($) - Multirace
Median family income ($) - Other Race
Median year house/condo built
Median year apartment built
Year house built - Built 2005 or later (%)
Year house built - Built 2000 to 2004 (%)
Year house built - Built 1990 to 1999 (%)
Year house built - Built 1980 to 1989 (%)
Year house built - Built 1970 to 1979 (%)
Year house built - Built 1960 to 1969 (%)
Year house built - Built 1950 to 1959 (%)
Year house built - Built 1940 to 1949 (%)
Year house built - Built 1939 or earlier (%)
Average household size
Household density (households per square mile)
Average household size - White
Average household size - Black or African American
Average household size - Asian
Average household size - Hispanic or Latino
Average household size - American Indian and Alaska Native
Average household size - Multirace
Average household size - Other Race
Occupied housing units (%)
Vacant housing units (%)
Owner occupied housing units (%)
Renter occupied housing units (%)
Vacancy status - For rent (%)
Vacancy status - For sale only (%)
Vacancy status - Rented or sold, not occupied (%)
Vacancy status - For seasonal, recreational, or occasional use (%)
Vacancy status - For migrant workers (%)
Vacancy status - Other vacant (%)
Residents with income below the poverty level (%)
Residents with income below 50% of the poverty level (%)
Children below poverty level (%)
Poor families by family type - Married-couple family (%)
Poor families by family type - Male, no wife present (%)
Poor families by family type - Female, no husband present (%)
Poverty status for native-born residents (%)
Poverty status for foreign-born residents (%)
Poverty among high school graduates not in families (%)
Poverty among people who did not graduate high school not in families (%)
Residents with income below the poverty level (%) - White
Residents with income below the poverty level (%) - Black or African American
Residents with income below the poverty level (%) - Asian
Residents with income below the poverty level (%) - Hispanic or Latino
Residents with income below the poverty level (%) - American Indian and Alaska Native
Residents with income below the poverty level (%) - Multirace
Residents with income below the poverty level (%) - Other Race
Air pollution - Air Quality Index (AQI)
Air pollution - CO
Air pollution - NO2
Air pollution - SO2
Air pollution - Ozone
Air pollution - PM10
Air pollution - PM25
Air pollution - Pb
Crime - Murders per 100,000 population
Crime - Rapes per 100,000 population
Crime - Robberies per 100,000 population
Crime - Assaults per 100,000 population
Crime - Burglaries per 100,000 population
Crime - Thefts per 100,000 population
Crime - Auto thefts per 100,000 population
Crime - Arson per 100,000 population
Crime - City-data.com crime index
Crime - Violent crime index
Crime - Property crime index
Crime - Murders per 100,000 population (5 year average)
Crime - Rapes per 100,000 population (5 year average)
Crime - Robberies per 100,000 population (5 year average)
Crime - Assaults per 100,000 population (5 year average)
Crime - Burglaries per 100,000 population (5 year average)
Crime - Thefts per 100,000 population (5 year average)
Crime - Auto thefts per 100,000 population (5 year average)
Crime - Arson per 100,000 population (5 year average)
Crime - City-data.com crime index (5 year average)
Crime - Violent crime index (5 year average)
Crime - Property crime index (5 year average)
1996 Presidential Elections Results (%) - Democratic Party (Clinton)
1996 Presidential Elections Results (%) - Republican Party (Dole)
1996 Presidential Elections Results (%) - Other
2000 Presidential Elections Results (%) - Democratic Party (Gore)
2000 Presidential Elections Results (%) - Republican Party (Bush)
2000 Presidential Elections Results (%) - Other
2004 Presidential Elections Results (%) - Democratic Party (Kerry)
2004 Presidential Elections Results (%) - Republican Party (Bush)
2004 Presidential Elections Results (%) - Other
2008 Presidential Elections Results (%) - Democratic Party (Obama)
2008 Presidential Elections Results (%) - Republican Party (McCain)
2008 Presidential Elections Results (%) - Other
2012 Presidential Elections Results (%) - Democratic Party (Obama)
2012 Presidential Elections Results (%) - Republican Party (Romney)
2012 Presidential Elections Results (%) - Other
2016 Presidential Elections Results (%) - Democratic Party (Clinton)
2016 Presidential Elections Results (%) - Republican Party (Trump)
2016 Presidential Elections Results (%) - Other
2020 Presidential Elections Results (%) - Democratic Party (Biden)
2020 Presidential Elections Results (%) - Republican Party (Trump)
2020 Presidential Elections Results (%) - Other
Ancestries Reported - Arab (%)
Ancestries Reported - Czech (%)
Ancestries Reported - Danish (%)
Ancestries Reported - Dutch (%)
Ancestries Reported - English (%)
Ancestries Reported - French (%)
Ancestries Reported - French Canadian (%)
Ancestries Reported - German (%)
Ancestries Reported - Greek (%)
Ancestries Reported - Hungarian (%)
Ancestries Reported - Irish (%)
Ancestries Reported - Italian (%)
Ancestries Reported - Lithuanian (%)
Ancestries Reported - Norwegian (%)
Ancestries Reported - Polish (%)
Ancestries Reported - Portuguese (%)
Ancestries Reported - Russian (%)
Ancestries Reported - Scotch-Irish (%)
Ancestries Reported - Scottish (%)
Ancestries Reported - Slovak (%)
Ancestries Reported - Subsaharan African (%)
Ancestries Reported - Swedish (%)
Ancestries Reported - Swiss (%)
Ancestries Reported - Ukrainian (%)
Ancestries Reported - United States (%)
Ancestries Reported - Welsh (%)
Ancestries Reported - West Indian (%)
Ancestries Reported - Other (%)
Educational Attainment - No schooling completed (%)
Educational Attainment - Less than high school (%)
Educational Attainment - High school or equivalent (%)
Educational Attainment - Less than 1 year of college (%)
Educational Attainment - 1 or more years of college (%)
Educational Attainment - Associate degree (%)
Educational Attainment - Bachelor's degree (%)
Educational Attainment - Master's degree (%)
Educational Attainment - Professional school degree (%)
Educational Attainment - Doctorate degree (%)
School Enrollment - Nursery, preschool (%)
School Enrollment - Kindergarten (%)
School Enrollment - Grade 1 to 4 (%)
School Enrollment - Grade 5 to 8 (%)
School Enrollment - Grade 9 to 12 (%)
School Enrollment - College undergrad (%)
School Enrollment - Graduate or professional (%)
School Enrollment - Not enrolled in school (%)
School enrollment - Public schools (%)
School enrollment - Private schools (%)
School enrollment - Not enrolled (%)
Median number of rooms in houses and condos
Median number of rooms in apartments
Housing units lacking complete plumbing facilities (%)
Housing units lacking complete kitchen facilities (%)
Density of houses
Urban houses (%)
Rural houses (%)
Households with people 60 years and over (%)
Households with people 65 years and over (%)
Households with people 75 years and over (%)
Households with one or more nonrelatives (%)
Households with no nonrelatives (%)
Population in households (%)
Family households (%)
Nonfamily households (%)
Population in families (%)
Family households with own children (%)
Median number of bedrooms in owner occupied houses
Mean number of bedrooms in owner occupied houses
Median number of bedrooms in renter occupied houses
Mean number of bedrooms in renter occupied houses
Median number of vehichles in owner occupied houses
Mean number of vehichles in owner occupied houses
Median number of vehichles in renter occupied houses
Mean number of vehichles in renter occupied houses
Mortgage status - with mortgage (%)
Mortgage status - with second mortgage (%)
Mortgage status - with home equity loan (%)
Mortgage status - with both second mortgage and home equity loan (%)
Mortgage status - without a mortgage (%)
Average family size
Average family size - White
Average family size - Black or African American
Average family size - Asian
Average family size - Hispanic or Latino
Average family size - American Indian and Alaska Native
Average family size - Multirace
Average family size - Other Race
Geographical mobility - Same house 1 year ago (%)
Geographical mobility - Moved within same county (%)
Geographical mobility - Moved from different county within same state (%)
Geographical mobility - Moved from different state (%)
Geographical mobility - Moved from abroad (%)
Place of birth - Born in state of residence (%)
Place of birth - Born in other state (%)
Place of birth - Native, outside of US (%)
Place of birth - Foreign born (%)
Housing units in structures - 1, detached (%)
Housing units in structures - 1, attached (%)
Housing units in structures - 2 (%)
Housing units in structures - 3 or 4 (%)
Housing units in structures - 5 to 9 (%)
Housing units in structures - 10 to 19 (%)
Housing units in structures - 20 to 49 (%)
Housing units in structures - 50 or more (%)
Housing units in structures - Mobile home (%)
Housing units in structures - Boat, RV, van, etc. (%)
House/condo owner moved in on average (years ago)
Renter moved in on average (years ago)
Year householder moved into unit - Moved in 1999 to March 2000 (%)
Year householder moved into unit - Moved in 1995 to 1998 (%)
Year householder moved into unit - Moved in 1990 to 1994 (%)
Year householder moved into unit - Moved in 1980 to 1989 (%)
Year householder moved into unit - Moved in 1970 to 1979 (%)
Year householder moved into unit - Moved in 1969 or earlier (%)
Means of transportation to work - Drove car alone (%)
Means of transportation to work - Carpooled (%)
Means of transportation to work - Public transportation (%)
Means of transportation to work - Bus or trolley bus (%)
Means of transportation to work - Streetcar or trolley car (%)
Means of transportation to work - Subway or elevated (%)
Means of transportation to work - Railroad (%)
Means of transportation to work - Ferryboat (%)
Means of transportation to work - Taxicab (%)
Means of transportation to work - Motorcycle (%)
Means of transportation to work - Bicycle (%)
Means of transportation to work - Walked (%)
Means of transportation to work - Other means (%)
Working at home (%)
Industry diversity
Most Common Industries - Agriculture, forestry, fishing and hunting, and mining (%)
Most Common Industries - Agriculture, forestry, fishing and hunting (%)
Most Common Industries - Mining, quarrying, and oil and gas extraction (%)
Most Common Industries - Construction (%)
Most Common Industries - Manufacturing (%)
Most Common Industries - Wholesale trade (%)
Most Common Industries - Retail trade (%)
Most Common Industries - Transportation and warehousing, and utilities (%)
Most Common Industries - Transportation and warehousing (%)
Most Common Industries - Utilities (%)
Most Common Industries - Information (%)
Most Common Industries - Finance and insurance, and real estate and rental and leasing (%)
Most Common Industries - Finance and insurance (%)
Most Common Industries - Real estate and rental and leasing (%)
Most Common Industries - Professional, scientific, and management, and administrative and waste management services (%)
Most Common Industries - Professional, scientific, and technical services (%)
Most Common Industries - Management of companies and enterprises (%)
Most Common Industries - Administrative and support and waste management services (%)
Most Common Industries - Educational services, and health care and social assistance (%)
Most Common Industries - Educational services (%)
Most Common Industries - Health care and social assistance (%)
Most Common Industries - Arts, entertainment, and recreation, and accommodation and food services (%)
Most Common Industries - Arts, entertainment, and recreation (%)
Most Common Industries - Accommodation and food services (%)
Most Common Industries - Other services, except public administration (%)
Most Common Industries - Public administration (%)
Occupation diversity
Most Common Occupations - Management, business, science, and arts occupations (%)
Most Common Occupations - Management, business, and financial occupations (%)
Most Common Occupations - Management occupations (%)
Most Common Occupations - Business and financial operations occupations (%)
Most Common Occupations - Computer, engineering, and science occupations (%)
Most Common Occupations - Computer and mathematical occupations (%)
Most Common Occupations - Architecture and engineering occupations (%)
Most Common Occupations - Life, physical, and social science occupations (%)
Most Common Occupations - Education, legal, community service, arts, and media occupations (%)
Most Common Occupations - Community and social service occupations (%)
Most Common Occupations - Legal occupations (%)
Most Common Occupations - Education, training, and library occupations (%)
Most Common Occupations - Arts, design, entertainment, sports, and media occupations (%)
Most Common Occupations - Healthcare practitioners and technical occupations (%)
Most Common Occupations - Health diagnosing and treating practitioners and other technical occupations (%)
Most Common Occupations - Health technologists and technicians (%)
Most Common Occupations - Service occupations (%)
Most Common Occupations - Healthcare support occupations (%)
Most Common Occupations - Protective service occupations (%)
Most Common Occupations - Fire fighting and prevention, and other protective service workers including supervisors (%)
Most Common Occupations - Law enforcement workers including supervisors (%)
Most Common Occupations - Food preparation and serving related occupations (%)
Most Common Occupations - Building and grounds cleaning and maintenance occupations (%)
Most Common Occupations - Personal care and service occupations (%)
Most Common Occupations - Sales and office occupations (%)
Most Common Occupations - Sales and related occupations (%)
Most Common Occupations - Office and administrative support occupations (%)
Most Common Occupations - Natural resources, construction, and maintenance occupations (%)
Most Common Occupations - Farming, fishing, and forestry occupations (%)
Most Common Occupations - Construction and extraction occupations (%)
Most Common Occupations - Installation, maintenance, and repair occupations (%)
Most Common Occupations - Production, transportation, and material moving occupations (%)
Most Common Occupations - Production occupations (%)
Most Common Occupations - Transportation occupations (%)
Most Common Occupations - Material moving occupations (%)
People in Group quarters - Institutionalized population (%)
People in Group quarters - Correctional institutions (%)
People in Group quarters - Federal prisons and detention centers (%)
People in Group quarters - Halfway houses (%)
People in Group quarters - Local jails and other confinement facilities (including police lockups) (%)
People in Group quarters - Military disciplinary barracks (%)
People in Group quarters - State prisons (%)
People in Group quarters - Other types of correctional institutions (%)
People in Group quarters - Nursing homes (%)
People in Group quarters - Hospitals/wards, hospices, and schools for the handicapped (%)
People in Group quarters - Hospitals/wards and hospices for chronically ill (%)
People in Group quarters - Hospices or homes for chronically ill (%)
People in Group quarters - Military hospitals or wards for chronically ill (%)
People in Group quarters - Other hospitals or wards for chronically ill (%)
People in Group quarters - Hospitals or wards for drug/alcohol abuse (%)
People in Group quarters - Mental (Psychiatric) hospitals or wards (%)
People in Group quarters - Schools, hospitals, or wards for the mentally retarded (%)
People in Group quarters - Schools, hospitals, or wards for the physically handicapped (%)
People in Group quarters - Institutions for the deaf (%)
People in Group quarters - Institutions for the blind (%)
People in Group quarters - Orthopedic wards and institutions for the physically handicapped (%)
People in Group quarters - Wards in general hospitals for patients who have no usual home elsewhere (%)
People in Group quarters - Wards in military hospitals for patients who have no usual home elsewhere (%)
People in Group quarters - Juvenile institutions (%)
People in Group quarters - Long-term care (%)
People in Group quarters - Homes for abused, dependent, and neglected children (%)
People in Group quarters - Residential treatment centers for emotionally disturbed children (%)
People in Group quarters - Training schools for juvenile delinquents (%)
People in Group quarters - Short-term care, detention or diagnostic centers for delinquent children (%)
People in Group quarters - Type of juvenile institution unknown (%)
People in Group quarters - Noninstitutionalized population (%)
People in Group quarters - College dormitories (includes college quarters off campus) (%)
People in Group quarters - Military quarters (%)
People in Group quarters - On base (%)
People in Group quarters - Barracks, unaccompanied personnel housing (UPH), (Enlisted/Officer), ;and similar group living quarters for military personnel (%)
People in Group quarters - Transient quarters for temporary residents (%)
People in Group quarters - Military ships (%)
People in Group quarters - Group homes (%)
People in Group quarters - Homes or halfway houses for drug/alcohol abuse (%)
People in Group quarters - Homes for the mentally ill (%)
People in Group quarters - Homes for the mentally retarded (%)
People in Group quarters - Homes for the physically handicapped (%)
People in Group quarters - Other group homes (%)
People in Group quarters - Religious group quarters (%)
People in Group quarters - Dormitories (%)
People in Group quarters - Agriculture workers' dormitories on farms (%)
People in Group quarters - Job Corps and vocational training facilities (%)
People in Group quarters - Other workers' dormitories (%)
People in Group quarters - Crews of maritime vessels (%)
People in Group quarters - Other nonhousehold living situations (%)
People in Group quarters - Other noninstitutional group quarters (%)
Residents speaking English at home (%)
Residents speaking English at home - Born in the United States (%)
Residents speaking English at home - Native, born elsewhere (%)
Residents speaking English at home - Foreign born (%)
Residents speaking Spanish at home (%)
Residents speaking Spanish at home - Born in the United States (%)
Residents speaking Spanish at home - Native, born elsewhere (%)
Residents speaking Spanish at home - Foreign born (%)
Residents speaking other language at home (%)
Residents speaking other language at home - Born in the United States (%)
Residents speaking other language at home - Native, born elsewhere (%)
Residents speaking other language at home - Foreign born (%)
Class of Workers - Employee of private company (%)
Class of Workers - Self-employed in own incorporated business (%)
Class of Workers - Private not-for-profit wage and salary workers (%)
Class of Workers - Local government workers (%)
Class of Workers - State government workers (%)
Class of Workers - Federal government workers (%)
Class of Workers - Self-employed workers in own not incorporated business and Unpaid family workers (%)
House heating fuel used in houses and condos - Utility gas (%)
House heating fuel used in houses and condos - Bottled, tank, or LP gas (%)
House heating fuel used in houses and condos - Electricity (%)
House heating fuel used in houses and condos - Fuel oil, kerosene, etc. (%)
House heating fuel used in houses and condos - Coal or coke (%)
House heating fuel used in houses and condos - Wood (%)
House heating fuel used in houses and condos - Solar energy (%)
House heating fuel used in houses and condos - Other fuel (%)
House heating fuel used in houses and condos - No fuel used (%)
House heating fuel used in apartments - Utility gas (%)
House heating fuel used in apartments - Bottled, tank, or LP gas (%)
House heating fuel used in apartments - Electricity (%)
House heating fuel used in apartments - Fuel oil, kerosene, etc. (%)
House heating fuel used in apartments - Coal or coke (%)
House heating fuel used in apartments - Wood (%)
House heating fuel used in apartments - Solar energy (%)
House heating fuel used in apartments - Other fuel (%)
House heating fuel used in apartments - No fuel used (%)
Armed forces status - In Armed Forces (%)
Armed forces status - Civilian (%)
Armed forces status - Civilian - Veteran (%)
Armed forces status - Civilian - Nonveteran (%)
Fatal accidents locations in years 2005-2021
Fatal accidents locations in 2005
Fatal accidents locations in 2006
Fatal accidents locations in 2007
Fatal accidents locations in 2008
Fatal accidents locations in 2009
Fatal accidents locations in 2010
Fatal accidents locations in 2011
Fatal accidents locations in 2012
Fatal accidents locations in 2013
Fatal accidents locations in 2014
Fatal accidents locations in 2015
Fatal accidents locations in 2016
Fatal accidents locations in 2017
Fatal accidents locations in 2018
Fatal accidents locations in 2019
Fatal accidents locations in 2020
Fatal accidents locations in 2021
Alcohol use - People drinking some alcohol every month (%)
Alcohol use - People not drinking at all (%)
Alcohol use - Average days/month drinking alcohol
Alcohol use - Average drinks/week
Alcohol use - Average days/year people drink much
Audiometry - Average condition of hearing (%)
Audiometry - People that can hear a whisper from across a quiet room (%)
Audiometry - People that can hear normal voice from across a quiet room (%)
Audiometry - Ears ringing, roaring, buzzing (%)
Audiometry - Had a job exposure to loud noise (%)
Audiometry - Had off-work exposure to loud noise (%)
Blood Pressure & Cholesterol - Has high blood pressure (%)
Blood Pressure & Cholesterol - Checking blood pressure at home (%)
Blood Pressure & Cholesterol - Frequently checking blood cholesterol (%)
Blood Pressure & Cholesterol - Has high cholesterol level (%)
Consumer Behavior - Money monthly spent on food at supermarket/grocery store
Consumer Behavior - Money monthly spent on food at other stores
Consumer Behavior - Money monthly spent on eating out
Consumer Behavior - Money monthly spent on carryout/delivered foods
Consumer Behavior - Income spent on food at supermarket/grocery store (%)
Consumer Behavior - Income spent on food at other stores (%)
Consumer Behavior - Income spent on eating out (%)
Consumer Behavior - Income spent on carryout/delivered foods (%)
Current Health Status - General health condition (%)
Current Health Status - Blood donors (%)
Current Health Status - Has blood ever tested for HIV virus (%)
Current Health Status - Left-handed people (%)
Dermatology - People using sunscreen (%)
Diabetes - Diabetics (%)
Diabetes - Had a blood test for high blood sugar (%)
Diabetes - People taking insulin (%)
Diet Behavior & Nutrition - Diet health (%)
Diet Behavior & Nutrition - Milk product consumption (# of products/month)
Diet Behavior & Nutrition - Meals not home prepared (#/week)
Diet Behavior & Nutrition - Meals from fast food or pizza place (#/week)
Diet Behavior & Nutrition - Ready-to-eat foods (#/month)
Diet Behavior & Nutrition - Frozen meals/pizza (#/month)
Drug Use - People that ever used marijuana or hashish (%)
Drug Use - Ever used hard drugs (%)
Drug Use - Ever used any form of cocaine (%)
Drug Use - Ever used heroin (%)
Drug Use - Ever used methamphetamine (%)
Health Insurance - People covered by health insurance (%)
Kidney Conditions-Urology - Avg. # of times urinating at night
Medical Conditions - People with asthma (%)
Medical Conditions - People with anemia (%)
Medical Conditions - People with psoriasis (%)
Medical Conditions - People with overweight (%)
Medical Conditions - Elderly people having difficulties in thinking or remembering (%)
Medical Conditions - People who ever received blood transfusion (%)
Medical Conditions - People having trouble seeing even with glass/contacts (%)
Medical Conditions - People with arthritis (%)
Medical Conditions - People with gout (%)
Medical Conditions - People with congestive heart failure (%)
Medical Conditions - People with coronary heart disease (%)
Medical Conditions - People with angina pectoris (%)
Medical Conditions - People who ever had heart attack (%)
Medical Conditions - People who ever had stroke (%)
Medical Conditions - People with emphysema (%)
Medical Conditions - People with thyroid problem (%)
Medical Conditions - People with chronic bronchitis (%)
Medical Conditions - People with any liver condition (%)
Medical Conditions - People who ever had cancer or malignancy (%)
Mental Health - People who have little interest in doing things (%)
Mental Health - People feeling down, depressed, or hopeless (%)
Mental Health - People who have trouble sleeping or sleeping too much (%)
Mental Health - People feeling tired or having little energy (%)
Mental Health - People with poor appetite or overeating (%)
Mental Health - People feeling bad about themself (%)
Mental Health - People who have trouble concentrating on things (%)
Mental Health - People moving or speaking slowly or too fast (%)
Mental Health - People having thoughts they would be better off dead (%)
Oral Health - Average years since last visit a dentist
Oral Health - People embarrassed because of mouth (%)
Oral Health - People with gum disease (%)
Oral Health - General health of teeth and gums (%)
Oral Health - Average days a week using dental floss/device
Oral Health - Average days a week using mouthwash for dental problem
Oral Health - Average number of teeth
Pesticide Use - Households using pesticides to control insects (%)
Pesticide Use - Households using pesticides to kill weeds (%)
Physical Activity - People doing vigorous-intensity work activities (%)
Physical Activity - People doing moderate-intensity work activities (%)
Physical Activity - People walking or bicycling (%)
Physical Activity - People doing vigorous-intensity recreational activities (%)
Physical Activity - People doing moderate-intensity recreational activities (%)
Physical Activity - Average hours a day doing sedentary activities
Physical Activity - Average hours a day watching TV or videos
Physical Activity - Average hours a day using computer
Physical Functioning - People having limitations keeping them from working (%)
Physical Functioning - People limited in amount of work they can do (%)
Physical Functioning - People that need special equipment to walk (%)
Physical Functioning - People experiencing confusion/memory problems (%)
Physical Functioning - People requiring special healthcare equipment (%)
Prescription Medications - Average number of prescription medicines taking
Preventive Aspirin Use - Adults 40+ taking low-dose aspirin (%)
Reproductive Health - Vaginal deliveries (%)
Reproductive Health - Cesarean deliveries (%)
Reproductive Health - Deliveries resulted in a live birth (%)
Reproductive Health - Pregnancies resulted in a delivery (%)
Reproductive Health - Women breastfeeding newborns (%)
Reproductive Health - Women that had a hysterectomy (%)
Reproductive Health - Women that had both ovaries removed (%)
Reproductive Health - Women that have ever taken birth control pills (%)
Reproductive Health - Women taking birth control pills (%)
Reproductive Health - Women that have ever used Depo-Provera or injectables (%)
Reproductive Health - Women that have ever used female hormones (%)
Sexual Behavior - People 18+ that ever had sex (vaginal, anal, or oral) (%)
Sexual Behavior - Males 18+ that ever had vaginal sex with a woman (%)
Sexual Behavior - Males 18+ that ever performed oral sex on a woman (%)
Sexual Behavior - Males 18+ that ever had anal sex with a woman (%)
Sexual Behavior - Males 18+ that ever had any sex with a man (%)
Sexual Behavior - Females 18+ that ever had vaginal sex with a man (%)
Sexual Behavior - Females 18+ that ever performed oral sex on a man (%)
Sexual Behavior - Females 18+ that ever had anal sex with a man (%)
Sexual Behavior - Females 18+ that ever had any kind of sex with a woman (%)
Sexual Behavior - Average age people first had sex
Sexual Behavior - Average number of female sex partners in lifetime (males 18+)
Sexual Behavior - Average number of female vaginal sex partners in lifetime (males 18+)
Sexual Behavior - Average age people first performed oral sex on a woman (18+)
Sexual Behavior - Average number of woman performed oral sex on in lifetime (18+)
Sexual Behavior - Average number of male sex partners in lifetime (males 18+)
Sexual Behavior - Average number of male anal sex partners in lifetime (males 18+)
Sexual Behavior - Average age people first performed oral sex on a man (18+)
Sexual Behavior - Average number of male oral sex partners in lifetime (18+)
Sexual Behavior - People using protection when performing oral sex (%)
Sexual Behavior - Average number of times people have vaginal or anal sex a year
Sexual Behavior - People having sex without condom (%)
Sexual Behavior - Average number of male sex partners in lifetime (females 18+)
Sexual Behavior - Average number of male vaginal sex partners in lifetime (females 18+)
Sexual Behavior - Average number of female sex partners in lifetime (females 18+)
Sexual Behavior - Circumcised males 18+ (%)
Sleep Disorders - Average hours sleeping at night
Sleep Disorders - People that has trouble sleeping (%)
Smoking-Cigarette Use - People smoking cigarettes (%)
Taste & Smell - People 40+ having problems with smell (%)
Taste & Smell - People 40+ having problems with taste (%)
Taste & Smell - People 40+ that ever had wisdom teeth removed (%)
Taste & Smell - People 40+ that ever had tonsils teeth removed (%)
Taste & Smell - People 40+ that ever had a loss of consciousness because of a head injury (%)
Taste & Smell - People 40+ that ever had a broken nose or other serious injury to face or skull (%)
Taste & Smell - People 40+ that ever had two or more sinus infections (%)
Weight - Average height (inches)
Weight - Average weight (pounds)
Weight - Average BMI
Weight - People that are obese (%)
Weight - People that ever were obese (%)
Weight - People trying to lose weight (%)
100%
urban population.
Estimated median house/condo value in 2022: $368,974
06119:
$368,974Connecticut:
$347,200
According to our research of Connecticut and other state lists, there were 4 registered sex offenders living in 06119 zip code as of May 23, 2024 . The ratio of all residents to sex offenders in zip code 06119 is 4,037 to 1.The ratio of registered sex offenders to all residents in this zip code is much lower than the state average.
Median resident age: This zip code:
33.5 yearsConnecticut median age:
40.9 years
Average household size: This zip code:
2.2 peopleConnecticut:
2.5 people
Averages for the 2020 tax year for zip code 06119, filed in 2021:
Average Adjusted Gross Income (AGI) in 2020: $96,911 (Individual Income Tax Returns) Here:
$96,911State:
$105,931
Salary/wage: $84,941 (reported on 84.0% of returns )Here:
$84,941State:
$83,540
(% of AGI for various income ranges: 1146.3% for AGIs below $25k , 3642.2% for AGIs $25k-50k , 6873.2% for AGIs $50k-75k , 9966.0% for AGIs $75k-100k , 20101.3% for AGIs $100k-200k , 90314.8% for AGIs over 200k ) Taxable interest for individuals: $1,564 (reported on 37.4% of returns )This zip code:
$1,564Connecticut:
$3,402
(% of AGI for various income ranges: 14.6% for AGIs below $25k , 17.5% for AGIs $25k-50k , 26.6% for AGIs $50k-75k , 56.5% for AGIs $75k-100k , 123.3% for AGIs $100k-200k , 1044.8% for AGIs over 200k ) Ordinary dividends: $7,668 (reported on 31.0% of returns )(% of AGI for various income ranges: 45.1% for AGIs below $25k , 52.2% for AGIs $25k-50k , 95.9% for AGIs $50k-75k , 172.9% for AGIs $75k-100k , 562.6% for AGIs $100k-200k , 4406.0% for AGIs over 200k ) Net capital gain/loss in AGI: +$14,587 (reported on 26.9% of returns )Here:
+$14,587State:
+$44,158
(% of AGI for various income ranges: 15.1% for AGIs below $25k , 44.6% for AGIs $25k-50k , 89.3% for AGIs $50k-75k , 167.3% for AGIs $75k-100k , 612.8% for AGIs $100k-200k , 9132.0% for AGIs over 200k ) Profit/loss from business: +$20,845 (reported on 17.0% of returns )Here:
+$20,845State:
+$22,988
(% of AGI for various income ranges: 127.7% for AGIs below $25k , 172.0% for AGIs $25k-50k , 193.7% for AGIs $50k-75k , 379.2% for AGIs $75k-100k , 836.5% for AGIs $100k-200k , 5403.2% for AGIs over 200k ) Taxable individual retirement arrangement distribution: $22,183 (reported on 8.6% of returns )06119:
$22,183Connecticut:
$22,031
(% of AGI for various income ranges: 31.1% for AGIs below $25k , 92.8% for AGIs $25k-50k , 136.3% for AGIs $50k-75k , 297.3% for AGIs $75k-100k , 759.3% for AGIs $100k-200k , 1958.4% for AGIs over 200k ) Self-employed (Keogh) retirement plans: $28,986 (reported on 1.9% of returns )06119:
$28,986Connecticut:
$29,016
(% of AGI for various income ranges: 25.7% for AGIs $50k-75k , 87.7% for AGIs $100k-200k , 1286.8% for AGIs over 200k ) Total itemized deductions: $30,977 (reported on 12.4% of returns )Here:
$30,977State:
$37,613
(% of AGI for various income ranges: 32.9% for AGIs below $25k , 104.1% for AGIs $25k-50k , 305.3% for AGIs $50k-75k , 610.4% for AGIs $75k-100k , 1108.7% for AGIs $100k-200k , 5414.8% for AGIs over 200k ) Charity contributions: $11,149 (reported on 10.1% of returns )Here:
$11,149State:
$13,557
(% of AGI for various income ranges: 13.0% for AGIs $25k-50k , 29.7% for AGIs $50k-75k , 66.3% for AGIs $75k-100k , 208.7% for AGIs $100k-200k , 2505.2% for AGIs over 200k ) Taxes paid: $9,220 (reported on 12.4% of returns )(% of AGI for various income ranges: 13.6% for AGIs below $25k , 36.0% for AGIs $25k-50k , 99.3% for AGIs $50k-75k , 255.2% for AGIs $75k-100k , 411.4% for AGIs $100k-200k , 1160.0% for AGIs over 200k ) Earned income credit: $2,003 (reported on 8.9% of returns )(% of AGI for various income ranges: 66.9% for AGIs below $25k , 41.5% for AGIs $25k-50k ) Percentage of individuals using paid preparers for their 2020 taxes: 92.4%(% for various income ranges: 91.0% for AGIs below $25k , 92.8% for AGIs $25k-50k , 92.7% for AGIs $50k-75k , 92.1% for AGIs $75k-100k , 92.4% for AGIs $100k-200k , 95.0% for AGIs over 200k )
Averages for the 2012 tax year for zip code 06119, filed in 2013:
Average Adjusted Gross Income (AGI) in 2012: $86,703 (Individual Income Tax Returns) Here:
$86,703State:
$93,290
Salary/wage: $69,366 (reported on 84.4% of returns )Here:
$69,366State:
$73,117
(% of AGI for various income ranges: 69.0% for AGIs below $25k , 82.9% for AGIs $25k-50k , 82.0% for AGIs $50k-75k , 78.5% for AGIs $75k-100k , 80.6% for AGIs $100k-200k , 49.9% for AGIs over 200k ) Taxable interest for individuals: $1,202 (reported on 47.0% of returns )This zip code:
$1,202Connecticut:
$2,530
(% of AGI for various income ranges: 1.5% for AGIs below $25k , 0.6% for AGIs $25k-50k , 0.7% for AGIs $50k-75k , 0.7% for AGIs $75k-100k , 0.6% for AGIs $100k-200k , 0.6% for AGIs over 200k ) Ordinary dividends: $5,910 (reported on 30.3% of returns )(% of AGI for various income ranges: 3.6% for AGIs below $25k , 1.6% for AGIs $25k-50k , 1.6% for AGIs $50k-75k , 2.3% for AGIs $75k-100k , 1.6% for AGIs $100k-200k , 2.4% for AGIs over 200k ) Net capital gain/loss in AGI: +$9,644 (reported on 23.0% of returns )Here:
+$9,644State:
+$34,090
(% of AGI for various income ranges: 0.4% for AGIs $25k-50k , 0.7% for AGIs $50k-75k , 0.9% for AGIs $75k-100k , 1.2% for AGIs $100k-200k , 5.0% for AGIs over 200k ) Profit/loss from business: +$22,002 (reported on 16.6% of returns )Here:
+$22,002State:
+$22,741
(% of AGI for various income ranges: 10.8% for AGIs below $25k , 3.7% for AGIs $25k-50k , 2.6% for AGIs $50k-75k , 3.6% for AGIs $75k-100k , 4.5% for AGIs $100k-200k , 4.1% for AGIs over 200k ) Taxable individual retirement arrangement distribution: $14,697 (reported on 9.8% of returns )06119:
$14,697Connecticut:
$19,976
(% of AGI for various income ranges: 2.8% for AGIs below $25k , 2.0% for AGIs $25k-50k , 2.0% for AGIs $50k-75k , 2.0% for AGIs $75k-100k , 2.1% for AGIs $100k-200k , 1.0% for AGIs over 200k ) Self-employment retirement plans: $22,012 (reported on 2.3% of returns )06119:
$22,012Connecticut:
$24,004
(% of AGI for various income ranges: 0.4% for AGIs $50k-75k , 0.5% for AGIs $100k-200k , 1.0% for AGIs over 200k ) Total itemized deductions: $26,883 (16% of AGI, reported on 40.1% of returns )Here:
$26,883State:
$33,239
Here:
16.3% of AGIState:
18.9% of AGI
(% of AGI for various income ranges: 14.5% for AGIs below $25k , 9.8% for AGIs $25k-50k , 12.2% for AGIs $50k-75k , 15.4% for AGIs $75k-100k , 16.7% for AGIs $100k-200k , 9.9% for AGIs over 200k ) Charity contributions: $3,080 (reported on 33.8% of returns )(% of AGI for various income ranges: 0.6% for AGIs below $25k , 0.7% for AGIs $25k-50k , 1.0% for AGIs $50k-75k , 1.4% for AGIs $75k-100k , 1.5% for AGIs $100k-200k , 1.2% for AGIs over 200k ) Taxes paid: $15,094 (reported on 40.0% of returns )06119:
$15,094State:
$17,397
(% of AGI for various income ranges: 3.9% for AGIs below $25k , 3.2% for AGIs $25k-50k , 5.2% for AGIs $50k-75k , 7.8% for AGIs $75k-100k , 9.4% for AGIs $100k-200k , 7.1% for AGIs over 200k ) Earned income credit: $1,818 (reported on 11.1% of returns )(% of AGI for various income ranges: 4.2% for AGIs below $25k , 0.7% for AGIs $25k-50k ) Percentage of individuals using paid preparers for their 2012 taxes: 49.5%(% for various income ranges: 46.8% for AGIs below $25k , 45.1% for AGIs $25k-50k , 47.7% for AGIs $50k-75k , 52.8% for AGIs $75k-100k , 53.2% for AGIs $100k-200k , 68.6% for AGIs over 200k )
Averages for the 2004 tax year for zip code 06119, filed in 2005:
Average Adjusted Gross Income (AGI) in 2004: $59,177 (Individual Income Tax Returns) Here:
$59,177State:
$73,265
Salary/wage: $54,449 (reported on 83.1% of returns )Here:
$54,449State:
$62,030
(% of AGI for various income ranges: 118.8% for AGIs below $10k , 71.2% for AGIs $10k-25k , 83.2% for AGIs $25k-50k , 83.6% for AGIs $50k-75k , 82.1% for AGIs $75k-100k , 70.2% for AGIs over 100k ) Taxable interest for individuals: $1,550 (reported on 60.0% of returns )This zip code:
$1,550Connecticut:
$2,287
(% of AGI for various income ranges: 9.0% for AGIs below $10k , 2.7% for AGIs $10k-25k , 2.0% for AGIs $25k-50k , 1.2% for AGIs $50k-75k , 1.4% for AGIs $75k-100k , 1.3% for AGIs over 100k ) Taxable dividends: $3,740 (reported on 36.0% of returns )(% of AGI for various income ranges: 9.5% for AGIs below $10k , 3.4% for AGIs $10k-25k , 1.9% for AGIs $25k-50k , 1.6% for AGIs $50k-75k , 1.3% for AGIs $75k-100k , 2.6% for AGIs over 100k ) Net capital gain/loss: +$5,718 (reported on 28.6% of returns )Here:
+$5,718State:
+$23,694
(% of AGI for various income ranges: -4.2% for AGIs below $10k , 0.9% for AGIs $10k-25k , 0.5% for AGIs $25k-50k , 0.7% for AGIs $50k-75k , 1.1% for AGIs $75k-100k , 5.0% for AGIs over 100k ) Profit/loss from business: +$15,183 (reported on 15.5% of returns )Here:
+$15,183State:
+$20,783
(% of AGI for various income ranges: 3.0% for AGIs below $10k , 6.6% for AGIs $10k-25k , 3.5% for AGIs $25k-50k , 2.6% for AGIs $50k-75k , 4.1% for AGIs $75k-100k , 4.3% for AGIs over 100k ) IRA payment deduction: $2,979 (reported on 2.6% of returns )06119:
$2,979Connecticut:
$3,216
(% of AGI for various income ranges: 0.3% for AGIs $10k-25k , 0.2% for AGIs $25k-50k , 0.1% for AGIs $50k-75k , 0.2% for AGIs $75k-100k , 0.1% for AGIs over 100k ) Self-employed pension: $15,290 (reported on 2.5% of returns )Here:
$15,290Connecticut:
$17,335
(% of AGI for various income ranges: 0.2% for AGIs $25k-50k , 0.2% for AGIs $50k-75k , 0.3% for AGIs $75k-100k , 1.1% for AGIs over 100k ) Total itemized deductions: $20,606 (19% of AGI, reported on 39.2% of returns )Here:
$20,606State:
$24,919
Here:
19.4% of AGIState:
18.6% of AGI
(% of AGI for various income ranges: 16.7% for AGIs below $10k , 9.8% for AGIs $10k-25k , 10.4% for AGIs $25k-50k , 14.0% for AGIs $50k-75k , 15.9% for AGIs $75k-100k , 14.4% for AGIs over 100k ) Charity contributions deductions: $2,964 (3% of AGI, reported on 35.6% of returns )Here:
2.7% of AGIState:
2.7% of AGI
(% of AGI for various income ranges: 0.9% for AGIs below $10k , 1.0% for AGIs $10k-25k , 1.1% for AGIs $25k-50k , 1.6% for AGIs $50k-75k , 1.7% for AGIs $75k-100k , 2.2% for AGIs over 100k ) Total tax: $10,394 (reported on 81.8% of returns )06119:
$10,394State:
$15,148
(% of AGI for various income ranges: 3.9% for AGIs below $10k , 5.0% for AGIs $10k-25k , 8.8% for AGIs $25k-50k , 10.8% for AGIs $50k-75k , 11.6% for AGIs $75k-100k , 19.3% for AGIs over 100k ) Earned income credit: $1,427 (reported on 7.8% of returns )Percentage of individuals using paid preparers for their 2004 taxes: 53.4%(% for various income ranges: 47.9% for AGIs below $10k , 57.0% for AGIs $10k-25k , 49.8% for AGIs $25k-50k , 51.8% for AGIs $50k-75k , 56.6% for AGIs $75k-100k , 61.2% for AGIs over 100k )
Estimated median household income in 2022: This zip code:
$99,961Connecticut:
$88,429
Nearest zip codes: 06105 ,
06110 ,
06107 ,
06106 ,
06160 ,
06117 .
West Hartford Zip Code Map
Percentage of family households: This zip code:
35.5%Connecticut:
43.6%
Percentage of households with unmarried partners: This zip code:
8.6%Connecticut:
46.0%
Likely homosexual households (counted as self-reported same-sex unmarried-partner households)
Lesbian couples: 0.6% of all households Gay men: 0.2% of all households
Household received Food Stamps/SNAP in the past 12 months: 742Household did not receive Food Stamps/SNAP in the past 12 months: 5,899
Women who had a birth in the past 12 months: 109 (89 now married , 17 unmarried) Women who did not have a birth in the past 12 months: 4,129 (1,211 now married , 2,943 unmarried)
Housing units in zip code 06119 with a mortgage: 1,925 (217
second mortgage , 6
home equity loan , 179
both second mortgage and home equity loan )
Houses without a mortgage: 78
Median monthly owner costs for units with a mortgage: $2,392
Median monthly owner costs for units without a mortgage: $1,061
Residents with income below the poverty level in 2022:
This zip code:
9.1%Whole state:
9.8%
Residents with income below 50% of the poverty level in 2022:
This zip code:
3.9%Whole state:
4.8%
Median number of rooms in houses and condos: Median number of rooms in apartments: Notable locations in this zip code not listed on our city pages
Click to draw/clear zip code borders Notable locations in zip code 06119: (A) , Science Center of Connecticut (B) , Gengras Planetarium (C) , Deborah Library (D) , Convent Mary Immaculate (E) . Display/hide their locations on the map
Shopping Centers: (1) , Prospect Shopping Plaza Shopping Center (2) . Display/hide their locations on the map
Churches in zip code 06119 include: (A) , Congregation Beth Israel (B) , Emmanuel Assembly of God Church (C) , Religious Society of Friends Church (D) , Saint Francis Saint Clare Church (E) , Saint Johns Episcopal Church (F) , Saint Thomas the Apostle Church (G) , Sisters of Mercy Church (H) , Unity Church of Hartford (I) . Display/hide their locations on the map
Parks in zip code 06119 include: (1) , Sterling Field (2) . Display/hide their locations on the map
Year house built (houses)
12 2020 or later92 2010 to 201982 2000 to 2009225 1990 to 1999297 1980 to 1989350 1970 to 1979796 1960 to 1969638 1950 to 1959580 1940 to 19493,817 1939 or earlier
Zip code 06119 household income distribution in 2022 400 Less than $10,000195 $10,000 to $14,999143 $15,000 to $19,999113 $20,000 to $24,999153 $25,000 to $29,99999 $30,000 to $34,99985 $35,000 to $39,999141 $40,000 to $44,999318 $45,000 to $49,999247 $50,000 to $59,999587 $60,000 to $74,999697 $75,000 to $99,999686 $100,000 to $124,999807 $125,000 to $149,999677 $150,000 to $199,9991,245 $200,000 or moreEstimate of home value of owner-occupied houses/condos in 2022 in zip code 06119 19 Less than $10,00047 $20,000 to $24,9995 $50,000 to $59,9998 $90,000 to $99,99925 $125,000 to $149,99918 $150,000 to $174,99935 $175,000 to $199,999323 $200,000 to $249,999668 $250,000 to $299,999762 $300,000 to $399,999650 $400,000 to $499,999459 $500,000 to $749,999156 $750,000 to $999,99911 $1,000,000 to $1,499,999Rent paid by renters in 2022 in zip code 06119 25 $150 to $19985 $200 to $24917 $250 to $29949 $500 to $54964 $600 to $64925 $650 to $69913 $700 to $74920 $750 to $79958 $800 to $899125 $900 to $999851 $1,000 to $1,249985 $1,250 to $1,499838 $1,500 to $1,999142 $2,000 to $2,49927 $2,500 to $2,9999 $3,000 to $3,499101 $3,500 or more58 No cash rent
Median gross rent in 2022: $1,526.
Median price asked for vacant for-sale houses and condos in 2022: $619,490.
Estimated median house (or condo) value in 2022 for: White Non-Hispanic householders: $394,845Black or African American householders: $291,842American Indian or Alaska Native householders: $272,015Asian householders: $343,102Some other race householders: $414,430Two or more races householders: $619,711Hispanic or Latino householders: $301,513Estimated median house or condo value in 2022: $368,974
06119:
$368,974Connecticut:
$347,200
Lower value quartile - upper value quartile: $289,068 - $489,587
Mean price in 2022: Detached houses: $473,272Here:
$473,272State:
$503,946
Townhouses or other attached units: $221,640Here:
$221,640State:
$304,959
In 2-unit structures: $266,638Here:
$266,638State:
$304,133
In 3-to-4-unit structures: $1,579,441Here:
$1,579,441State:
$272,970
In 5-or-more-unit structures: $247,425Here:
$247,425State:
$249,308
Housing units in structures:
One, detached: 2,674One, attached: 450Two: 7793 or 4: 1,2115 to 9: 28310 to 19: 62520 to 49: 47650 or more: 581Mobile homes: 12Unemployment : 3.2%
Means of transportation to work in zip code 06119 69.5% 6,199 Drove a car alone4.0% 359 Carpooled2.4% 217 Bus or trolley bus0.2% 15 Streetcar or trolley car0.1% 12 Taxi0.3% 23 Bicycle0.9% 81 Walked0.7% 63 Other means23.4% 2,085 Worked at homeTravel time to work (commute) in zip code 06119 175 Less than 5 minutes527 5 to 9 minutes1,498 10 to 14 minutes1,541 15 to 19 minutes1,182 20 to 24 minutes474 25 to 29 minutes740 30 to 34 minutes151 35 to 39 minutes85 40 to 44 minutes346 45 to 59 minutes145 60 to 89 minutes119 90 or more minutes
Percentage of zip code residents living and working in this county: 91.5%
Household type by relationship:
Households: 14,652
Male householders: 2,850 (913 living alone ), Female householders: 3,804 (1,584 living alone )2,149 spouses (2,109 opposite-sex spouses ), 806 unmarried partners , (786 opposite-sex unmarried partners ), 3,382 children (3,235 natural , 35 adopted , 113 stepchildren ), 143 grandchildren , 92 brothers or sisters , 178 parents , 0 foster children , 159 other relatives , 870 non-relatives In group quarters: 246 (-1 institutionalized population )
Size of family households: 1,361 2-persons , 929 3-persons , 722 4-persons , 75 5-persons , 33 6-persons , 9 7-or-more-persons
Size of nonfamily households: 2,506 1-person , 942 2-persons , 66 3-persons , 40 4-persons , 24 5-persons , 28 7-or-more-persons
1,387 married couples with children. single-parent households (187 men , 939 women ).
75.5% of residents of 06119 zip code speak English at home. of residents speak Spanish at home (66% very well, 20% well, 13% not well, 1% not at all ).of residents speak other Indo-European language at home (50% very well, 11% well, 22% not well, 16% not at all ).of residents speak Asian or Pacific Island language at home (45% very well, 51% well, 4% not well ).of residents speak other language at home (37% very well, 31% well, 24% not well, 8% not at all ).
Foreign born population: 2,418 (16.5%)
(63.7%
of them are naturalized citizens )
This zip code:
16.5%Whole state:
15.7%
11% Bolivia 7% Honduras 6% Guyana 5% Grenada 4% Bhutan 4% Eritrea 4% Kazakhstan 10% Irish 7% English 6% Italian 5% Haitian 4% Polish 4% European 4% American
Year of entry for the foreign-born population
686 2010 or later 537 2000 to 2009 638 1990 to 1999 889 Before 1990
Facilities with environmental interests located in this zip code:
ALLIANCE ENERGY (55 KANE ST in WEST HARTFORD, CT)
Small Quantity Generators, between 100 kg and 1000 kg of hazardous waste/month (Resource Conservation and Recovery Act (tracking hazardous waste)) Organizations: OPERNAME (CONTACT/OPERATOR)
, ALLIANCE ENERGY CORP (CONTACT/OPERATOR)
, EXXONMOBIL CORP (CONTACT/OWNER)
ALLIANCE ENERGY (905 FARMINGTON AVE in WEST HARTFORD, CT)
Small Quantity Generators, between 100 kg and 1000 kg of hazardous waste/month (Resource Conservation and Recovery Act (tracking hazardous waste)) Organizations: OPERNAME (CONTACT/OPERATOR)
, ALLIANCE ENERGY CORP (CONTACT/OPERATOR)
, EXXONMOBIL CORP (CONTACT/OWNER)
A AIUDI & SONS (69 TALCOTT ROAD in WEST HARTFORD, CT)
AIR MINOR (AIRS/AFS) Business SIC classification: READY-MIXED CONCRETEAlternative names: CONN SAND & STONE CORPORATION
BATTISTONS OF PARK RD (352 PARK RD in WEST HARTFORD, CT)
Conditionally Exempt Small Quantity Generators, less than 100 kg/month of hazardous waste (Resource Conservation and Recovery Act (tracking hazardous waste)) - notification Organizations: OWNERNAME (CONTACT/OWNER)
NU POLE #181 (798 FARMINGTON AVE in WEST HARTFORD, CT)
COMPLIANCE ACTIVITY (Tracking inspections of insecticide, fungicide, and rodenticide, and toxic substances)
Housing units lacking complete kitchen facilities: 2.2%
61.4% Utility gas 16.2% Electricity 16.0% Fuel oil, kerosene, etc. 3.1% Bottled, tank, or LP gas 1.9% Other fuel 1.1% No fuel used
Population in 1990: 15,066. Population change in the 1990s: +12 (+0.1%).
Place of birth for U.S.-born residents:
This state: 7,251Northeast: 2,575Midwest: 603South: 1,052West: 355
53% of the 06119 zip code residents lived in the same house 5 years ago.
Out of people who lived in different houses, 65% lived in this county.
Out of people who lived in different counties, 50% lived in Connecticut.
85% of the 06119 zip code residents lived in the same house 1 year ago.
Out of people who lived in different houses, 50% moved from this county.
Out of people who lived in different houses, 7% moved from different county within same state.
Out of people who lived in different houses, 42% moved from different state.
Out of people who lived in different houses, 3% moved from abroad.
Private vs. public school enrollment:
Students in private schools in grades 1 to 8 (elementary and middle school): 89
Here:
6.4%Connecticut:
9.5%
Students in private schools in grades 9 to 12 (high school): 112
Here:
16.3%Connecticut:
12.9%
Students in private undergraduate colleges: 121
Here:
25.1%Connecticut:
35.5%
Occupation by median earnings in the past 12 months ($)
128,783 Legal occupations 110,278 Health diagnosing and treating practitioners and other technical occupations 106,837 Community and social service occupations 101,803 Fire fighting and prevention, and other protective service workers including supervisors 96,267 Management occupations 90,101 Computer and mathematical occupations
Companies with federal contracts located in this zip code:
COLLEGIATE PAINTING (49 PENN DR in W HARTFORD, CT; small business) in 3 contracts from 2005 to 2006
$10,122 with Army for Maintenance, Repair or Alteration of Real Property -- Office Buildings. Signed on 2005-09-08. Completion date: 2005-10-14.
, same as above. Signed on 2006-05-11. Completion date: 2006-06-30.
with Army for Water Services. Signed on 2006-01-04. Completion date: 2006-02-28.
Top industries in this zip code by the number of employees in 2005:
Other Services (except Public Administration): Religious Organizations (100-249 employees: 1 establishment, 50-99 employees: 1 establishment, 10-19 employees: 1 establishment, 5-9 employees: 2 establishments)Educational Services: Elementary and Secondary Schools (100-249: 1, 20-49: 1)Administrative and Support and Waste Management and Remediation Services: Travel Agencies (100-249: 1, 5-9: 1, 1-4: 1)Accommodation and Food Services: Full-Service Restaurants (20-49: 2, 10-19: 6, 5-9: 1, 1-4: 4)Health Care and Social Assistance: Nursing Care Facilities (100-249: 1)Health Care and Social Assistance: Offices of Dentists (10-19: 4, 5-9: 6, 1-4: 6)Accommodation and Food Services: Limited-Service Restaurants (20-49: 2, 10-19: 1, 5-9: 2)Health Care and Social Assistance: Child Day Care Services (20-49: 1, 10-19: 3, 5-9: 1, 1-4: 2)Health Care and Social Assistance: Offices of Physicians (except Mental Health Specialists) (20-49: 1, 10-19: 2, 5-9: 2, 1-4: 3)
People in group quarters in 2010:
151 people in nursing facilities/skilled-nursing facilities
76 people in other noninstitutional facilities
52 people in group homes intended for adults
People in group quarters in 2000:
163 people in nursing homes
88 people in religious group quarters
19 people in other noninstitutional group quarters
17 people in homes for the mentally ill
8 people in homes for the physically handicapped
7 people in homes for the mentally retarded
Fatal accident statistics in 2014:
Fatal accident count: 1Vehicles involved in fatal accidents: 3Fatal accidents caused by drunken drivers: 0Fatalities: 1Persons involved in fatal accidents: 4Pedestrians involved in fatal accidents: 0
Home Mortgage Disclosure Act Aggregated Statistics For Year 2009(Based on 2 full and 6 partial tracts) A) FHA, FSA/RHS & VA B) Conventional C) Refinancings D) Home Improvement Loans E) Loans on Dwellings For 5+ Families F) Non-occupant Loans on Number Average Value Number Average Value Number Average Value Number Average Value Number Average Value Number Average Value
LOANS ORIGINATED 90 $233,752 141 $221,976 647 $232,369 41 $93,424 4 $522,220 53 $219,299 APPLICATIONS APPROVED, NOT ACCEPTED 5 $279,614 15 $202,008 40 $230,174 9 $32,859 0 $0 16 $184,979 APPLICATIONS DENIED 12 $232,427 31 $211,237 194 $219,499 20 $147,380 0 $0 41 $197,485 APPLICATIONS WITHDRAWN 7 $316,701 25 $237,700 102 $223,999 6 $77,922 2 $692,920 15 $209,841 FILES CLOSED FOR INCOMPLETENESS 4 $195,448 3 $290,020 30 $199,904 0 $0 0 $0 0 $0
Aggregated Statistics For Year 2008(Based on 2 full and 6 partial tracts) A) FHA, FSA/RHS & VA B) Conventional C) Refinancings D) Home Improvement Loans E) Loans on Dwellings For 5+ Families F) Non-occupant Loans on G) Loans On Manufactured Number Average Value Number Average Value Number Average Value Number Average Value Number Average Value Number Average Value Number Average Value
LOANS ORIGINATED 80 $234,396 275 $244,070 269 $210,438 63 $80,897 18 $1,641,994 44 $187,265 0 $0 APPLICATIONS APPROVED, NOT ACCEPTED 6 $250,578 33 $273,828 62 $195,078 8 $60,038 0 $0 14 $218,122 2 $55,435 APPLICATIONS DENIED 8 $183,264 45 $241,448 158 $198,820 25 $111,736 2 $242,005 19 $179,762 0 $0 APPLICATIONS WITHDRAWN 0 $0 39 $253,263 67 $211,955 5 $68,818 2 $303,000 10 $147,228 0 $0 FILES CLOSED FOR INCOMPLETENESS 0 $0 4 $162,200 48 $269,742 0 $0 0 $0 2 $129,000 0 $0
Aggregated Statistics For Year 2007(Based on 2 full and 6 partial tracts) A) FHA, FSA/RHS & VA B) Conventional C) Refinancings D) Home Improvement Loans E) Loans on Dwellings For 5+ Families F) Non-occupant Loans on Number Average Value Number Average Value Number Average Value Number Average Value Number Average Value Number Average Value
LOANS ORIGINATED 21 $224,062 385 $190,113 302 $164,198 96 $50,359 12 $340,419 76 $174,216 APPLICATIONS APPROVED, NOT ACCEPTED 0 $0 55 $198,113 78 $193,215 16 $123,087 0 $0 23 $186,328 APPLICATIONS DENIED 6 $152,017 76 $171,459 184 $199,201 53 $90,547 0 $0 38 $170,904 APPLICATIONS WITHDRAWN 9 $269,374 20 $182,329 101 $200,930 4 $148,892 0 $0 16 $202,673 FILES CLOSED FOR INCOMPLETENESS 0 $0 12 $157,654 27 $243,663 2 $15,000 0 $0 2 $238,000
Aggregated Statistics For Year 2006(Based on 2 full and 6 partial tracts) A) FHA, FSA/RHS & VA B) Conventional C) Refinancings D) Home Improvement Loans E) Loans on Dwellings For 5+ Families F) Non-occupant Loans on G) Loans On Manufactured Number Average Value Number Average Value Number Average Value Number Average Value Number Average Value Number Average Value Number Average Value
LOANS ORIGINATED 46 $220,798 506 $179,912 434 $186,270 158 $68,423 9 $1,110,439 111 $191,594 2 $121,845 APPLICATIONS APPROVED, NOT ACCEPTED 0 $0 62 $155,820 65 $172,635 14 $52,752 2 $373,360 23 $135,136 0 $0 APPLICATIONS DENIED 5 $184,086 105 $172,077 281 $179,957 58 $51,848 2 $28,530 52 $170,976 0 $0 APPLICATIONS WITHDRAWN 4 $165,000 56 $159,486 130 $186,697 24 $108,672 2 $840,300 18 $179,704 0 $0 FILES CLOSED FOR INCOMPLETENESS 2 $49,000 8 $198,950 39 $238,098 9 $132,476 0 $0 0 $0 0 $0
Aggregated Statistics For Year 2005(Based on 2 full and 6 partial tracts) A) FHA, FSA/RHS & VA B) Conventional C) Refinancings D) Home Improvement Loans E) Loans on Dwellings For 5+ Families F) Non-occupant Loans on G) Loans On Manufactured Number Average Value Number Average Value Number Average Value Number Average Value Number Average Value Number Average Value Number Average Value
LOANS ORIGINATED 24 $210,440 598 $164,327 469 $173,326 100 $66,146 7 $393,401 163 $144,078 0 $0 APPLICATIONS APPROVED, NOT ACCEPTED 2 $283,690 46 $155,790 88 $159,392 15 $23,766 0 $0 24 $101,768 0 $0 APPLICATIONS DENIED 0 $0 105 $131,553 235 $185,131 53 $54,636 0 $0 42 $168,893 2 $65,215 APPLICATIONS WITHDRAWN 3 $226,627 117 $139,551 298 $184,719 24 $75,347 2 $240,000 35 $126,858 0 $0 FILES CLOSED FOR INCOMPLETENESS 0 $0 17 $163,511 33 $152,240 6 $81,582 0 $0 13 $111,708 2 $141,845
Aggregated Statistics For Year 2004(Based on 2 full and 6 partial tracts) A) FHA, FSA/RHS & VA B) Conventional C) Refinancings D) Home Improvement Loans E) Loans on Dwellings For 5+ Families F) Non-occupant Loans on G) Loans On Manufactured Number Average Value Number Average Value Number Average Value Number Average Value Number Average Value Number Average Value Number Average Value
LOANS ORIGINATED 43 $188,998 583 $166,866 641 $170,265 89 $72,145 15 $934,547 149 $158,070 5 $79,560 APPLICATIONS APPROVED, NOT ACCEPTED 0 $0 64 $171,577 124 $165,413 21 $55,091 0 $0 16 $144,320 0 $0 APPLICATIONS DENIED 2 $206,245 98 $140,074 293 $152,077 16 $216,218 0 $0 60 $142,748 0 $0 APPLICATIONS WITHDRAWN 7 $192,946 62 $173,131 309 $156,775 10 $135,314 2 $294,105 30 $128,211 0 $0 FILES CLOSED FOR INCOMPLETENESS 0 $0 11 $194,026 49 $187,949 1 $49,390 0 $0 3 $194,950 0 $0
Aggregated Statistics For Year 2003(Based on 2 full and 6 partial tracts) A) FHA, FSA/RHS & VA B) Conventional C) Refinancings D) Home Improvement Loans E) Loans on Dwellings For 5+ Families F) Non-occupant Loans on Number Average Value Number Average Value Number Average Value Number Average Value Number Average Value Number Average Value
LOANS ORIGINATED 35 $158,164 509 $162,294 1,652 $141,252 39 $42,756 9 $581,567 179 $127,303 APPLICATIONS APPROVED, NOT ACCEPTED 4 $97,710 66 $159,029 210 $136,498 12 $48,292 0 $0 32 $126,567 APPLICATIONS DENIED 7 $145,469 76 $142,716 286 $137,992 35 $61,354 0 $0 55 $137,305 APPLICATIONS WITHDRAWN 2 $84,870 39 $169,247 265 $141,015 10 $37,882 0 $0 12 $123,578 FILES CLOSED FOR INCOMPLETENESS 0 $0 14 $156,566 42 $145,921 3 $40,760 0 $0 4 $180,805
Aggregated Statistics For Year 2002(Based on 2 full and 6 partial tracts) A) FHA, FSA/RHS & VA B) Conventional C) Refinancings D) Home Improvement Loans E) Loans on Dwellings For 5+ Families F) Non-occupant Loans on Number Average Value Number Average Value Number Average Value Number Average Value Number Average Value Number Average Value
LOANS ORIGINATED 39 $159,029 455 $140,953 941 $144,650 77 $43,781 5 $555,216 96 $114,964 APPLICATIONS APPROVED, NOT ACCEPTED 5 $99,564 53 $175,657 138 $121,210 36 $35,273 0 $0 14 $104,934 APPLICATIONS DENIED 4 $139,988 47 $115,309 170 $116,203 38 $31,815 0 $0 16 $112,731 APPLICATIONS WITHDRAWN 4 $180,500 41 $128,310 156 $126,808 6 $31,483 0 $0 10 $104,703 FILES CLOSED FOR INCOMPLETENESS 2 $147,000 21 $124,883 33 $130,605 0 $0 0 $0 5 $128,772
Aggregated Statistics For Year 2001(Based on 2 full and 6 partial tracts) A) FHA, FSA/RHS & VA B) Conventional C) Refinancings D) Home Improvement Loans E) Loans on Dwellings For 5+ Families F) Non-occupant Loans on Number Average Value Number Average Value Number Average Value Number Average Value Number Average Value Number Average Value
LOANS ORIGINATED 76 $140,013 446 $134,690 729 $138,729 78 $39,695 7 $569,383 75 $118,967 APPLICATIONS APPROVED, NOT ACCEPTED 2 $141,845 65 $120,548 73 $93,780 31 $25,178 0 $0 18 $81,946 APPLICATIONS DENIED 11 $151,685 49 $105,331 194 $91,327 52 $35,917 0 $0 5 $60,166 APPLICATIONS WITHDRAWN 2 $161,340 34 $110,465 127 $101,923 23 $22,202 2 $1,000,000 9 $66,153 FILES CLOSED FOR INCOMPLETENESS 2 $118,000 8 $116,098 44 $128,448 9 $40,509 0 $0 2 $100,270
Aggregated Statistics For Year 2000(Based on 2 full and 6 partial tracts) A) FHA, FSA/RHS & VA B) Conventional C) Refinancings D) Home Improvement Loans E) Loans on Dwellings For 5+ Families F) Non-occupant Loans on Number Average Value Number Average Value Number Average Value Number Average Value Number Average Value Number Average Value
LOANS ORIGINATED 83 $129,248 412 $117,507 168 $88,721 59 $31,807 2 $442,000 55 $93,177 APPLICATIONS APPROVED, NOT ACCEPTED 2 $104,345 39 $117,375 31 $111,244 38 $23,536 0 $0 10 $53,295 APPLICATIONS DENIED 8 $134,500 40 $111,206 102 $79,364 38 $28,791 2 $326,080 11 $78,718 APPLICATIONS WITHDRAWN 2 $113,315 36 $129,749 61 $85,940 11 $112,326 2 $3,025,080 0 $0 FILES CLOSED FOR INCOMPLETENESS 0 $0 13 $113,798 29 $100,385 1 $32,600 0 $0 2 $97,825
Aggregated Statistics For Year 1999(Based on 1 full and 3 partial tracts) A) FHA, FSA/RHS & VA B) Conventional C) Refinancings D) Home Improvement Loans E) Loans on Dwellings For 5+ Families F) Non-occupant Loans on Number Average Value Number Average Value Number Average Value Number Average Value Number Average Value Number Average Value
LOANS ORIGINATED 41 $114,306 200 $112,521 187 $103,419 36 $26,630 4 $713,550 26 $98,189 APPLICATIONS APPROVED, NOT ACCEPTED 0 $0 19 $132,116 28 $95,618 10 $25,104 0 $0 4 $66,845 APPLICATIONS DENIED 3 $115,267 24 $85,368 37 $69,421 25 $33,316 0 $0 8 $73,015 APPLICATIONS WITHDRAWN 4 $101,362 19 $105,933 45 $98,478 5 $29,788 0 $0 5 $56,122 FILES CLOSED FOR INCOMPLETENESS 0 $0 3 $123,820 8 $134,322 2 $24,260 0 $0 0 $0
Detailed HMDA statistics for the following Tracts:
4967.00
,
4969.00 ,
4970.00 ,
4971.00
Private Mortgage Insurance Companies Aggregated Statistics For Year 2009(Based on 2 full and 6 partial tracts) A) Conventional B) Refinancings Number Average Value Number Average Value
LOANS ORIGINATED 21 $224,517 11 $313,852 APPLICATIONS APPROVED, NOT ACCEPTED 16 $218,566 7 $323,760 APPLICATIONS DENIED 3 $218,477 3 $241,013 APPLICATIONS WITHDRAWN 2 $277,080 0 $0 FILES CLOSED FOR INCOMPLETENESS 0 $0 0 $0
Aggregated Statistics For Year 2008(Based on 2 full and 6 partial tracts) A) Conventional B) Refinancings C) Non-occupant Loans on Number Average Value Number Average Value Number Average Value
LOANS ORIGINATED 93 $237,668 11 $221,058 4 $116,368 APPLICATIONS APPROVED, NOT ACCEPTED 23 $237,717 23 $313,931 4 $214,660 APPLICATIONS DENIED 2 $96,635 0 $0 0 $0 APPLICATIONS WITHDRAWN 4 $404,258 4 $254,518 0 $0 FILES CLOSED FOR INCOMPLETENESS 2 $202,985 3 $436,957 0 $0
Aggregated Statistics For Year 2007(Based on 2 full and 6 partial tracts) A) Conventional B) Refinancings C) Non-occupant Loans on Number Average Value Number Average Value Number Average Value
LOANS ORIGINATED 105 $192,520 21 $274,163 6 $153,130 APPLICATIONS APPROVED, NOT ACCEPTED 12 $210,648 5 $234,728 0 $0 APPLICATIONS DENIED 2 $69,000 0 $0 0 $0 APPLICATIONS WITHDRAWN 7 $238,486 4 $278,720 2 $340,320 FILES CLOSED FOR INCOMPLETENESS 0 $0 0 $0 0 $0
Aggregated Statistics For Year 2006(Based on 2 full and 6 partial tracts) A) Conventional B) Refinancings C) Non-occupant Loans on Number Average Value Number Average Value Number Average Value
LOANS ORIGINATED 69 $205,293 19 $342,158 8 $205,529 APPLICATIONS APPROVED, NOT ACCEPTED 8 $194,566 2 $327,715 2 $195,650 APPLICATIONS DENIED 0 $0 0 $0 0 $0 APPLICATIONS WITHDRAWN 4 $101,000 2 $319,560 2 $76,000 FILES CLOSED FOR INCOMPLETENESS 0 $0 0 $0 0 $0
Aggregated Statistics For Year 2005(Based on 2 full and 6 partial tracts) A) Conventional B) Refinancings C) Non-occupant Loans on Number Average Value Number Average Value Number Average Value
LOANS ORIGINATED 78 $205,886 9 $203,957 7 $226,760 APPLICATIONS APPROVED, NOT ACCEPTED 14 $169,163 10 $230,397 0 $0 APPLICATIONS DENIED 3 $79,347 0 $0 0 $0 APPLICATIONS WITHDRAWN 7 $202,833 4 $446,255 4 $228,492 FILES CLOSED FOR INCOMPLETENESS 0 $0 0 $0 0 $0
Aggregated Statistics For Year 2004(Based on 2 full and 6 partial tracts) A) Conventional B) Refinancings C) Non-occupant Loans on Number Average Value Number Average Value Number Average Value
LOANS ORIGINATED 89 $167,028 14 $189,727 4 $257,025 APPLICATIONS APPROVED, NOT ACCEPTED 18 $189,854 8 $224,860 4 $136,320 APPLICATIONS DENIED 3 $175,457 2 $213,000 0 $0 APPLICATIONS WITHDRAWN 11 $182,268 7 $155,776 0 $0 FILES CLOSED FOR INCOMPLETENESS 0 $0 1 $205,460 0 $0
Aggregated Statistics For Year 2003(Based on 2 full and 6 partial tracts) A) Conventional B) Refinancings C) Non-occupant Loans on Number Average Value Number Average Value Number Average Value
LOANS ORIGINATED 141 $160,308 61 $147,360 16 $149,549 APPLICATIONS APPROVED, NOT ACCEPTED 10 $145,049 12 $167,130 2 $190,000 APPLICATIONS DENIED 3 $219,017 0 $0 2 $180,975 APPLICATIONS WITHDRAWN 7 $166,843 7 $139,551 1 $244,970 FILES CLOSED FOR INCOMPLETENESS 0 $0 0 $0 0 $0
Aggregated Statistics For Year 2002(Based on 2 full and 6 partial tracts) A) Conventional B) Refinancings C) Non-occupant Loans on Number Average Value Number Average Value Number Average Value
LOANS ORIGINATED 133 $148,446 37 $195,472 7 $159,580 APPLICATIONS APPROVED, NOT ACCEPTED 14 $169,233 7 $123,834 0 $0 APPLICATIONS DENIED 2 $129,615 0 $0 0 $0 APPLICATIONS WITHDRAWN 9 $134,141 4 $223,935 2 $124,725 FILES CLOSED FOR INCOMPLETENESS 0 $0 0 $0 0 $0
Aggregated Statistics For Year 2001(Based on 2 full and 6 partial tracts) A) Conventional B) Refinancings C) Non-occupant Loans on Number Average Value Number Average Value Number Average Value
LOANS ORIGINATED 136 $132,612 32 $151,184 8 $143,905 APPLICATIONS APPROVED, NOT ACCEPTED 31 $137,006 2 $61,140 5 $143,802 APPLICATIONS DENIED 2 $174,840 2 $138,785 0 $0 APPLICATIONS WITHDRAWN 0 $0 2 $105,160 0 $0 FILES CLOSED FOR INCOMPLETENESS 0 $0 0 $0 0 $0
Aggregated Statistics For Year 2000(Based on 2 full and 6 partial tracts) A) Conventional B) Refinancings C) Non-occupant Loans on Number Average Value Number Average Value Number Average Value
LOANS ORIGINATED 149 $123,331 7 $117,371 6 $98,052 APPLICATIONS APPROVED, NOT ACCEPTED 10 $136,709 3 $163,233 0 $0 APPLICATIONS DENIED 0 $0 0 $0 0 $0 APPLICATIONS WITHDRAWN 6 $145,400 0 $0 2 $106,790 FILES CLOSED FOR INCOMPLETENESS 0 $0 0 $0 0 $0
Aggregated Statistics For Year 1999(Based on 1 full and 3 partial tracts) A) Conventional B) Refinancings C) Non-occupant Loans on Number Average Value Number Average Value Number Average Value
LOANS ORIGINATED 56 $127,471 15 $135,287 3 $76,707 APPLICATIONS APPROVED, NOT ACCEPTED 7 $141,217 3 $164,637 1 $15,710 APPLICATIONS DENIED 1 $112,560 0 $0 0 $0 APPLICATIONS WITHDRAWN 2 $92,460 2 $104,345 1 $110,170 FILES CLOSED FOR INCOMPLETENESS 0 $0 0 $0 0 $0
Detailed PMIC statistics for the following Tracts:
4967.00
,
4969.00 ,
4970.00 ,
4971.00
2002 - 2018 National Fire Incident Reporting System (NFIRS) incidents See full 2006 National Fire Incident Reporting System statistics for zip code 06119, Connecticut
Most common first names in zip code 06119 among deceased individuals Name Count Lived (average)
Mary 275 83.4 years John 171 77.1 years William 126 77.0 years Helen 105 83.3 years Joseph 100 77.2 years Anna 85 85.2 years Elizabeth 83 82.2 years Margaret 78 83.1 years Robert 68 73.2 years Dorothy 68 79.9 years
Most common last names in zip code 06119 among deceased individuals Last name Count Lived (average)
Johnson 57 82.0 years Smith 37 80.1 years Sullivan 29 79.2 years Anderson 27 81.8 years Carlson 22 84.6 years Cohen 20 80.9 years Brown 19 78.4 years Clark 18 73.9 years Obrien 16 82.4 years Kelly 15 82.5 years
Businesses in zip code 06119
Name Count Name Count
CVS 1 Payless 1 Dunkin Donuts 4 Pizza Hut 1 FedEx 1 Subway 1 GameStop 1 UPS 1 H&R Block 1 Walgreens 1 HomeTown Buffet 1
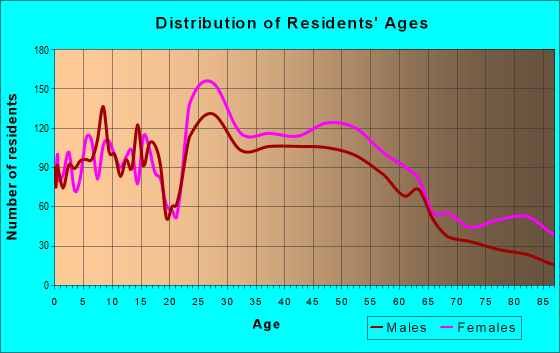


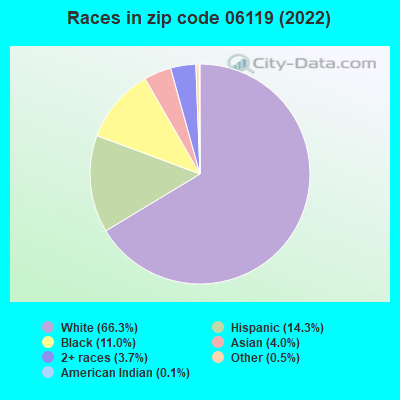


 Nearest zip codes: 06105, 06110, 06107, 06106, 06160, 06117.
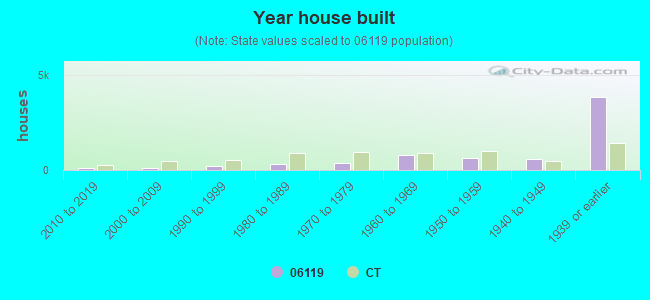

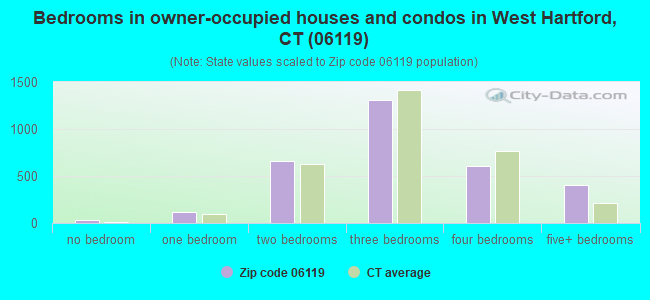
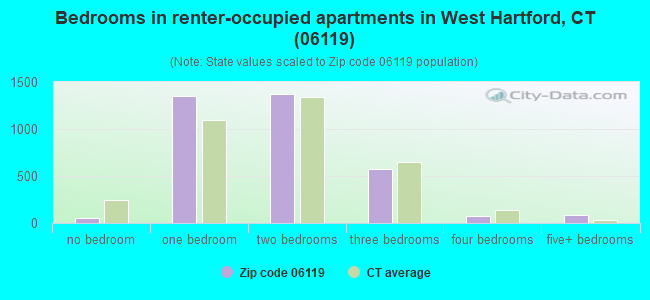
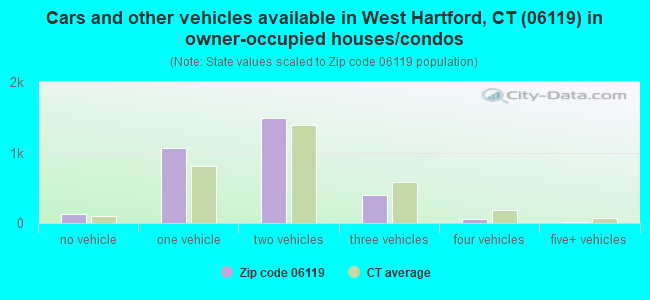
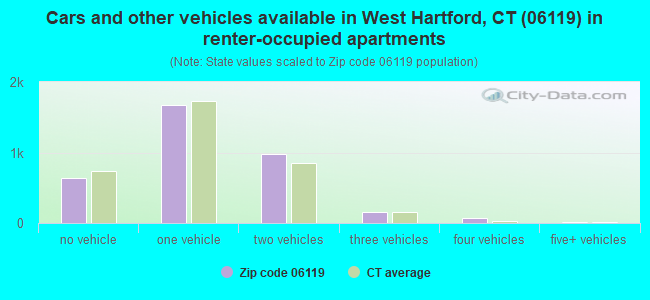


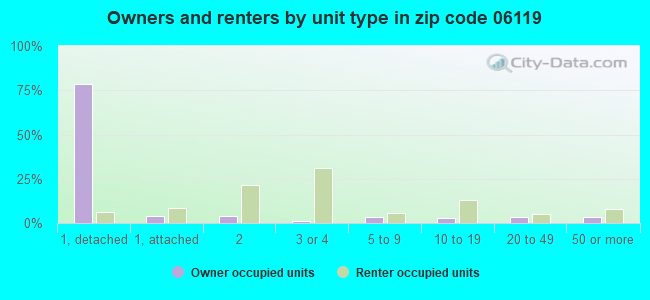
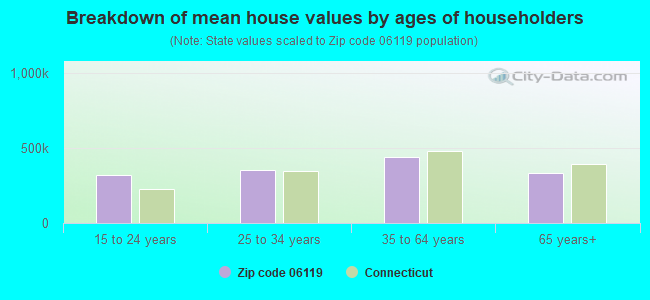


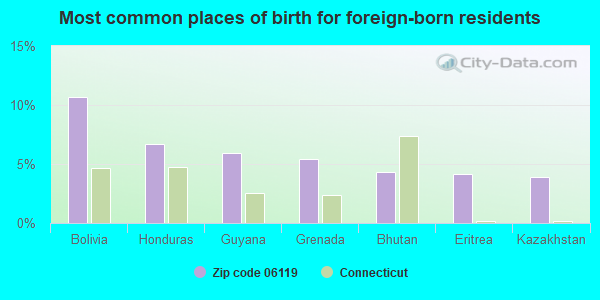
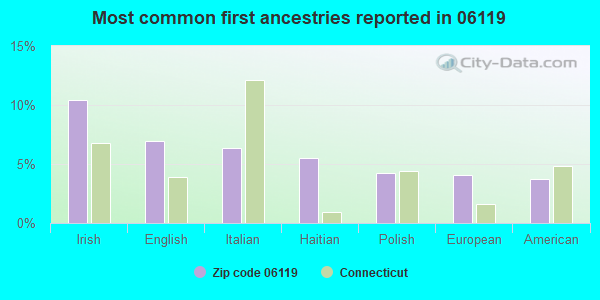
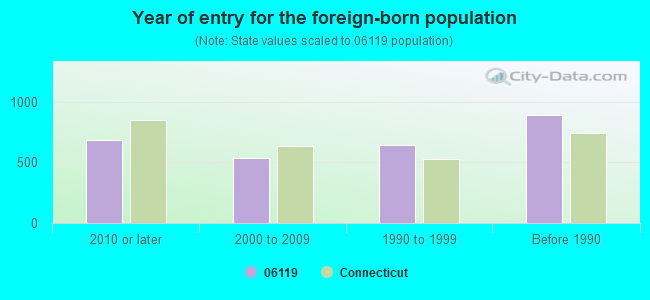


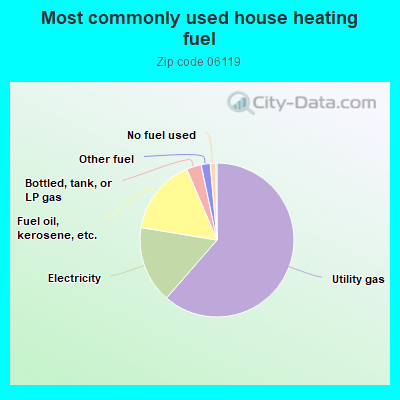
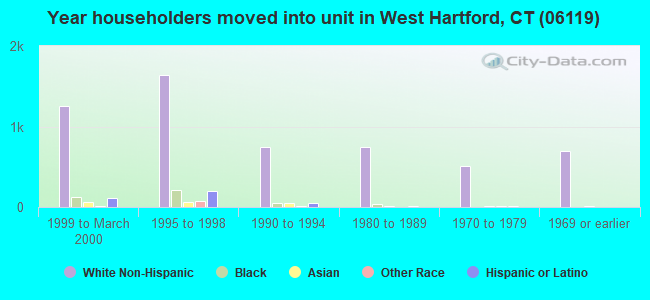
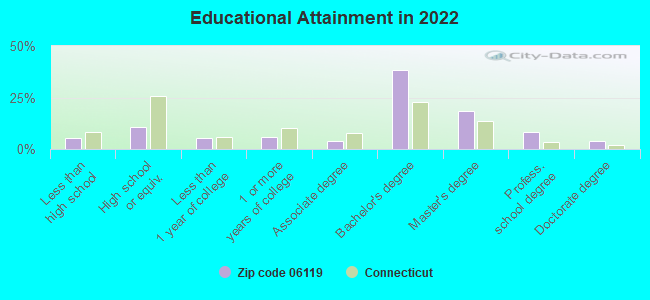
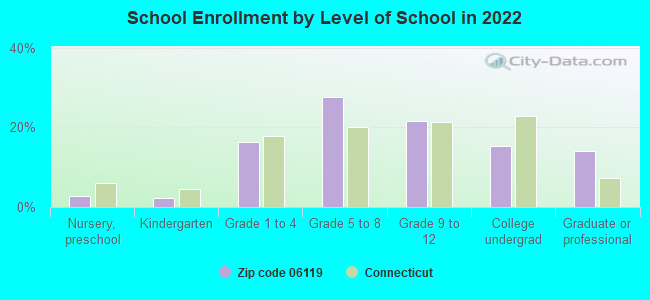
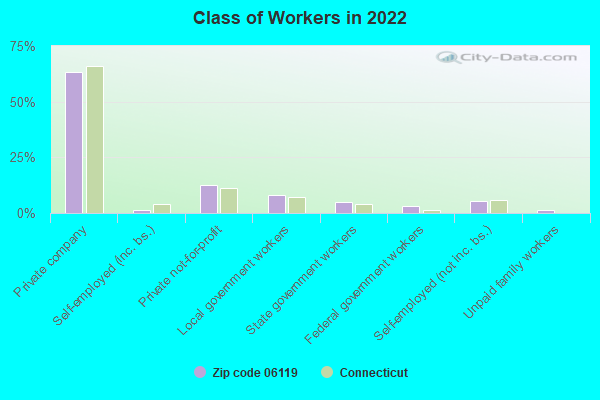
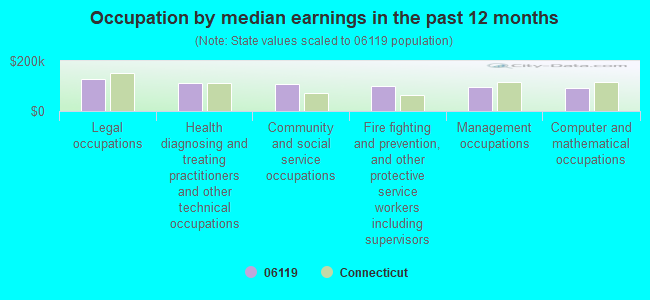
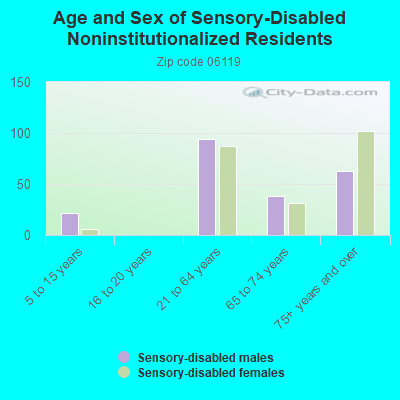
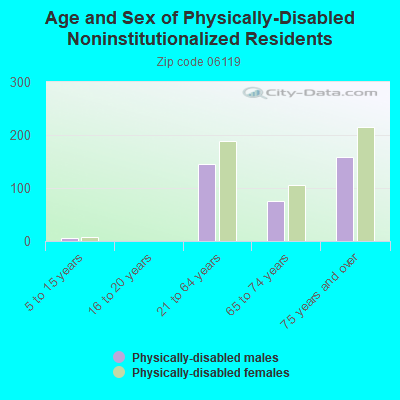
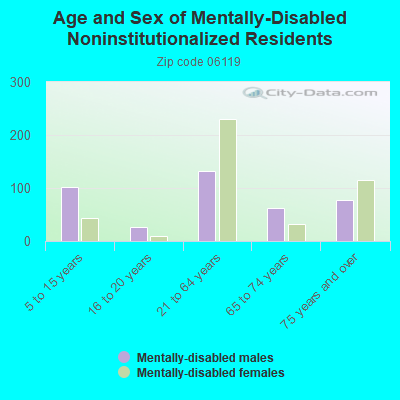
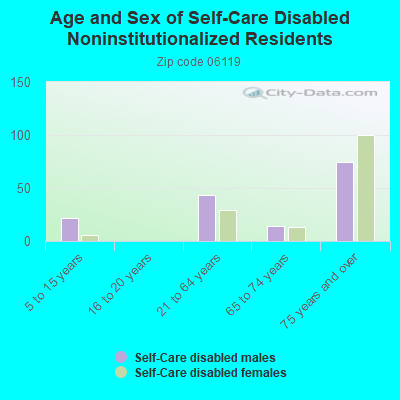
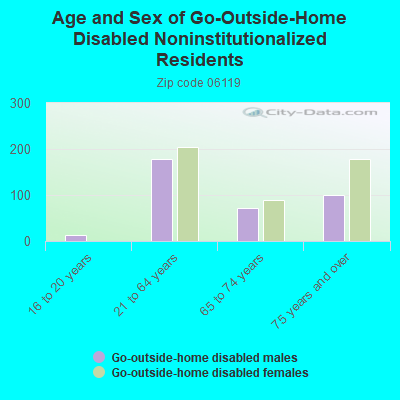
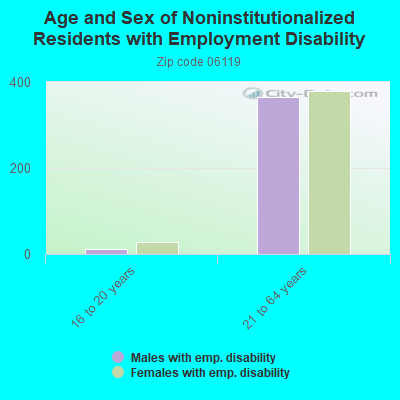
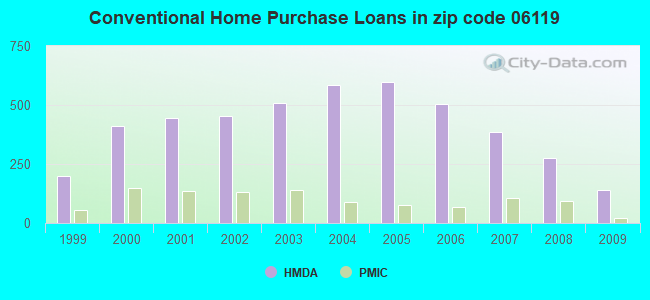
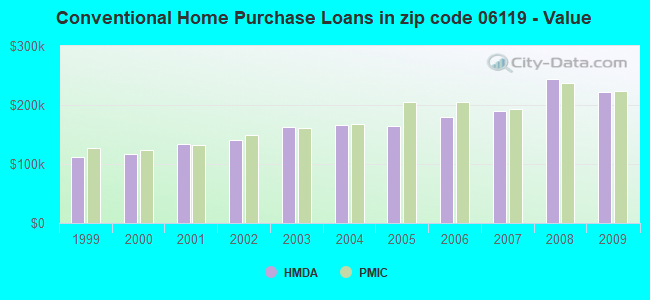
 According to the data from the years 2002 - 2018 the average number of fire incidents per year is 28. The highest number of reported fires - 42 took place in 2010, and the least - 13 in 2003. The data has a constant trend.
 When looking into fire subcategories, the most incidents belonged to: Structure Fires (56.0%), and Outside Fires (25.4%).