Estimated zip code population in 2022: 4,238 Zip code population in 2010: 4,744 Zip code population in 2000: 4,727
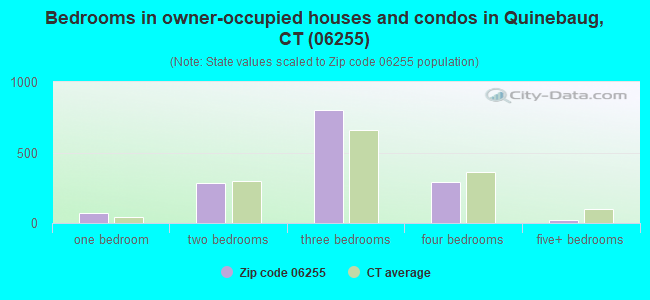
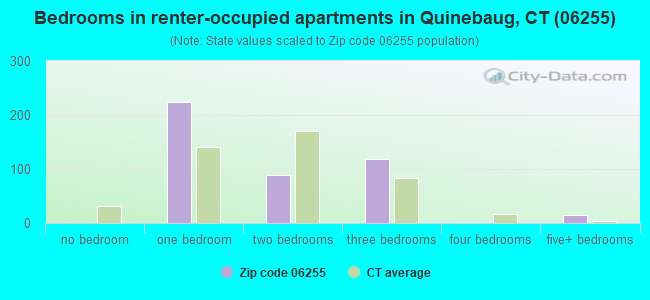
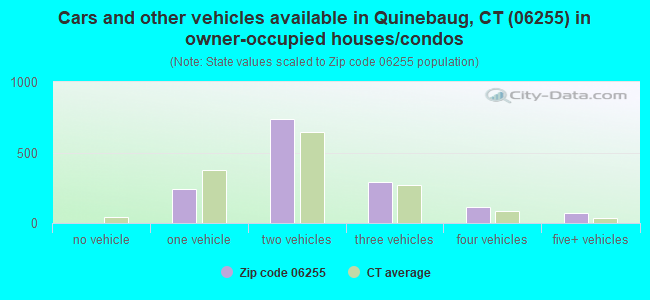
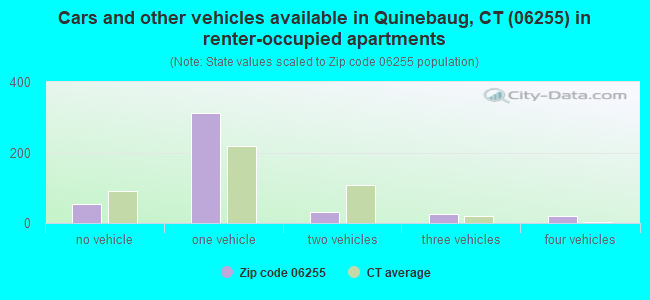
Houses and condos: 2,016 Renter-occupied apartments: 445
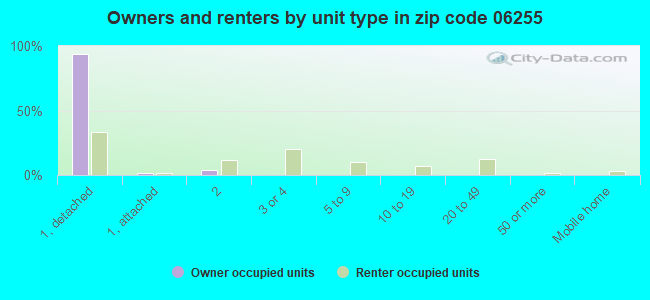
% of renters here:
23%
State:
34%
March 2022 cost of living index in zip code 06255: 109.5 (more than average, U.S. average is 100)
Land area: 22.7 sq. mi. Water area: 0.7 sq. mi.
Population density: 186 people per square mile
(very low).
OSM Map
Google Map
MSN Map
OSM Map
General Map
Google Map
MSN Map
OSM Map
Google Map
MSN Map
OSM Map
Google Map
MSN Map
Please wait while loading the map...
Real estate property taxes paid for housing units in 2022:
This zip code:
1.2% ($3,377)
Connecticut:
1.8% ($6,189)
Median real estate property taxes paid for housing units with mortgages in 2022: $3,211 (1.2%) Median real estate property taxes paid for housing units with no mortgage in 2022: $3,940 (1.3%)
Business Search- 14 Million verified businesses
Males: 2,069
(48.8%)
Females: 2,168
(51.2%)
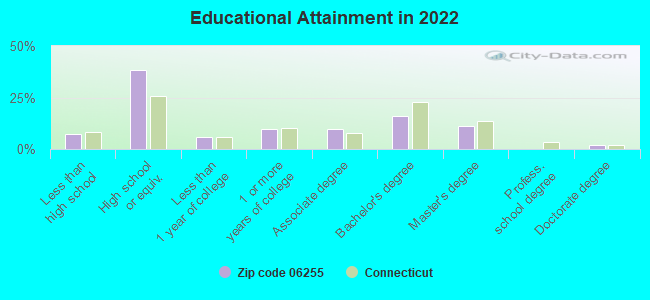
For population 25 years and over in 06255:
High school or higher: 92.6%
Bachelor's degree or higher: 28.9%
Graduate or professional degree: 12.8%
Unemployed: 2.9%
Mean travel time to work (commute): 28.8 minutes
For population 15 years and over in 06255:
Never married: 27.8%
Now married: 49.2%
Separated: 1.2%
Widowed: 5.8%
Divorced: 16.0%
Zip code 06255 compared to state average:
Black race population percentage significantly below state average.
Hispanic race population percentage significantly below state average.
Median age significantly above state average.
Foreign-born population percentage significantly below state average.
Length of stay since moving in significantly above state average.
Averages for the 2020 tax year for zip code 06255, filed in 2021:
Average Adjusted Gross Income (AGI) in 2020: $62,698 (Individual Income Tax Returns)
Here:
$62,698
State:
$105,931
Salary/wage: $55,852 (reported on 85.8% of returns)
Here:
$55,852
State:
$83,540
(% of AGI for various income ranges: 1034.1% for AGIs below $25k, 3642.7% for AGIs $25k-50k, 6367.9% for AGIs $50k-75k, 9236.7% for AGIs $75k-100k, 15535.8% for AGIs $100k-200k)
Taxable interest for individuals: $692 (reported on 31.6% of returns)
This zip code:
$692
Connecticut:
$3,402
(% of AGI for various income ranges: 17.6% for AGIs below $25k, 23.3% for AGIs $25k-50k, 27.0% for AGIs $50k-75k, 48.6% for AGIs $75k-100k, 33.3% for AGIs $100k-200k)
Ordinary dividends: $1,739 (reported on 14.7% of returns)
Here:
$1,739
State:
$12,683
(% of AGI for various income ranges: 7.3% for AGIs below $25k, 15.1% for AGIs $25k-50k, 24.5% for AGIs $50k-75k, 34.8% for AGIs $75k-100k, 47.1% for AGIs $100k-200k)
Net capital gain/loss in AGI: +$10,258 (reported on 11.6% of returns)
Here:
+$10,258
State:
+$44,158
(% of AGI for various income ranges: 5.1% for AGIs below $25k, 18.2% for AGIs $25k-50k, 35.2% for AGIs $50k-75k, 75.2% for AGIs $75k-100k, 243.3% for AGIs $100k-200k)
Profit/loss from business: +$18,848 (reported on 10.2% of returns)
Here:
+$18,848
State:
+$22,988
(% of AGI for various income ranges: 78.3% for AGIs below $25k, 195.6% for AGIs $25k-50k, 215.8% for AGIs $50k-75k, 371.9% for AGIs $75k-100k, 683.8% for AGIs $100k-200k)
Taxable individual retirement arrangement distribution: $18,517 (reported on 8.0% of returns)
06255:
$18,517
Connecticut:
$22,031
(% of AGI for various income ranges: 82.9% for AGIs below $25k, 95.1% for AGIs $25k-50k, 116.7% for AGIs $50k-75k, 258.1% for AGIs $75k-100k, 682.5% for AGIs $100k-200k)
Total itemized deductions: $21,713 (reported on 6.7% of returns)
Here:
$21,713
State:
$37,613
(% of AGI for various income ranges: 89.8% for AGIs below $25k, 285.2% for AGIs $50k-75k, 407.6% for AGIs $75k-100k, 455.0% for AGIs $100k-200k)
Charity contributions: $2,812 (reported on 3.6% of returns)
Here:
$2,812
State:
$13,557
(% of AGI for various income ranges: 17.6% for AGIs $50k-75k, 25.7% for AGIs $75k-100k, 47.1% for AGIs $100k-200k)
Taxes paid: $7,647 (reported on 6.7% of returns)
06255:
$7,647
State:
$9,096
(% of AGI for various income ranges: 26.6% for AGIs below $25k, 98.8% for AGIs $50k-75k, 159.5% for AGIs $75k-100k, 157.1% for AGIs $100k-200k)
Earned income credit: $1,987 (reported on 10.2% of returns)
Here:
$1,987
State:
$2,059
(% of AGI for various income ranges: 57.1% for AGIs below $25k, 49.6% for AGIs $25k-50k)
Percentage of individuals using paid preparers for their 2020 taxes: 94.7%
Here:
95%
State:
93%
(% for various income ranges: 92.9% for AGIs below $25k, 94.7% for AGIs $25k-50k, 93.0% for AGIs $50k-75k, 96.6% for AGIs $75k-100k, 97.1% for AGIs $100k-200k, 100.0% for AGIs over 200k)
Averages for the 2012 tax year for zip code 06255, filed in 2013:
Average Adjusted Gross Income (AGI) in 2012: $50,316 (Individual Income Tax Returns)
Here:
$50,316
State:
$93,290
Salary/wage: $46,335 (reported on 88.0% of returns)
Here:
$46,335
State:
$73,117
(% of AGI for various income ranges: 75.9% for AGIs below $25k, 83.2% for AGIs $25k-50k, 81.3% for AGIs $50k-75k, 82.7% for AGIs $75k-100k, 80.1% for AGIs $100k-200k)
Taxable interest for individuals: $576 (reported on 42.1% of returns)
This zip code:
$576
Connecticut:
$2,530
(% of AGI for various income ranges: 1.4% for AGIs below $25k, 0.5% for AGIs $25k-50k, 0.3% for AGIs $50k-75k, 0.5% for AGIs $75k-100k, 0.3% for AGIs $100k-200k)
Ordinary dividends: $867 (reported on 15.8% of returns)
Here:
$867
State:
$10,909
(% of AGI for various income ranges: 0.6% for AGIs below $25k, 0.2% for AGIs $25k-50k, 0.2% for AGIs $50k-75k, 0.3% for AGIs $75k-100k, 0.3% for AGIs $100k-200k)
Net capital gain/loss in AGI: +$1,435 (reported on 8.1% of returns)
Here:
+$1,435
State:
+$34,090
(% of AGI for various income ranges: 0.7% for AGIs $100k-200k)
Profit/loss from business: +$12,000 (reported on 11.0% of returns)
Here:
+$12,000
State:
+$22,741
(% of AGI for various income ranges: 4.5% for AGIs below $25k, 2.9% for AGIs $25k-50k, 2.2% for AGIs $50k-75k, 1.8% for AGIs $75k-100k, 2.7% for AGIs $100k-200k)
Taxable individual retirement arrangement distribution: $12,367 (reported on 10.0% of returns)
06255:
$12,367
Connecticut:
$19,976
(% of AGI for various income ranges: 2.8% for AGIs below $25k, 2.1% for AGIs $25k-50k, 2.2% for AGIs $50k-75k, 2.3% for AGIs $75k-100k, 2.9% for AGIs $100k-200k)
Total itemized deductions: $17,246 (21% of AGI, reported on 35.4% of returns)
Here:
$17,246
State:
$33,239
Here:
21.3% of AGI
State:
18.9% of AGI
(% of AGI for various income ranges: 7.3% for AGIs below $25k, 9.7% for AGIs $25k-50k, 11.8% for AGIs $50k-75k, 13.8% for AGIs $75k-100k, 14.0% for AGIs $100k-200k)
Charity contributions: $1,492 (reported on 24.4% of returns)
Here:
$1,492
State:
$4,947
(% of AGI for various income ranges: 0.6% for AGIs $25k-50k, 0.6% for AGIs $50k-75k, 0.8% for AGIs $75k-100k, 1.0% for AGIs $100k-200k)
Taxes paid: $7,559 (reported on 34.9% of returns)
06255:
$7,559
State:
$17,397
(% of AGI for various income ranges: 1.8% for AGIs below $25k, 3.2% for AGIs $25k-50k, 4.6% for AGIs $50k-75k, 5.7% for AGIs $75k-100k, 7.4% for AGIs $100k-200k)
Earned income credit: $1,989 (reported on 12.9% of returns)
Here:
$1,989
State:
$2,053
(% of AGI for various income ranges: 4.8% for AGIs below $25k, 0.7% for AGIs $25k-50k)
Percentage of individuals using paid preparers for their 2012 taxes: 57.9%
Here:
58%
State:
55%
(% for various income ranges: 50.7% for AGIs below $25k, 55.4% for AGIs $25k-50k, 60.5% for AGIs $50k-75k, 66.7% for AGIs $75k-100k, 70.4% for AGIs $100k-200k)
Averages for the 2004 tax year for zip code 06255, filed in 2005:
Average Adjusted Gross Income (AGI) in 2004: $44,180 (Individual Income Tax Returns)
Here:
$44,180
State:
$73,265
Salary/wage: $41,257 (reported on 88.7% of returns)
Here:
$41,257
State:
$62,030
(% of AGI for various income ranges: 109.7% for AGIs below $10k, 77.5% for AGIs $10k-25k, 82.7% for AGIs $25k-50k, 87.1% for AGIs $50k-75k, 88.7% for AGIs $75k-100k, 72.6% for AGIs over 100k)
Taxable interest for individuals: $810 (reported on 54.8% of returns)
This zip code:
$810
Connecticut:
$2,287
(% of AGI for various income ranges: 5.8% for AGIs below $10k, 2.4% for AGIs $10k-25k, 0.9% for AGIs $25k-50k, 0.5% for AGIs $50k-75k, 0.6% for AGIs $75k-100k, 1.2% for AGIs over 100k)
Taxable dividends: $1,538 (reported on 22.6% of returns)
Here:
$1,538
State:
$5,735
(% of AGI for various income ranges: 4.6% for AGIs below $10k, 0.8% for AGIs $10k-25k, 0.6% for AGIs $25k-50k, 0.4% for AGIs $50k-75k, 0.5% for AGIs $75k-100k, 1.6% for AGIs over 100k)
Net capital gain/loss: +$3,243 (reported on 12.9% of returns)
Here:
+$3,243
State:
+$23,694
(% of AGI for various income ranges: -2.0% for AGIs below $10k, -0.3% for AGIs $10k-25k, 0.2% for AGIs $25k-50k, 0.1% for AGIs $50k-75k, 0.6% for AGIs $75k-100k, 3.7% for AGIs over 100k)
Profit/loss from business: +$12,135 (reported on 13.4% of returns)
Here:
+$12,135
State:
+$20,783
(% of AGI for various income ranges: 7.4% for AGIs below $10k, 6.1% for AGIs $10k-25k, 3.7% for AGIs $25k-50k, 4.4% for AGIs $50k-75k, 3.7% for AGIs $75k-100k, 1.6% for AGIs over 100k)
IRA payment deduction: $2,855 (reported on 3.1% of returns)
06255:
$2,855
Connecticut:
$3,216
(% of AGI for various income ranges: 0.3% for AGIs $10k-25k, 0.3% for AGIs $25k-50k, 0.3% for AGIs $50k-75k, 0.2% for AGIs $75k-100k)
Total itemized deductions: $15,104 (21% of AGI, reported on 36.4% of returns)
Here:
$15,104
State:
$24,919
Here:
21.2% of AGI
State:
18.6% of AGI
(% of AGI for various income ranges: 12.2% for AGIs below $10k, 6.4% for AGIs $10k-25k, 11.9% for AGIs $25k-50k, 12.6% for AGIs $50k-75k, 14.7% for AGIs $75k-100k, 13.2% for AGIs over 100k)
Charity contributions deductions: $1,432 (2% of AGI, reported on 31.0% of returns)
Here:
$1,432
State:
$3,762
Here:
1.9% of AGI
State:
2.7% of AGI
(% of AGI for various income ranges: 0.4% for AGIs $10k-25k, 0.9% for AGIs $25k-50k, 1.0% for AGIs $50k-75k, 1.2% for AGIs $75k-100k, 1.3% for AGIs over 100k)
Total tax: $5,432 (reported on 81.6% of returns)
06255:
$5,432
State:
$15,148
(% of AGI for various income ranges: 3.1% for AGIs below $10k, 5.2% for AGIs $10k-25k, 7.7% for AGIs $25k-50k, 8.7% for AGIs $50k-75k, 10.6% for AGIs $75k-100k, 15.9% for AGIs over 100k)
Earned income credit: $1,525 (reported on 8.9% of returns)
Here:
$1,525
State:
$1,570
Percentage of individuals using paid preparers for their 2004 taxes: 63.4%
Here:
63%
State:
59%
(% for various income ranges: 47.2% for AGIs below $10k, 61.5% for AGIs $10k-25k, 65.8% for AGIs $25k-50k, 69.8% for AGIs $50k-75k, 68.4% for AGIs $75k-100k, 74.4% for AGIs over 100k)
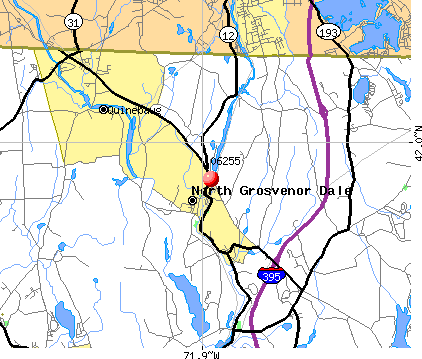
Notable locations in zip code 06255: West Thompson Campground (A), West Thompson Fire Department Station 82 (B), Thompson Public Library (C), Community Fire Company Station 81 (D). Display/hide their locations on the map
Churches in zip code 06255 include: Abundant Life United Church (A), North Grosvenordale Methodist Church (B), Saint Joseph Roman Catholic Church (C), Windham County Parish Church (D). Display/hide their locations on the map
Cemeteries: Saint Joseph Cemetery (1), Tourtellot Cemetery (2), Swiss Cemetery (3), Upham Cemetery (4), West Thompson Cemetery (5). Display/hide their locations on the map
Lakes and reservoirs: Whitkowski Ponds (A), Langers Pond (B), Lilly Pond (C), Lily Pond (D), Auger Pond (E), Perry Pond (F), Ravenell Ponds (G), North Grosvenordale Pond (H). Display/hide their locations on the map
Streams, rivers, and creeks: Shunway Brook (A), Backwater Brook (B), Baptist Brook (C), Tufts Branch (D), Sunset Hill Brook (E), Stoud Brook (F), Knowlton Brook (G). Display/hide their locations on the map
In group quarters: 5 (-1 institutionalized population)
Size of family households: 704 2-persons, 347 3-persons, 187 4-persons, 25 5-persons, 32 6-persons, 10 7-or-more-persons
Size of nonfamily households: 443 1-person, 149 2-persons, 14 3-persons
275 married couples with children.
263 single-parent households (25 men, 238 women).
93.9% of residents of 06255 zip code speak English at home.
2.3% of residents speak Spanish at home (100% very well).
2.3% of residents speak other Indo-European language at home (55% very well, 45% well).
0.9% of residents speak Asian or Pacific Island language at home (100% very well).
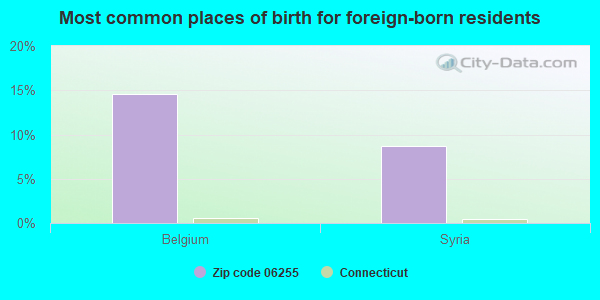
Foreign born population: 103 (2.4%) (54.9% of them are naturalized citizens)
This zip code:
2.4%
Whole state:
15.7%
15%Belgium
9%Syria
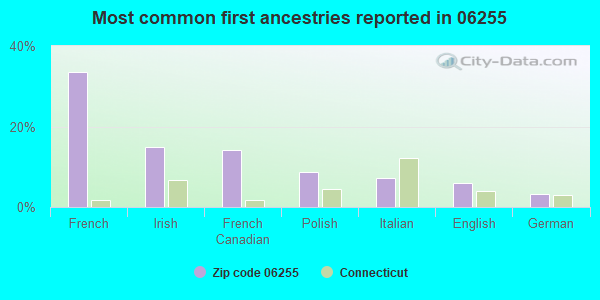
33%French
15%Irish
14%French Canadian
9%Polish
7%Italian
6%English
3%German
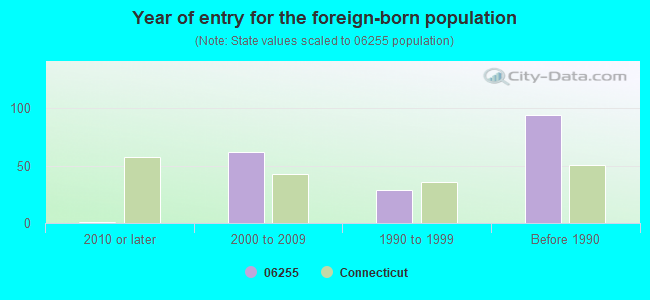
Year of entry for the foreign-born population
12010 or later
622000 to 2009
291990 to 1999
94Before 1990
Facilities with environmental interests located in this zip code:
GARVAIS GARAGE INC (873 WEBSTER RD in NORTH GROSVENORDALE, CT)
(Resource Conservation and Recovery Act (tracking hazardous waste)) Organizations: DF& RA GARVAIS (CONTACT/OWNER)
PACKAGE SYSTEMS CORP (RIVER ST in NORTH GROSVENORDALE, CT)
(Resource Conservation and Recovery Act (tracking hazardous waste)) Organizations: PINGETON CHARLES PRES (CONTACT/OWNER)
BELDING CHEMICAL INDUSTRIES (RTE 12 & BLAIN RD in NORTH GROSVENORDALE, CT)
AIR MINOR (AIRS/AFS) Business SIC classification: PLASTICS MATERIALS, SYNTHETIC RESINS, AND NONVULCANIZABLE ELASTOMERS
DERAN CONFECTIONARY CO (RTE 12 & CENTRAL ST in NORTH GROSVENORDALE, CT)
AIR MINOR (AIRS/AFS) Business SIC classification: CANDY AND OTHER CONFECTIONERY PRODUCTS Alternative names: DERAN CONFECTIONERY
NORTHEAST UTILITIES (RTE 12 in NORTH GROSVENORDALE, CT)
COMPLIANCE ACTIVITY (Tracking inspections of insecticide, fungicide, and rodenticide, and toxic substances)
Housing units lacking complete plumbing facilities: 0.8% Housing units lacking complete kitchen facilities: 0.6%
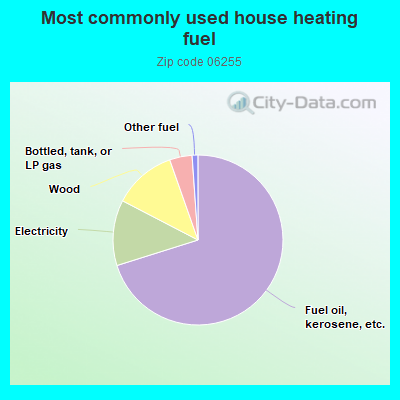
70.3%Fuel oil, kerosene, etc.
12.5%Electricity
12.0%Wood
4.3%Bottled, tank, or LP gas
1.1%Other fuel
Population in 1990: 5,641.
Place of birth for U.S.-born residents:
This state: 1,536
Northeast: 2,251
Midwest: 42
South: 141
West: 100
68% of the 06255 zip code residents lived in the same house 5 years ago. Out of people who lived in different houses, 57% lived in this county. Out of people who lived in different counties, 50% lived in Connecticut.
92% of the 06255 zip code residents lived in the same house 1 year ago. Out of people who lived in different houses, 41% moved from this county. Out of people who lived in different houses, 6% moved from different county within same state. Out of people who lived in different houses, 64% moved from different state.
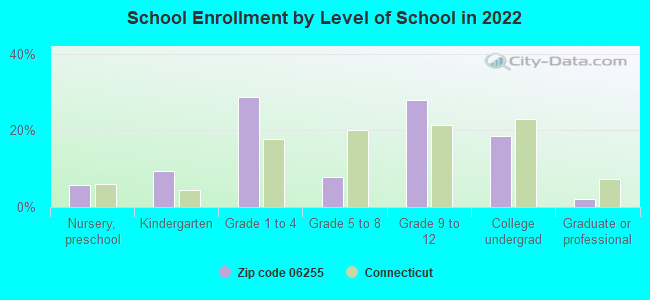
Private vs. public school enrollment:
Students in private schools in grades 1 to 8 (elementary and middle school): 51
Here:
21.0%
Connecticut:
9.5%
Students in private schools in grades 9 to 12 (high school): 74
Here:
39.9%
Connecticut:
12.9%
Students in private undergraduate colleges:
Here:
0.0%
Connecticut:
35.5%
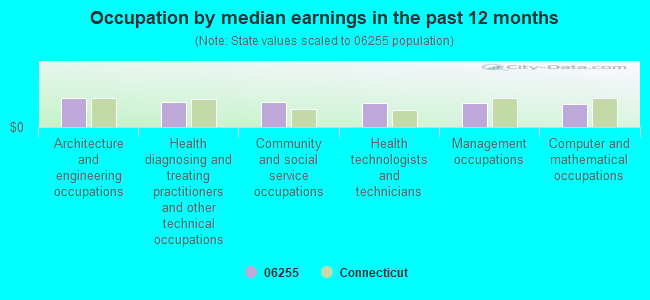
Occupation by median earnings in the past 12 months ($)
106,456Architecture and engineering occupations
91,498Health diagnosing and treating practitioners and other technical occupations
89,491Community and social service occupations
85,976Health technologists and technicians
85,832Management occupations
83,704Computer and mathematical occupations
Top industries in this zip code by the number of employees in 2005:
Management of Companies and Enterprises: Corporate, Subsidiary, and Regional Managing Offices (100-249 employees: 1 establishment)
Wholesale Trade: Other Miscellaneous Durable Goods Merchant Wholesalers (20-49: 1)
Health Care and Social Assistance: Offices of Physicians (except Mental Health Specialists) (10-19: 2, 1-4: 1)
Health Care and Social Assistance: Child Day Care Services (10-19: 2)
Accommodation and Food Services: Full-Service Restaurants (10-19: 1, 1-4: 1)
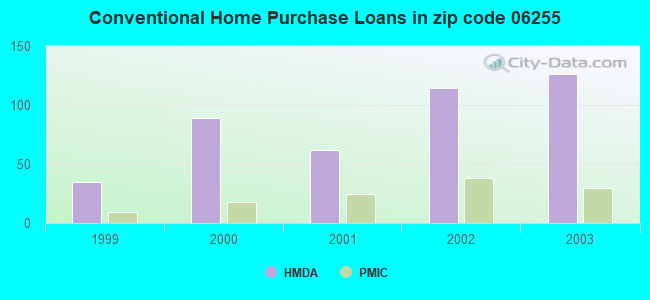
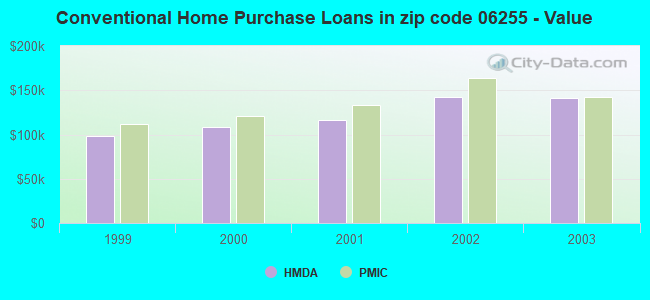
Detailed PMIC statistics for the following Tracts:9001.00
, 9002.00
2002 - 2018 National Fire Incident Reporting System (NFIRS) incidents
According to the data from the years 2002 - 2018 the average number of fire incidents per year is 20. The highest number of reported fires - 56 took place in 2016, and the least - 1 in 2011. The data has a rising trend.
When looking into fire subcategories, the most reports belonged to: Structure Fires (44.2%), and Outside Fires (38.5%).
Fire incident types reported to NFIRS in Zip Code 06255


 Nearest zip codes: 06262, 06277, 01571, 01570, 06260, 06281.


 According to the data from the years 2002 - 2018 the average number of fire incidents per year is 20. The highest number of reported fires - 56 took place in 2016, and the least - 1 in 2011. The data has a rising trend.
 When looking into fire subcategories, the most reports belonged to: Structure Fires (44.2%), and Outside Fires (38.5%).