Estimated zip code population in 2022: 3,350 Zip code population in 2010: 3,162 Zip code population in 2000: 3,246
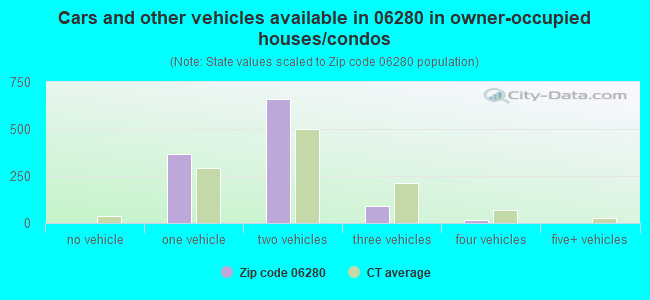
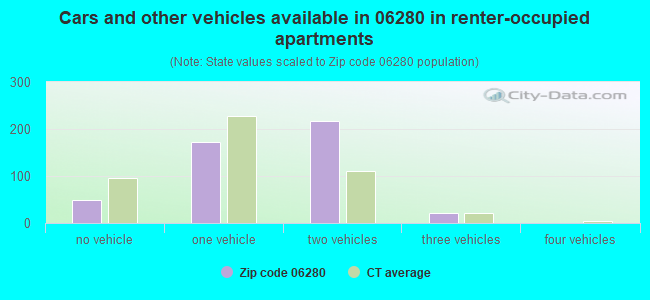
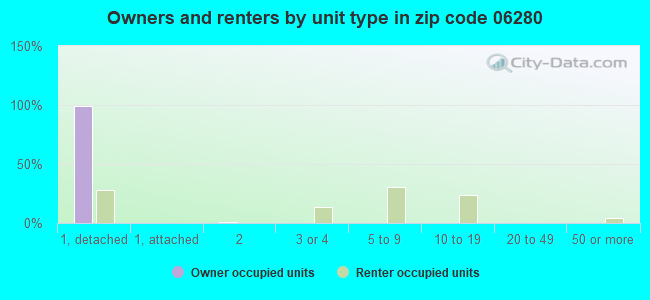
Houses and condos: 1,598 Renter-occupied apartments: 462
% of renters here:
29%
State:
34%
March 2022 cost of living index in zip code 06280: 110.2 (more than average, U.S. average is 100)
Land area: 14.5 sq. mi. Water area: 0.5 sq. mi.
Population density: 231 people per square mile
(very low).
OSM Map
Google Map
MSN Map
OSM Map
General Map
Google Map
MSN Map
OSM Map
Google Map
MSN Map
OSM Map
Google Map
MSN Map
Please wait while loading the map...
Real estate property taxes paid for housing units in 2022:
This zip code:
2.1% ($4,633)
Connecticut:
1.8% ($6,189)
Median real estate property taxes paid for housing units with mortgages in 2022: $5,238 (2.4%) Median real estate property taxes paid for housing units with no mortgage in 2022: $4,412 (1.9%)
Business Search- 14 Million verified businesses
Males: 1,623
(48.5%)
Females: 1,726
(51.5%)
For population 25 years and over in 06280:
High school or higher: 92.7%
Bachelor's degree or higher: 17.3%
Graduate or professional degree: 10.0%
Unemployed: 4.8%
Mean travel time to work (commute): 25.0 minutes
For population 15 years and over in 06280:
Never married: 35.4%
Now married: 37.9%
Separated: 0.6%
Widowed: 6.0%
Divorced: 20.1%
Zip code 06280 compared to state average:
Median house value below state average.
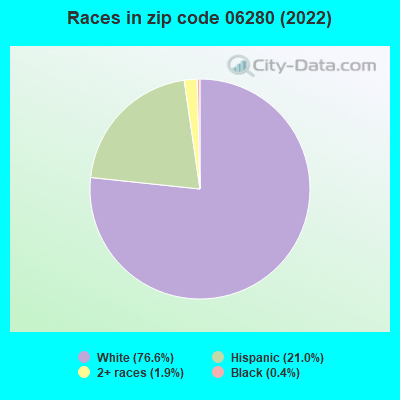
Black race population percentage significantly below state average.
Median age above state average.
Foreign-born population percentage significantly below state average.
Length of stay since moving in significantly above state average.
Number of college students below state average.
Percentage of population with a bachelor's degree or higher below state average.
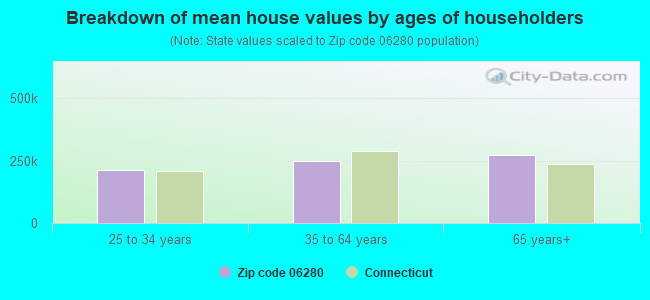
Estimated median house/condo value in 2022: $224,388
06280:
$224,388
Connecticut:
$347,200
According to our research of Connecticut and other state lists, there were 3 registered sex offenders living in 06280 zip code as of May 28, 2024. The ratio of all residents to sex offenders in zip code 06280 is 1,055 to 1. The ratio of registered sex offenders to all residents in this zip code is lower than the state average.
Median resident age:
This zip code:
48.7 years
Connecticut median age:
40.9 years
Average household size:
This zip code:
2.0 people
Connecticut:
2.5 people
Averages for the 2020 tax year for zip code 06280, filed in 2021:
Average Adjusted Gross Income (AGI) in 2020: $65,055 (Individual Income Tax Returns)
Here:
$65,055
State:
$105,931
Salary/wage: $55,217 (reported on 80.6% of returns)
Here:
$55,217
State:
$83,540
(% of AGI for various income ranges: 1098.3% for AGIs below $25k, 3531.5% for AGIs $25k-50k, 6222.2% for AGIs $50k-75k, 8956.9% for AGIs $75k-100k, 12796.5% for AGIs $100k-200k)
Taxable interest for individuals: $740 (reported on 33.3% of returns)
This zip code:
$740
Connecticut:
$3,402
(% of AGI for various income ranges: 9.0% for AGIs below $25k, 17.0% for AGIs $25k-50k, 30.0% for AGIs $50k-75k, 59.2% for AGIs $75k-100k, 84.5% for AGIs $100k-200k)
Ordinary dividends: $3,332 (reported on 18.8% of returns)
Here:
$3,332
State:
$12,683
(% of AGI for various income ranges: 14.8% for AGIs below $25k, 23.0% for AGIs $25k-50k, 79.1% for AGIs $50k-75k, 60.8% for AGIs $75k-100k, 184.0% for AGIs $100k-200k)
Net capital gain/loss in AGI: +$7,156 (reported on 15.2% of returns)
Here:
+$7,156
State:
+$44,158
(% of AGI for various income ranges: 0.3% for AGIs below $25k, 13.6% for AGIs $25k-50k, 33.0% for AGIs $50k-75k, 104.6% for AGIs $75k-100k, 186.0% for AGIs $100k-200k)
Profit/loss from business: +$9,400 (reported on 13.3% of returns)
Here:
+$9,400
State:
+$22,988
(% of AGI for various income ranges: 44.1% for AGIs below $25k, 146.1% for AGIs $25k-50k, 12.2% for AGIs $50k-75k, 329.2% for AGIs $75k-100k, 501.0% for AGIs $100k-200k)
Taxable individual retirement arrangement distribution: $15,028 (reported on 10.9% of returns)
06280:
$15,028
Connecticut:
$22,031
(% of AGI for various income ranges: 75.9% for AGIs below $25k, 60.0% for AGIs $25k-50k, 140.0% for AGIs $50k-75k, 430.8% for AGIs $75k-100k, 702.5% for AGIs $100k-200k)
Total itemized deductions: $24,136 (reported on 8.5% of returns)
Here:
$24,136
State:
$37,613
(% of AGI for various income ranges: 169.0% for AGIs below $25k, 378.7% for AGIs $50k-75k, 756.2% for AGIs $75k-100k, 517.5% for AGIs $100k-200k)
Charity contributions: $3,933 (reported on 5.5% of returns)
Here:
$3,933
State:
$13,557
(% of AGI for various income ranges: 26.5% for AGIs $50k-75k, 56.9% for AGIs $75k-100k, 109.5% for AGIs $100k-200k)
Taxes paid: $8,564 (reported on 8.5% of returns)
06280:
$8,564
State:
$9,096
(% of AGI for various income ranges: 47.6% for AGIs below $25k, 122.2% for AGIs $50k-75k, 282.3% for AGIs $75k-100k, 206.5% for AGIs $100k-200k)
Earned income credit: $1,681 (reported on 9.7% of returns)
Here:
$1,681
State:
$2,059
(% of AGI for various income ranges: 47.2% for AGIs below $25k, 40.0% for AGIs $25k-50k)
Percentage of individuals using paid preparers for their 2020 taxes: 92.1%
Here:
92%
State:
93%
(% for various income ranges: 92.1% for AGIs below $25k, 92.9% for AGIs $25k-50k, 93.3% for AGIs $50k-75k, 90.5% for AGIs $75k-100k, 93.1% for AGIs $100k-200k, 80.0% for AGIs over 200k)
Averages for the 2012 tax year for zip code 06280, filed in 2013:
Average Adjusted Gross Income (AGI) in 2012: $56,135 (Individual Income Tax Returns)
Here:
$56,135
State:
$93,290
Salary/wage: $48,266 (reported on 82.1% of returns)
Here:
$48,266
State:
$73,117
(% of AGI for various income ranges: 70.4% for AGIs below $25k, 79.0% for AGIs $25k-50k, 72.4% for AGIs $50k-75k, 67.0% for AGIs $75k-100k, 86.6% for AGIs $100k-200k)
Taxable interest for individuals: $793 (reported on 47.4% of returns)
This zip code:
$793
Connecticut:
$2,530
(% of AGI for various income ranges: 1.8% for AGIs below $25k, 0.8% for AGIs $25k-50k, 0.6% for AGIs $50k-75k, 1.1% for AGIs $75k-100k, 0.4% for AGIs $100k-200k)
Ordinary dividends: $2,974 (reported on 22.4% of returns)
Here:
$2,974
State:
$10,909
(% of AGI for various income ranges: 2.3% for AGIs below $25k, 0.5% for AGIs $25k-50k, 1.4% for AGIs $50k-75k, 1.4% for AGIs $75k-100k, 1.4% for AGIs $100k-200k)
Net capital gain/loss in AGI: +$1,414 (reported on 13.5% of returns)
Here:
+$1,414
State:
+$34,090
(% of AGI for various income ranges: 0.2% for AGIs $25k-50k, 0.2% for AGIs $75k-100k, 1.1% for AGIs $100k-200k)
Profit/loss from business: +$13,594 (reported on 10.9% of returns)
Here:
+$13,594
State:
+$22,741
(% of AGI for various income ranges: 4.4% for AGIs below $25k, 4.2% for AGIs $25k-50k, 2.1% for AGIs $50k-75k, 2.8% for AGIs $75k-100k, 2.3% for AGIs $100k-200k)
Taxable individual retirement arrangement distribution: $11,090 (reported on 12.8% of returns)
06280:
$11,090
Connecticut:
$19,976
(% of AGI for various income ranges: 2.3% for AGIs below $25k, 2.0% for AGIs $25k-50k, 2.0% for AGIs $50k-75k, 2.4% for AGIs $75k-100k, 4.0% for AGIs $100k-200k)
Total itemized deductions: $20,370 (22% of AGI, reported on 39.1% of returns)
Here:
$20,370
State:
$33,239
Here:
22.0% of AGI
State:
18.9% of AGI
(% of AGI for various income ranges: 10.2% for AGIs below $25k, 10.9% for AGIs $25k-50k, 15.3% for AGIs $50k-75k, 14.7% for AGIs $75k-100k, 16.6% for AGIs $100k-200k, 12.0% for AGIs over 200k)
Charity contributions: $2,324 (reported on 28.8% of returns)
Here:
$2,324
State:
$4,947
(% of AGI for various income ranges: 0.3% for AGIs below $25k, 0.6% for AGIs $25k-50k, 1.1% for AGIs $50k-75k, 1.3% for AGIs $75k-100k, 2.0% for AGIs $100k-200k)
Taxes paid: $9,797 (reported on 39.1% of returns)
06280:
$9,797
State:
$17,397
(% of AGI for various income ranges: 3.8% for AGIs below $25k, 3.9% for AGIs $25k-50k, 6.7% for AGIs $50k-75k, 6.9% for AGIs $75k-100k, 8.8% for AGIs $100k-200k, 8.0% for AGIs over 200k)
Earned income credit: $1,929 (reported on 10.9% of returns)
Here:
$1,929
State:
$2,053
(% of AGI for various income ranges: 4.0% for AGIs below $25k, 0.6% for AGIs $25k-50k)
Percentage of individuals using paid preparers for their 2012 taxes: 52.6%
Here:
53%
State:
55%
(% for various income ranges: 45.8% for AGIs below $25k, 46.3% for AGIs $25k-50k, 56.0% for AGIs $50k-75k, 57.9% for AGIs $75k-100k, 76.2% for AGIs $100k-200k)
Averages for the 2004 tax year for zip code 06280, filed in 2005:
Average Adjusted Gross Income (AGI) in 2004: $50,776 (Individual Income Tax Returns)
Here:
$50,776
State:
$73,265
Salary/wage: $46,191 (reported on 82.2% of returns)
Here:
$46,191
State:
$62,030
(% of AGI for various income ranges: 108.9% for AGIs below $10k, 65.7% for AGIs $10k-25k, 76.7% for AGIs $25k-50k, 79.1% for AGIs $50k-75k, 78.5% for AGIs $75k-100k, 69.0% for AGIs over 100k)
Taxable interest for individuals: $1,208 (reported on 61.3% of returns)
This zip code:
$1,208
Connecticut:
$2,287
(% of AGI for various income ranges: 8.4% for AGIs below $10k, 3.8% for AGIs $10k-25k, 1.0% for AGIs $25k-50k, 1.2% for AGIs $50k-75k, 0.9% for AGIs $75k-100k, 1.5% for AGIs over 100k)
Taxable dividends: $2,537 (reported on 27.6% of returns)
Here:
$2,537
State:
$5,735
(% of AGI for various income ranges: 4.3% for AGIs below $10k, 2.1% for AGIs $10k-25k, 0.6% for AGIs $25k-50k, 0.7% for AGIs $50k-75k, 1.4% for AGIs $75k-100k, 2.0% for AGIs over 100k)
Net capital gain/loss: +$3,417 (reported on 18.4% of returns)
Here:
+$3,417
State:
+$23,694
(% of AGI for various income ranges: -1.8% for AGIs below $10k, 0.2% for AGIs $10k-25k, 0.5% for AGIs $25k-50k, 0.1% for AGIs $50k-75k, 0.4% for AGIs $75k-100k, 3.3% for AGIs over 100k)
Profit/loss from business: +$18,799 (reported on 12.9% of returns)
Here:
+$18,799
State:
+$20,783
(% of AGI for various income ranges: 13.3% for AGIs below $10k, 5.0% for AGIs $10k-25k, 5.1% for AGIs $25k-50k, 3.1% for AGIs $50k-75k, 4.0% for AGIs $75k-100k, 5.9% for AGIs over 100k)
IRA payment deduction: $2,955 (reported on 2.9% of returns)
06280:
$2,955
Connecticut:
$3,216
Total itemized deductions: $16,958 (20% of AGI, reported on 39.6% of returns)
Here:
$16,958
State:
$24,919
Here:
20.2% of AGI
State:
18.6% of AGI
(% of AGI for various income ranges: 12.0% for AGIs $10k-25k, 9.4% for AGIs $25k-50k, 13.1% for AGIs $50k-75k, 16.7% for AGIs $75k-100k, 14.0% for AGIs over 100k)
Charity contributions deductions: $2,331 (3% of AGI, reported on 34.5% of returns)
Here:
$2,331
State:
$3,762
Here:
2.6% of AGI
State:
2.7% of AGI
(% of AGI for various income ranges: 0.8% for AGIs $10k-25k, 0.8% for AGIs $25k-50k, 1.3% for AGIs $50k-75k, 1.9% for AGIs $75k-100k, 2.3% for AGIs over 100k)
Total tax: $7,016 (reported on 84.8% of returns)
06280:
$7,016
State:
$15,148
(% of AGI for various income ranges: 3.9% for AGIs below $10k, 4.6% for AGIs $10k-25k, 8.1% for AGIs $25k-50k, 9.5% for AGIs $50k-75k, 10.7% for AGIs $75k-100k, 17.9% for AGIs over 100k)
Earned income credit: $1,480 (reported on 8.2% of returns)
Here:
$1,480
State:
$1,570
Percentage of individuals using paid preparers for their 2004 taxes: 54.8%
Here:
55%
State:
59%
(% for various income ranges: 47.7% for AGIs below $10k, 53.2% for AGIs $10k-25k, 54.5% for AGIs $25k-50k, 49.4% for AGIs $50k-75k, 63.6% for AGIs $75k-100k, 67.1% for AGIs over 100k)
Household received Food Stamps/SNAP in the past 12 months: 50 Household did not receive Food Stamps/SNAP in the past 12 months: 1,531
Women who had a birth in the past 12 months: 18 (17 now married, 0 unmarried) Women who did not have a birth in the past 12 months: 590 (155 now married, 440 unmarried)
Housing units in zip code 06280 with a mortgage: 558 (48 second mortgage, 49 both second mortgage and home equity loan) Median monthly owner costs for units with a mortgage: $1,560 Median monthly owner costs for units without a mortgage: $747
Residents with income below the poverty level in 2022:
This zip code:
8.6%
Whole state:
9.8%
Residents with income below 50% of the poverty level in 2022:
This zip code:
1.2%
Whole state:
4.8%
Median number of rooms in houses and condos:
Here:
5.6
State:
6.5
Median number of rooms in apartments:
Here:
3.9
State:
4.0
Notable locations in this zip code not listed on our city pages
Notable locations in zip code 06280: Windham Free Library Association (A), Scotland Public Library (B), Edward Waldo House Museum (C), Windham Center Fire Department (D). Display/hide their locations on the map
Lakes and reservoirs: Wetherbee Pond (A), Frog Pond (B), Indian Hollow Pond (C), Lymans Pond (D), Beaver Brook Pond (E), Potash Pond (F), Parker Pond (G), Lake Marie (H). Display/hide their locations on the map
Streams, rivers, and creeks: Merrick Brook (A), Natchaug River (B), Obwebetuck Brook (C), Potash Brook (D), Pottens Brook (E), Ballymahack Brook (F), Beaver Brook (G), Chestnut Hill Brook (H), Cold Brook (I). Display/hide their locations on the map
In group quarters: 215 (-1 institutionalized population)
Size of family households: 392 2-persons, 188 3-persons, 172 4-persons, 12 5-persons, 4 6-persons
Size of nonfamily households: 751 1-person, 70 2-persons, 9 4-persons
108 married couples with children.
301 single-parent households (58 men, 243 women).
79.0% of residents of 06280 zip code speak English at home.
18.5% of residents speak Spanish at home (99% very well, 1% well, 1% not at all).
3.7% of residents speak other Indo-European language at home (81% very well, 19% well).
Foreign born population: 92 (2.8%) (71.9% of them are naturalized citizens)
This zip code:
2.8%
Whole state:
15.7%
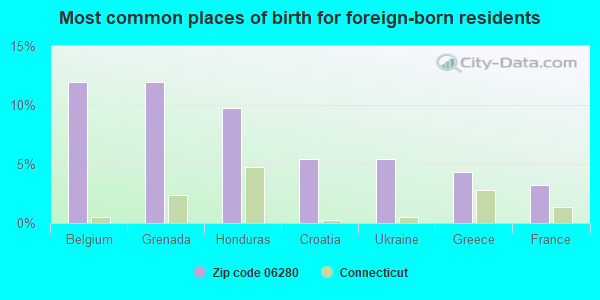
12%Belgium
12%Grenada
10%Honduras
5%Croatia
5%Ukraine
4%Greece
3%France
16%Irish
12%French Canadian
5%French
5%English
4%Italian
3%American
3%European
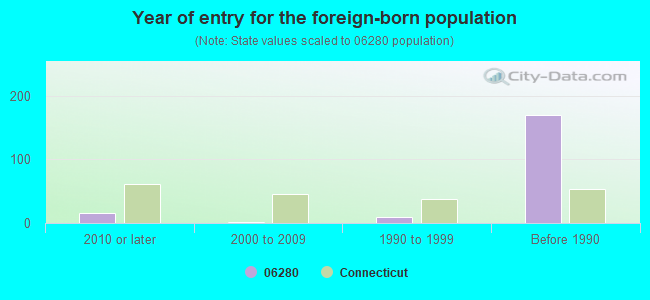
Year of entry for the foreign-born population
162010 or later
12000 to 2009
101990 to 1999
170Before 1990
Facilities with environmental interests located in this zip code:
DOUGLAS MANOR SKILLED NURSING & REHABILITATION (103 N RD RT 14 in WINDHAM, CT)
(Integrated Compliance Information System) - ICIS-01-2000-0079, FORMAL ENFORCEMENT ACTION COMMUNITY WATER SYSTEM (SDWIS) - SDWIS-CT1631031 46107, WATER TREATMENT PLANT
HAIN MATERIALS CORP (249 WINDHAM CENTER ROAD in WINDHAM, CT)
AIR MINOR (AIRS/AFS) CRITERIA AND HAZARDOUS AIR POLLUTANT INVENTORY (Inventory of air pollution sources) Conditionally Exempt Small Quantity Generators, less than 100 kg/month of hazardous waste (Resource Conservation and Recovery Act (tracking hazardous waste)) - notification Business SIC classification: ASPHALT PAVING MIXTURES AND BLOCKS
EDELMAN STEVEN (217 SCOTLAND RD in WINDHAM, CT)
(Resource Conservation and Recovery Act (tracking hazardous waste)) Organizations: STEVEN EDELMAN (CONTACT/OWNER)
BUILDER'S CONCRETE EAST LLC (74 N WINDHAM RD in WINDHAM, CT)
National Pollutant Discharge Elimination System NON-MAJOR (Tracking pollutant discharge elimination systems) - permit Alternative names: BUILDERS CONCRETE
CHRONICLE, THE (1 CHRONICLE RD in WINDHAM, CT)
AIR MINOR (AIRS/AFS) Business SIC classification: NEWSPAPERS: PUBLISHING, OR PUBLISHING AND PRINTING
AKIM ENGINEERING COMPANY, INC. (131 ASH STREET in WINDHAM, CT)
SUPERFUND (Superfund database)
NU SPILL (PROSPECT AVE in WINDHAM, CT)
COMPLIANCE ACTIVITY (Tracking inspections of insecticide, fungicide, and rodenticide, and toxic substances)
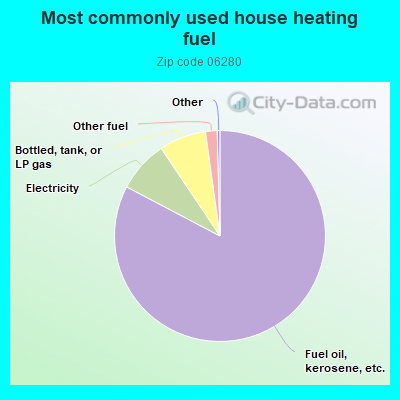
82.8%Fuel oil, kerosene, etc.
7.9%Electricity
7.2%Bottled, tank, or LP gas
1.8%Other fuel
Population in 1990: 3,337.
Place of birth for U.S.-born residents:
This state: 2,276
Northeast: 543
Midwest: 85
South: 89
West: 118
56% of the 06280 zip code residents lived in the same house 5 years ago. Out of people who lived in different houses, 60% lived in this county. Out of people who lived in different counties, 50% lived in Connecticut.
88% of the 06280 zip code residents lived in the same house 1 year ago. Out of people who lived in different houses, 27% moved from this county. Out of people who lived in different houses, 63% moved from different county within same state.
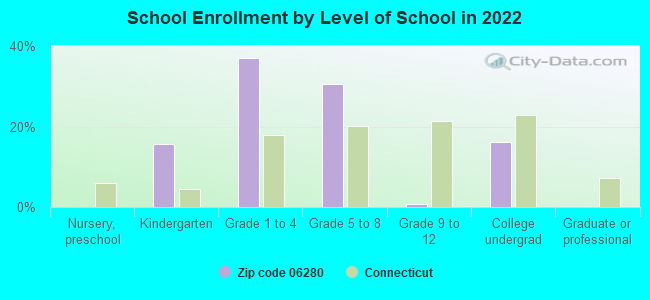
Private vs. public school enrollment:
Students in private schools in grades 1 to 8 (elementary and middle school):
Here:
0.0%
Connecticut:
9.5%
Students in private schools in grades 9 to 12 (high school):
Here:
0.0%
Connecticut:
12.9%
Students in private undergraduate colleges:
Here:
0.0%
Connecticut:
35.5%
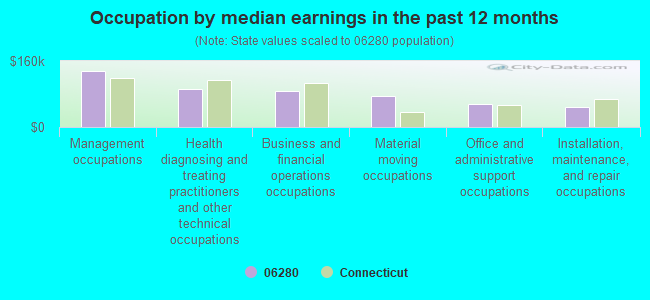
Occupation by median earnings in the past 12 months ($)
135,163Management occupations
92,260Health diagnosing and treating practitioners and other technical occupations
86,781Business and financial operations occupations
75,254Material moving occupations
56,952Office and administrative support occupations
48,627Installation, maintenance, and repair occupations
Top industries in this zip code by the number of employees in 2005:
Health Care and Social Assistance: Nursing Care Facilities (100-249 employees: 2 establishments)
Administrative and Support and Waste Management and Remediation Services: Landscaping Services (20-49: 1, 1-4: 1)
Construction: Highway, Street, and Bridge Construction (10-19: 1)
Other Services (except Public Administration): Religious Organizations (5-9: 1, 1-4: 1)
Other Services (except Public Administration): Civic and Social Organizations (5-9: 1)
Arts, Entertainment, and Recreation: Golf Courses and Country Clubs (5-9: 1)
People in group quarters in 2010:
193 people in nursing facilities/skilled-nursing facilities
3 people in group homes intended for adults
People in group quarters in 2000:
190 people in nursing homes
Fatal accident statistics in 2014:
Fatal accident count: 1
Vehicles involved in fatal accidents: 1
Fatal accidents caused by drunken drivers: 1
Fatalities: 1
Persons involved in fatal accidents: 1
Pedestrians involved in fatal accidents: 0
Fatal accident statistics in 2010:
Fatal accident count: 2
Vehicles involved in fatal accidents: 2
Fatal accidents caused by drunken drivers: 2
Fatalities: 2
Persons involved in fatal accidents: 2
Pedestrians involved in fatal accidents: 0
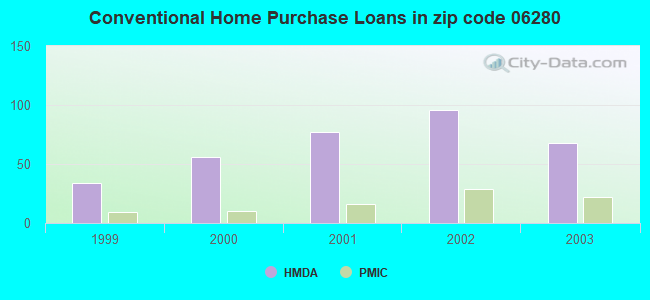
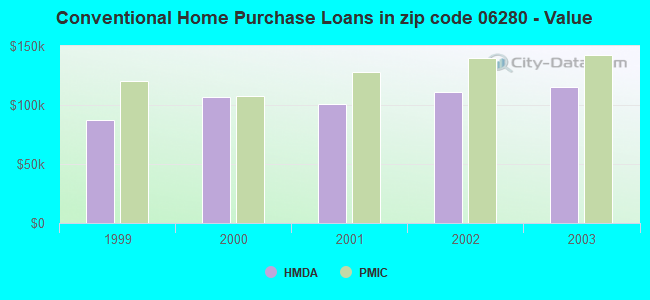
Home Mortgage Disclosure Act Aggregated Statistics For Year 2003 (Based on 2 partial tracts)
A) FHA, FSA/RHS & VA Home Purchase Loans
B) Conventional Home Purchase Loans
C) Refinancings
D) Home Improvement Loans
E) Loans on Dwellings For 5+ Families
F) Non-occupant Loans on < 5 Family Dwellings (A B C & D)
Number
Average Value
Number
Average Value
Number
Average Value
Number
Average Value
Number
Average Value
Number
Average Value
LOANS ORIGINATED
17
$145,169
68
$115,260
330
$112,878
34
$29,957
1
$377,760
10
$99,689
APPLICATIONS APPROVED, NOT ACCEPTED
1
$99,580
12
$84,337
42
$107,106
2
$27,060
0
$0
1
$54,120
APPLICATIONS DENIED
3
$133,137
27
$111,167
101
$113,631
18
$44,859
1
$129,890
9
$86,592
APPLICATIONS WITHDRAWN
1
$154,780
11
$99,089
69
$111,095
2
$33,555
0
$0
4
$111,218
FILES CLOSED FOR INCOMPLETENESS
0
$0
0
$0
13
$136,882
0
$0
0
$0
0
$0
Aggregated Statistics For Year 2002 (Based on 2 partial tracts)
A) FHA, FSA/RHS & VA Home Purchase Loans
B) Conventional Home Purchase Loans
C) Refinancings
D) Home Improvement Loans
E) Loans on Dwellings For 5+ Families
F) Non-occupant Loans on < 5 Family Dwellings (A B C & D)
Number
Average Value
Number
Average Value
Number
Average Value
Number
Average Value
Number
Average Value
Number
Average Value
LOANS ORIGINATED
26
$124,434
96
$111,228
157
$101,153
28
$24,315
1
$168,850
9
$97,416
APPLICATIONS APPROVED, NOT ACCEPTED
1
$96,330
11
$74,883
29
$117,272
4
$19,482
0
$0
0
$0
APPLICATIONS DENIED
2
$143,420
44
$77,072
74
$103,852
19
$16,635
0
$0
2
$92,545
APPLICATIONS WITHDRAWN
0
$0
12
$79,286
54
$108,521
6
$47,987
0
$0
3
$107,880
FILES CLOSED FOR INCOMPLETENESS
0
$0
2
$66,025
5
$142,010
0
$0
0
$0
1
$1,080
Aggregated Statistics For Year 2001 (Based on 2 partial tracts)
A) FHA, FSA/RHS & VA Home Purchase Loans
B) Conventional Home Purchase Loans
C) Refinancings
D) Home Improvement Loans
F) Non-occupant Loans on < 5 Family Dwellings (A B C & D)
Number
Average Value
Number
Average Value
Number
Average Value
Number
Average Value
Number
Average Value
LOANS ORIGINATED
35
$122,651
77
$100,523
123
$95,744
31
$32,228
12
$115,817
APPLICATIONS APPROVED, NOT ACCEPTED
0
$0
14
$58,759
15
$99,364
3
$25,257
0
$0
APPLICATIONS DENIED
2
$121,230
28
$46,002
66
$79,048
18
$23,452
0
$0
APPLICATIONS WITHDRAWN
0
$0
6
$60,795
40
$94,466
4
$7,305
0
$0
FILES CLOSED FOR INCOMPLETENESS
0
$0
0
$0
6
$116,900
1
$32,470
0
$0
Aggregated Statistics For Year 2000 (Based on 2 partial tracts)
A) FHA, FSA/RHS & VA Home Purchase Loans
B) Conventional Home Purchase Loans
C) Refinancings
D) Home Improvement Loans
F) Non-occupant Loans on < 5 Family Dwellings (A B C & D)
Number
Average Value
Number
Average Value
Number
Average Value
Number
Average Value
Number
Average Value
LOANS ORIGINATED
32
$101,881
56
$106,597
47
$60,522
29
$28,590
1
$62,780
APPLICATIONS APPROVED, NOT ACCEPTED
0
$0
10
$67,975
14
$75,923
12
$15,875
0
$0
APPLICATIONS DENIED
2
$104,450
40
$48,870
32
$78,880
16
$25,572
1
$25,980
APPLICATIONS WITHDRAWN
1
$138,550
4
$142,335
31
$83,205
3
$82,263
0
$0
FILES CLOSED FOR INCOMPLETENESS
0
$0
0
$0
9
$98,258
0
$0
1
$297,660
Aggregated Statistics For Year 1999 (Based on 1 partial tract)
A) FHA, FSA/RHS & VA Home Purchase Loans
B) Conventional Home Purchase Loans
C) Refinancings
D) Home Improvement Loans
F) Non-occupant Loans on < 5 Family Dwellings (A B C & D)
Detailed PMIC statistics for the following Tracts:8005.00
2002 - 2018 National Fire Incident Reporting System (NFIRS) incidents
According to the data from the years 2002 - 2018 the average number of fire incidents per year is 23. The highest number of reported fires - 55 took place in 2007, and the least - 5 in 2014. The data has a constant trend.
When looking into fire subcategories, the most incidents belonged to: Structure Fires (46.0%), and Other (27.1%).
Fire incident types reported to NFIRS in Zip Code 06280


 Nearest zip codes: 06264, 06266, 06256, 06254, 06350, 06330.


 According to the data from the years 2002 - 2018 the average number of fire incidents per year is 23. The highest number of reported fires - 55 took place in 2007, and the least - 5 in 2014. The data has a constant trend.
 When looking into fire subcategories, the most incidents belonged to: Structure Fires (46.0%), and Other (27.1%).