Estimated zip code population in 2022: 5,255 Zip code population in 2010: 5,438 Zip code population in 2000: 4,745
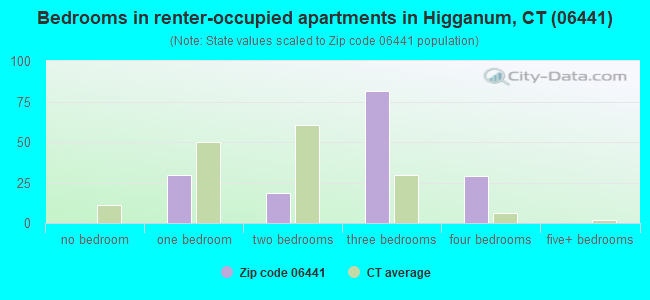
Houses and condos: 2,168 Renter-occupied apartments: 164
% of renters here:
8%
State:
34%
March 2022 cost of living index in zip code 06441: 115.8 (more than average, U.S. average is 100)
Land area: 25.9 sq. mi. Water area: 0.4 sq. mi.
Population density: 203 people per square mile
(very low).
OSM Map
Google Map
MSN Map
OSM Map
General Map
Google Map
MSN Map
OSM Map
Google Map
MSN Map
OSM Map
Google Map
MSN Map
Please wait while loading the map...
Real estate property taxes paid for housing units in 2022:
This zip code:
1.7% ($6,741)
Connecticut:
1.8% ($6,189)
Median real estate property taxes paid for housing units with mortgages in 2022: $6,494 (1.8%) Median real estate property taxes paid for housing units with no mortgage in 2022: $7,790 (1.7%)
Business Search- 14 Million verified businesses
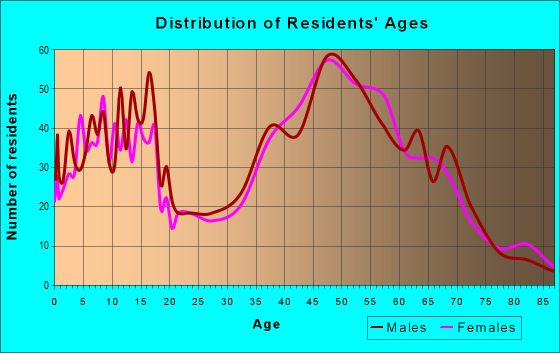
Males: 2,741
(52.2%)
Females: 2,514
(47.8%)
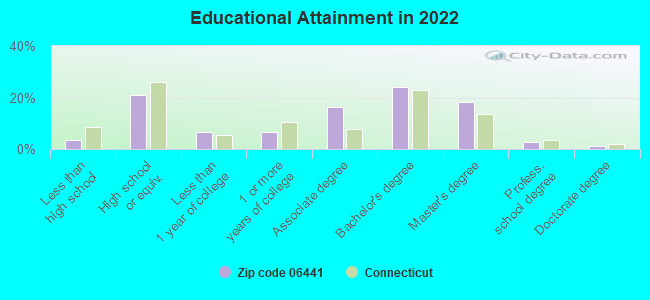
For population 25 years and over in 06441:
High school or higher: 96.2%
Bachelor's degree or higher: 45.7%
Graduate or professional degree: 21.8%
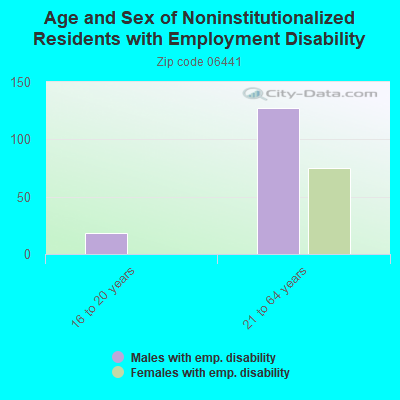
Unemployed: 8.0%
Mean travel time to work (commute): 32.0 minutes
For population 15 years and over in 06441:
Never married: 21.0%
Now married: 57.7%
Separated: 1.7%
Widowed: 3.2%
Divorced: 16.4%
Zip code 06441 compared to state average:
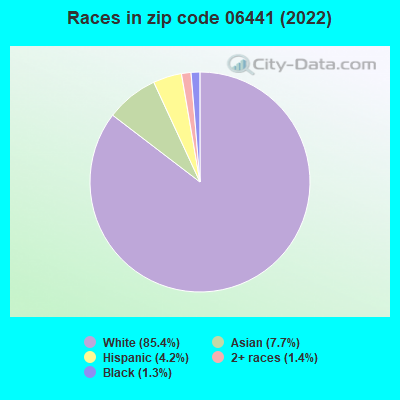
Black race population percentage significantly below state average.
Hispanic race population percentage significantly below state average.
Median age above state average.
Foreign-born population percentage below state average.
Renting percentage significantly below state average.
Length of stay since moving in above state average.
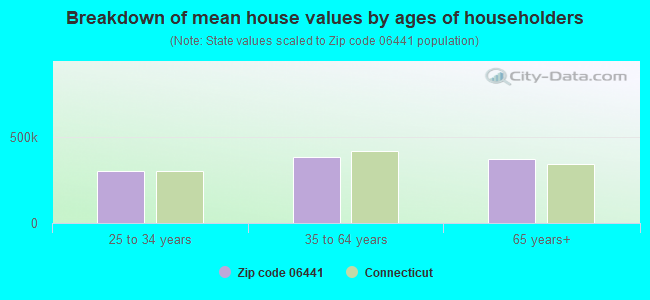
Estimated median house/condo value in 2022: $392,249
06441:
$392,249
Connecticut:
$347,200
According to our research of Connecticut and other state lists, there was 1 registered sex offender living in 06441 zip code as of May 28, 2024. The ratio of all residents to sex offenders in zip code 06441 is 5,404 to 1. The ratio of registered sex offenders to all residents in this zip code is much lower than the state average.
Median resident age:
This zip code:
46.1 years
Connecticut median age:
40.9 years
Average household size:
This zip code:
2.5 people
Connecticut:
2.5 people
Averages for the 2020 tax year for zip code 06441, filed in 2021:
Average Adjusted Gross Income (AGI) in 2020: $100,492 (Individual Income Tax Returns)
Here:
$100,492
State:
$105,931
Salary/wage: $86,888 (reported on 80.3% of returns)
Here:
$86,888
State:
$83,540
(% of AGI for various income ranges: 1121.1% for AGIs below $25k, 3339.5% for AGIs $25k-50k, 5923.9% for AGIs $50k-75k, 8624.2% for AGIs $75k-100k, 17826.6% for AGIs $100k-200k, 65991.0% for AGIs over 200k)
Taxable interest for individuals: $1,286 (reported on 44.0% of returns)
This zip code:
$1,286
Connecticut:
$3,402
(% of AGI for various income ranges: 28.3% for AGIs below $25k, 48.1% for AGIs $25k-50k, 64.6% for AGIs $50k-75k, 60.4% for AGIs $75k-100k, 113.4% for AGIs $100k-200k, 503.0% for AGIs over 200k)
Ordinary dividends: $4,540 (reported on 29.9% of returns)
Here:
$4,540
State:
$12,683
(% of AGI for various income ranges: 53.1% for AGIs below $25k, 53.2% for AGIs $25k-50k, 100.7% for AGIs $50k-75k, 182.9% for AGIs $75k-100k, 230.0% for AGIs $100k-200k, 1738.0% for AGIs over 200k)
Net capital gain/loss in AGI: +$16,017 (reported on 27.1% of returns)
Here:
+$16,017
State:
+$44,158
(% of AGI for various income ranges: 21.9% for AGIs below $25k, 38.9% for AGIs $25k-50k, 113.6% for AGIs $50k-75k, 143.8% for AGIs $75k-100k, 522.0% for AGIs $100k-200k, 9150.0% for AGIs over 200k)
Profit/loss from business: +$31,262 (reported on 15.8% of returns)
Here:
+$31,262
State:
+$22,988
(% of AGI for various income ranges: 171.4% for AGIs below $25k, 197.0% for AGIs $25k-50k, 314.6% for AGIs $50k-75k, 312.5% for AGIs $75k-100k, 556.6% for AGIs $100k-200k, 8642.0% for AGIs over 200k)
Taxable individual retirement arrangement distribution: $18,192 (reported on 12.7% of returns)
06441:
$18,192
Connecticut:
$22,031
(% of AGI for various income ranges: 108.6% for AGIs below $25k, 155.1% for AGIs $25k-50k, 312.1% for AGIs $50k-75k, 343.3% for AGIs $75k-100k, 550.7% for AGIs $100k-200k, 1463.0% for AGIs over 200k)
Self-employed (Keogh) retirement plans: $21,450 (reported on 1.4% of returns)
06441:
$21,450
Connecticut:
$29,016
(% of AGI for various income ranges: 858.0% for AGIs over 200k)
Total itemized deductions: $26,618 (reported on 13.4% of returns)
Here:
$26,618
State:
$37,613
(% of AGI for various income ranges: 238.6% for AGIs $25k-50k, 306.8% for AGIs $50k-75k, 683.3% for AGIs $75k-100k, 718.0% for AGIs $100k-200k, 3574.0% for AGIs over 200k)
Charity contributions: $5,567 (reported on 10.6% of returns)
Here:
$5,567
State:
$13,557
(% of AGI for various income ranges: 8.9% for AGIs below $25k, 12.5% for AGIs $50k-75k, 99.6% for AGIs $75k-100k, 93.9% for AGIs $100k-200k, 951.0% for AGIs over 200k)
Taxes paid: $9,476 (reported on 13.0% of returns)
06441:
$9,476
State:
$9,096
(% of AGI for various income ranges: 77.6% for AGIs $25k-50k, 119.6% for AGIs $50k-75k, 273.3% for AGIs $75k-100k, 278.4% for AGIs $100k-200k, 1003.0% for AGIs over 200k)
Earned income credit: $1,429 (reported on 6.0% of returns)
Here:
$1,429
State:
$2,059
(% of AGI for various income ranges: 36.1% for AGIs below $25k, 30.5% for AGIs $25k-50k)
Percentage of individuals using paid preparers for their 2020 taxes: 92.6%
Here:
93%
State:
93%
(% for various income ranges: 89.8% for AGIs below $25k, 93.8% for AGIs $25k-50k, 92.3% for AGIs $50k-75k, 91.4% for AGIs $75k-100k, 93.2% for AGIs $100k-200k, 96.6% for AGIs over 200k)
Averages for the 2012 tax year for zip code 06441, filed in 2013:
Average Adjusted Gross Income (AGI) in 2012: $82,591 (Individual Income Tax Returns)
Here:
$82,591
State:
$93,290
Salary/wage: $72,021 (reported on 84.5% of returns)
Here:
$72,021
State:
$73,117
(% of AGI for various income ranges: 71.2% for AGIs below $25k, 70.8% for AGIs $25k-50k, 75.0% for AGIs $50k-75k, 74.3% for AGIs $75k-100k, 78.2% for AGIs $100k-200k, 67.5% for AGIs over 200k)
Taxable interest for individuals: $848 (reported on 59.4% of returns)
This zip code:
$848
Connecticut:
$2,530
(% of AGI for various income ranges: 1.0% for AGIs below $25k, 0.7% for AGIs $25k-50k, 0.6% for AGIs $50k-75k, 0.4% for AGIs $75k-100k, 0.6% for AGIs $100k-200k, 0.7% for AGIs over 200k)
Ordinary dividends: $3,548 (reported on 32.5% of returns)
Here:
$3,548
State:
$10,909
(% of AGI for various income ranges: 3.0% for AGIs below $25k, 1.3% for AGIs $25k-50k, 1.1% for AGIs $50k-75k, 1.4% for AGIs $75k-100k, 1.1% for AGIs $100k-200k, 1.8% for AGIs over 200k)
Net capital gain/loss in AGI: +$4,694 (reported on 22.3% of returns)
Here:
+$4,694
State:
+$34,090
(% of AGI for various income ranges: 0.4% for AGIs $25k-50k, 0.5% for AGIs $50k-75k, 0.7% for AGIs $75k-100k, 1.3% for AGIs $100k-200k, 2.2% for AGIs over 200k)
Profit/loss from business: +$19,313 (reported on 16.6% of returns)
Here:
+$19,313
State:
+$22,741
(% of AGI for various income ranges: 6.8% for AGIs below $25k, 4.5% for AGIs $25k-50k, 2.1% for AGIs $50k-75k, 3.6% for AGIs $75k-100k, 2.9% for AGIs $100k-200k, 5.5% for AGIs over 200k)
Taxable individual retirement arrangement distribution: $15,091 (reported on 12.4% of returns)
06441:
$15,091
Connecticut:
$19,976
(% of AGI for various income ranges: 3.6% for AGIs below $25k, 3.1% for AGIs $25k-50k, 2.4% for AGIs $50k-75k, 2.6% for AGIs $75k-100k, 2.2% for AGIs $100k-200k, 1.7% for AGIs over 200k)
Self-employment retirement plans: $18,900 (reported on 1.4% of returns)
06441:
$18,900
Connecticut:
$24,004
(% of AGI for various income ranges: 0.8% for AGIs $100k-200k)
Total itemized deductions: $25,003 (20% of AGI, reported on 55.1% of returns)
Here:
$25,003
State:
$33,239
Here:
20.1% of AGI
State:
18.9% of AGI
(% of AGI for various income ranges: 13.5% for AGIs below $25k, 14.6% for AGIs $25k-50k, 18.2% for AGIs $50k-75k, 19.6% for AGIs $75k-100k, 18.5% for AGIs $100k-200k, 13.2% for AGIs over 200k)
Charity contributions: $2,172 (reported on 45.6% of returns)
Here:
$2,172
State:
$4,947
(% of AGI for various income ranges: 0.6% for AGIs below $25k, 1.1% for AGIs $25k-50k, 0.8% for AGIs $50k-75k, 1.3% for AGIs $75k-100k, 1.3% for AGIs $100k-200k, 1.2% for AGIs over 200k)
Taxes paid: $13,489 (reported on 55.1% of returns)
06441:
$13,489
State:
$17,397
(% of AGI for various income ranges: 5.0% for AGIs below $25k, 6.2% for AGIs $25k-50k, 8.6% for AGIs $50k-75k, 9.8% for AGIs $75k-100k, 10.2% for AGIs $100k-200k, 8.4% for AGIs over 200k)
Earned income credit: $1,794 (reported on 5.7% of returns)
Here:
$1,794
State:
$2,053
(% of AGI for various income ranges: 2.6% for AGIs below $25k, 0.5% for AGIs $25k-50k)
Percentage of individuals using paid preparers for their 2012 taxes: 56.5%
Here:
57%
State:
55%
(% for various income ranges: 46.7% for AGIs below $25k, 57.4% for AGIs $25k-50k, 64.3% for AGIs $50k-75k, 64.7% for AGIs $75k-100k, 59.1% for AGIs $100k-200k, 52.6% for AGIs over 200k)
Averages for the 2004 tax year for zip code 06441, filed in 2005:
Average Adjusted Gross Income (AGI) in 2004: $64,203 (Individual Income Tax Returns)
Here:
$64,203
State:
$73,265
Salary/wage: $59,413 (reported on 84.6% of returns)
Here:
$59,413
State:
$62,030
(% of AGI for various income ranges: 87.9% for AGIs below $10k, 65.1% for AGIs $10k-25k, 72.7% for AGIs $25k-50k, 79.9% for AGIs $50k-75k, 82.9% for AGIs $75k-100k, 78.1% for AGIs over 100k)
Taxable interest for individuals: $1,035 (reported on 70.3% of returns)
This zip code:
$1,035
Connecticut:
$2,287
(% of AGI for various income ranges: 5.1% for AGIs below $10k, 3.1% for AGIs $10k-25k, 1.7% for AGIs $25k-50k, 1.2% for AGIs $50k-75k, 0.8% for AGIs $75k-100k, 0.9% for AGIs over 100k)
Taxable dividends: $2,151 (reported on 37.9% of returns)
Here:
$2,151
State:
$5,735
(% of AGI for various income ranges: 3.1% for AGIs below $10k, 2.6% for AGIs $10k-25k, 1.4% for AGIs $25k-50k, 0.8% for AGIs $50k-75k, 0.7% for AGIs $75k-100k, 1.5% for AGIs over 100k)
Net capital gain/loss: +$6,631 (reported on 29.4% of returns)
Here:
+$6,631
State:
+$23,694
(% of AGI for various income ranges: -3.5% for AGIs below $10k, 1.2% for AGIs $10k-25k, 0.9% for AGIs $25k-50k, 0.6% for AGIs $50k-75k, 0.1% for AGIs $75k-100k, 5.8% for AGIs over 100k)
Profit/loss from business: +$19,476 (reported on 16.1% of returns)
Here:
+$19,476
State:
+$20,783
(% of AGI for various income ranges: 8.1% for AGIs below $10k, 5.3% for AGIs $10k-25k, 6.2% for AGIs $25k-50k, 3.0% for AGIs $50k-75k, 3.9% for AGIs $75k-100k, 5.5% for AGIs over 100k)
IRA payment deduction: $3,032 (reported on 3.8% of returns)
06441:
$3,032
Connecticut:
$3,216
(% of AGI for various income ranges: 0.4% for AGIs $10k-25k, 0.4% for AGIs $25k-50k, 0.2% for AGIs $50k-75k, 0.2% for AGIs $75k-100k, 0.1% for AGIs over 100k)
Self-employed pension: $13,655 (reported on 2.2% of returns)
Here:
$13,655
Connecticut:
$17,335
Total itemized deductions: $19,481 (21% of AGI, reported on 55.1% of returns)
Here:
$19,481
State:
$24,919
Here:
20.6% of AGI
State:
18.6% of AGI
(% of AGI for various income ranges: 18.7% for AGIs below $10k, 13.8% for AGIs $10k-25k, 16.2% for AGIs $25k-50k, 17.6% for AGIs $50k-75k, 18.5% for AGIs $75k-100k, 16.0% for AGIs over 100k)
Charity contributions deductions: $1,994 (2% of AGI, reported on 50.8% of returns)
Here:
$1,994
State:
$3,762
Here:
2.1% of AGI
State:
2.7% of AGI
(% of AGI for various income ranges: 0.6% for AGIs below $10k, 0.9% for AGIs $10k-25k, 1.3% for AGIs $25k-50k, 1.5% for AGIs $50k-75k, 1.4% for AGIs $75k-100k, 1.8% for AGIs over 100k)
Total tax: $9,346 (reported on 85.9% of returns)
06441:
$9,346
State:
$15,148
(% of AGI for various income ranges: 3.6% for AGIs below $10k, 4.7% for AGIs $10k-25k, 8.6% for AGIs $25k-50k, 9.4% for AGIs $50k-75k, 10.2% for AGIs $75k-100k, 16.2% for AGIs over 100k)
Earned income credit: $1,271 (reported on 4.8% of returns)
Here:
$1,271
State:
$1,570
Percentage of individuals using paid preparers for their 2004 taxes: 59.2%
Here:
59%
State:
59%
(% for various income ranges: 47.4% for AGIs below $10k, 58.7% for AGIs $10k-25k, 61.6% for AGIs $25k-50k, 64.9% for AGIs $50k-75k, 62.7% for AGIs $75k-100k, 58.5% for AGIs over 100k)
Household received Food Stamps/SNAP in the past 12 months: 94 Household did not receive Food Stamps/SNAP in the past 12 months: 2,008
Women who had a birth in the past 12 months: 39 (38 now married, 0 unmarried) Women who did not have a birth in the past 12 months: 1,032 (501 now married, 520 unmarried)
Housing units in zip code 06441 with a mortgage: 1,501 (69 second mortgage, 71 both second mortgage and home equity loan) Houses without a mortgage: 48
Median monthly owner costs for units with a mortgage: $2,229 Median monthly owner costs for units without a mortgage: $1,046
Residents with income below the poverty level in 2022:
This zip code:
3.5%
Whole state:
9.8%
Residents with income below 50% of the poverty level in 2022:
This zip code:
0.3%
Whole state:
4.8%
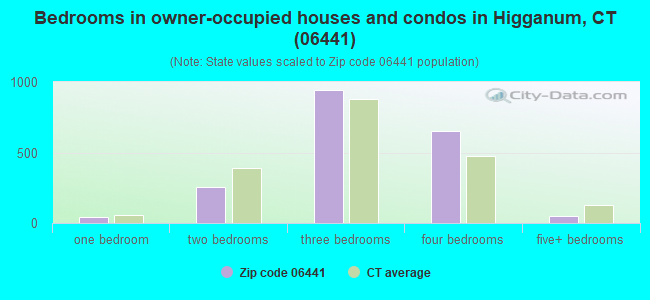
Median number of rooms in houses and condos:
Here:
6.6
State:
6.5
Median number of rooms in apartments:
Here:
5.0
State:
4.0
Notable locations in this zip code not listed on our city pages
Notable locations in zip code 06441: Haddam Volunteer Ambulance Service (A), Haddam Volunteer Fire Department Station 3 (B), Haddam Volunteer Fire Department Station 1 Headquarters (C). Display/hide their locations on the map
Churches in zip code 06441 include: Higganum Congregational Church (A), Higganum United Methodist Church (B), Ponset Episcopal Church (C), Saint Peters Church (D). Display/hide their locations on the map
Lakes and reservoirs: Upper Pond (A), Hidden Lake (B), Horseshoe Pond (C), Sawmill Pond (D), Priess Pond (E), Palmers Pond (F), Higganum Reservoir (G), Bell Shop Pond (H). Display/hide their locations on the map
Streams, rivers, and creeks: Ponset Brook (A), Saltpeter Brook (B), Bible Rock Brook (C), Candlewood Hill Brook (D), Higganum Creek (E). Display/hide their locations on the map
In group quarters: 11 (-1 institutionalized population)
Size of family households: 795 2-persons, 408 3-persons, 204 4-persons, 68 5-persons, 70 6-persons, 27 7-or-more-persons
Size of nonfamily households: 456 1-person, 67 2-persons
757 married couples with children.
419 single-parent households (222 men, 197 women).
91.2% of residents of 06441 zip code speak English at home.
0.5% of residents speak Spanish at home (100% not well).
2.0% of residents speak other Indo-European language at home (85% very well, 15% not well).
5.6% of residents speak Asian or Pacific Island language at home (64% very well, 27% well, 9% not well).
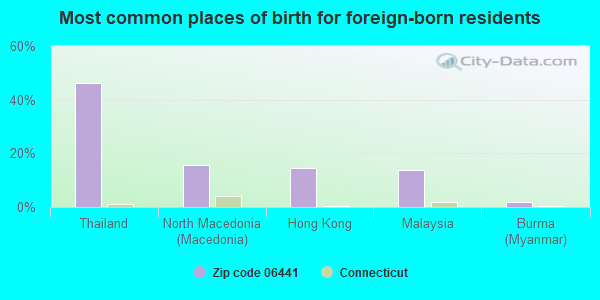
Foreign born population: 361 (6.9%) (79.0% of them are naturalized citizens)
This zip code:
6.9%
Whole state:
15.7%
46%Thailand
16%North Macedonia (Macedonia)
15%Hong Kong
14%Malaysia
2%Burma (Myanmar)
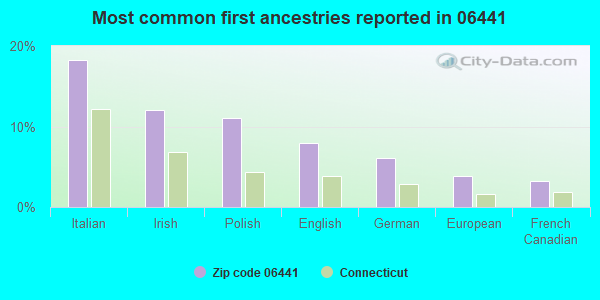
18%Italian
12%Irish
11%Polish
8%English
6%German
4%European
3%French Canadian
Year of entry for the foreign-born population
02010 or later
1192000 to 2009
1611990 to 1999
73Before 1990
Facilities with environmental interests located in this zip code:
BURR DISTRICT ELEMENTARY (792 KILLINGWORTH ROAD in HADDAM, CT)
AIR MINOR (AIRS/AFS) COMPLIANCE ACTIVITY (Tracking inspections of insecticide, fungicide, and rodenticide, and toxic substances) (National Center for Education Statistics) - STATE ID-2 Business SIC classification: ELEMENTARY AND SECONDARY SCHOOLS Organizations: REGIONAL SCHOOL DISTRICT 17 (SCHOOL DISTRICT)
Alternative names: BURR DIST ELEMENTARY SCHOOL, BURR ELEMENTARY, BURR ELEMENTARY SCHOOL
HADDAM ELEMENTARY SCHOOL (ROUTE 9A in HIGGANUM, CT)
(Geographic Names Information System) (National Center for Education Statistics) - STATE ID-1 Organizations: REGIONAL SCHOOL DISTRICT 17 (SCHOOL DISTRICT)
HADDAM-KILLINGWORTH HIGH SCHOOL (95 LITTLE CITY ROAD in HIGGANUM, CT)
COMPLIANCE ACTIVITY (Tracking inspections of insecticide, fungicide, and rodenticide, and toxic substances) (National Center for Education Statistics) - STATE ID-61 Organizations: REGIONAL SCHOOL DISTRICT 17 (SCHOOL DISTRICT)
HADDAM-KILLINGWORTH MIDDLE (57 LITTLE CITY ROAD in HIGGANUM, CT)
(National Center for Education Statistics) - STATE ID-51 Organizations: REGIONAL SCHOOL DISTRICT 17 (SCHOOL DISTRICT)
HOMEBOUND (91 LITTLE CITY ROAD in HIGGANUM, CT)
(National Center for Education Statistics) - STATE ID-88 Organizations: REGIONAL SCHOOL DISTRICT 17 (SCHOOL DISTRICT)
A T & T DURHAM RADIO STATION (CHAMBERLAIN HILL ROAD in HIGGANUM, CT)
HADDAM KILLINGWORTH HIGH SCHOOL (91 LITTLE CITY ROAD in HIGGANUM, CT)
AIR SYNTHETIC MINOR (AIRS/AFS) COMPLIANCE ACTIVITY (Tracking inspections of insecticide, fungicide, and rodenticide, and toxic substances) Business SIC classification: ELEMENTARY AND SECONDARY SCHOOLS Alternative names: REGIONAL SCHOOL DIST #17, REGIONAL SCHOOL DISTRICT #17
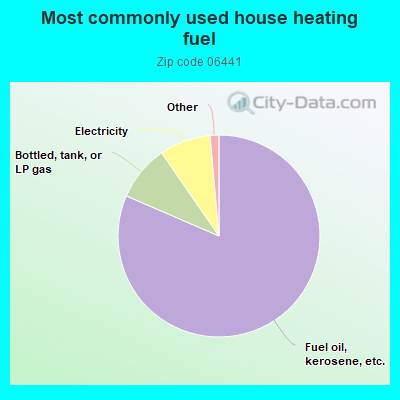
81.5%Fuel oil, kerosene, etc.
8.9%Bottled, tank, or LP gas
8.2%Electricity
0.9%Utility gas
0.5%Wood
Population in 1990: 4,248. Population change in the 1990s: +497 (+11.7%).
Place of birth for U.S.-born residents:
This state: 3,701
Northeast: 756
Midwest: 216
South: 133
West: 17
72% of the 06441 zip code residents lived in the same house 5 years ago. Out of people who lived in different houses, 63% lived in this county. Out of people who lived in different counties, 50% lived in Connecticut.
95% of the 06441 zip code residents lived in the same house 1 year ago. Out of people who lived in different houses, 35% moved from this county. Out of people who lived in different houses, 33% moved from different county within same state. Out of people who lived in different houses, 35% moved from different state.
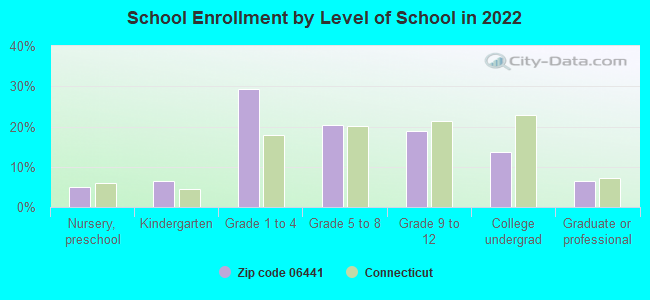
Private vs. public school enrollment:
Students in private schools in grades 1 to 8 (elementary and middle school):
Here:
0.0%
Connecticut:
9.5%
Students in private schools in grades 9 to 12 (high school): 113
Here:
36.9%
Connecticut:
12.9%
Students in private undergraduate colleges: 159
Here:
74.4%
Connecticut:
35.5%
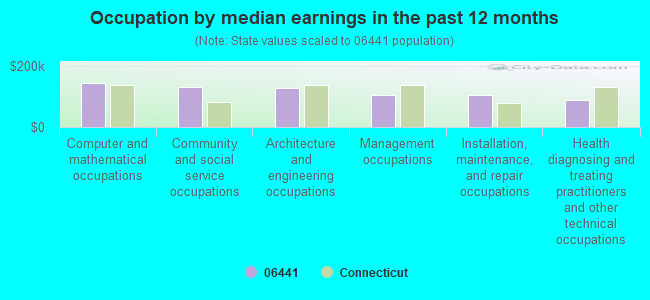
Occupation by median earnings in the past 12 months ($)
143,749Computer and mathematical occupations
130,065Community and social service occupations
126,966Architecture and engineering occupations
105,628Management occupations
103,867Installation, maintenance, and repair occupations
89,519Health diagnosing and treating practitioners and other technical occupations
Top industries in this zip code by the number of employees in 2005:
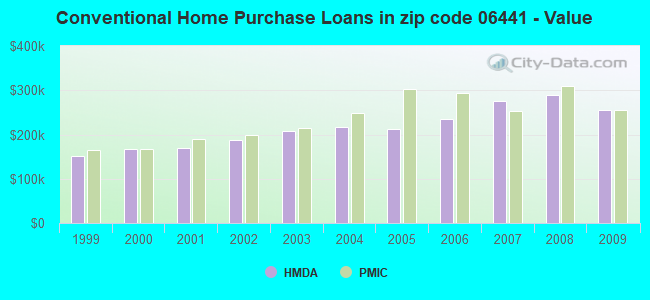
Detailed PMIC statistics for the following Tracts:5901.00
2002 - 2018 National Fire Incident Reporting System (NFIRS) incidents
According to the data from the years 2002 - 2018 the average number of fires per year is 19. The highest number of reported fires - 39 took place in 2003, and the least - 4 in 2012. The data has a decreasing trend.
When looking into fire subcategories, the most incidents belonged to: Structure Fires (45.9%), and Outside Fires (30.5%).
Fire incident types reported to NFIRS in Zip Code 06441


 Nearest zip codes: 06456, 06438, 06419, 06422, 06414, 06457.


 According to the data from the years 2002 - 2018 the average number of fires per year is 19. The highest number of reported fires - 39 took place in 2003, and the least - 4 in 2012. The data has a decreasing trend.
 When looking into fire subcategories, the most incidents belonged to: Structure Fires (45.9%), and Outside Fires (30.5%).