Estimated zip code population in 2022: 7,661 Zip code population in 2010: 7,453 Zip code population in 2000: 7,272
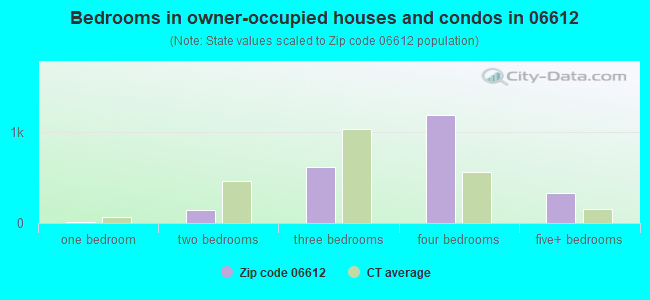
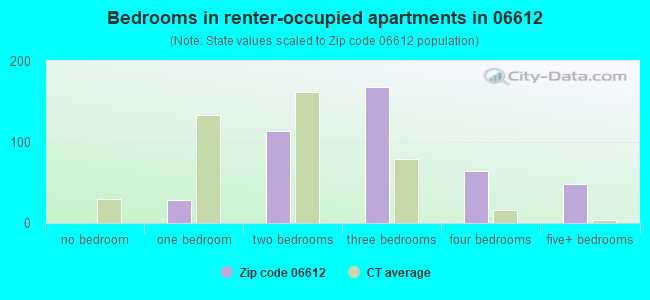
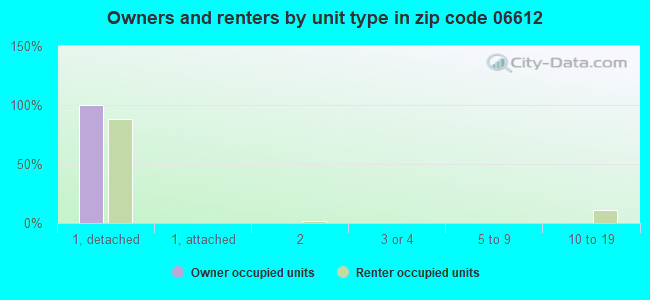
Houses and condos: 2,708 Renter-occupied apartments: 447
% of renters here:
16%
State:
34%
March 2022 cost of living index in zip code 06612: 122.2 (high, U.S. average is 100)
Land area: 26.8 sq. mi. Water area: 1.2 sq. mi.
Population density: 286 people per square mile
(very low).
OSM Map
Google Map
MSN Map
OSM Map
General Map
Google Map
MSN Map
OSM Map
Google Map
MSN Map
OSM Map
Google Map
MSN Map
Please wait while loading the map...
Real estate property taxes paid for housing units in 2022:
This zip code:
1.3% ($9,545)
Connecticut:
1.8% ($6,189)
Median real estate property taxes paid for housing units with mortgages in 2022: $9,526 (1.3%) Median real estate property taxes paid for housing units with no mortgage in 2022: $9,598 (1.3%)
Business Search- 14 Million verified businesses
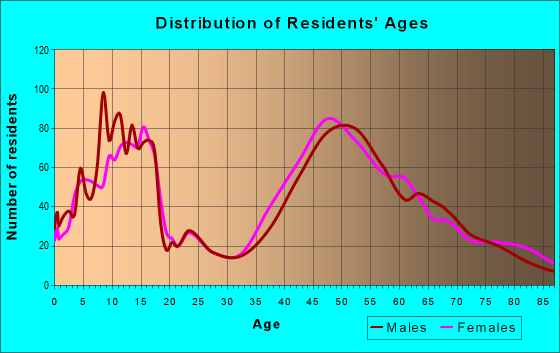
Males: 4,022
(52.5%)
Females: 3,638
(47.5%)
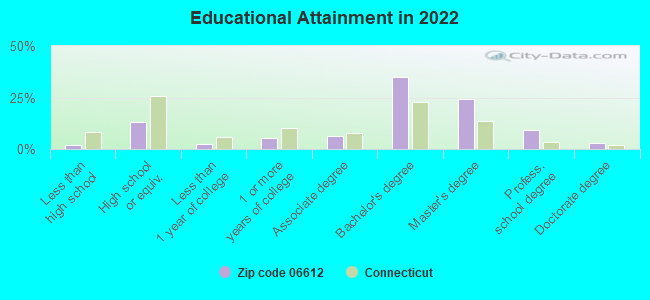
For population 25 years and over in 06612:
High school or higher: 98.9%
Bachelor's degree or higher: 71.6%
Graduate or professional degree: 36.6%
Unemployed: 3.6%
Mean travel time to work (commute): 29.4 minutes
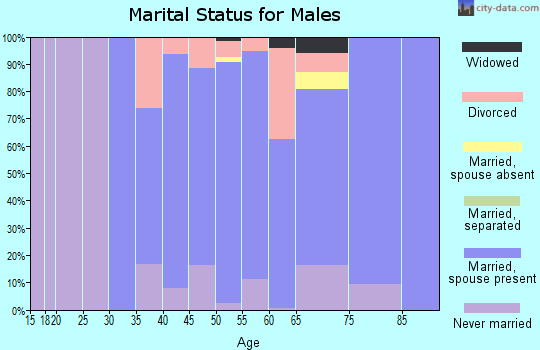
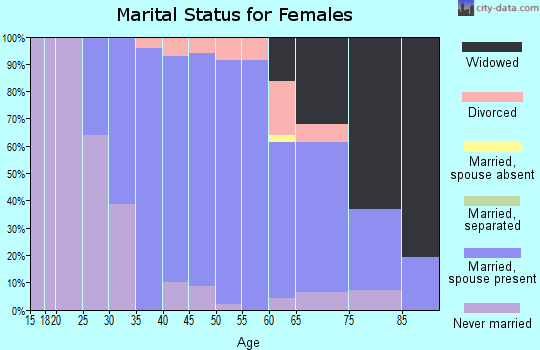
For population 15 years and over in 06612:
Never married: 24.6%
Now married: 62.0%
Separated: 0.0%
Widowed: 3.0%
Divorced: 10.4%
Zip code 06612 compared to state average:
Median household income above state average.
Median house value above state average.
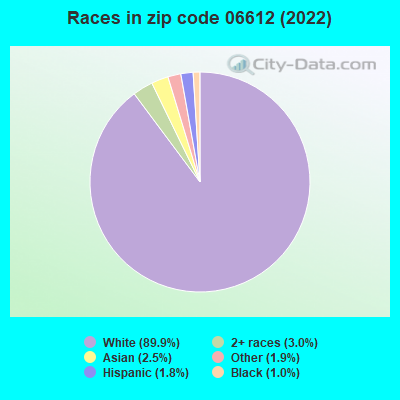
Black race population percentage significantly below state average.
Hispanic race population percentage significantly below state average.
Median age above state average.
Foreign-born population percentage below state average.
Renting percentage below state average.
Length of stay since moving in significantly above state average.
Number of rooms per house significantly above state average.
Percentage of population with a bachelor's degree or higher above state average.
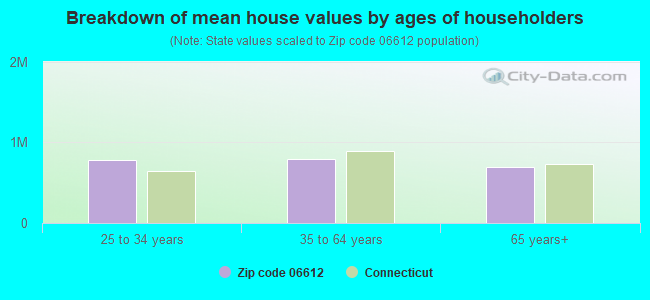
Estimated median house/condo value in 2022: $753,178
06612:
$753,178
Connecticut:
$347,200
According to our research of Connecticut and other state lists, there were 4 registered sex offenders living in 06612 zip code as of May 16, 2024. The ratio of all residents to sex offenders in zip code 06612 is 1,925 to 1. The ratio of registered sex offenders to all residents in this zip code is much lower than the state average.
Median resident age:
This zip code:
47.1 years
Connecticut median age:
40.9 years
Average household size:
This zip code:
2.8 people
Connecticut:
2.5 people
Averages for the 2020 tax year for zip code 06612, filed in 2021:
Average Adjusted Gross Income (AGI) in 2020: $201,753 (Individual Income Tax Returns)
Here:
$201,753
State:
$105,931
Salary/wage: $168,803 (reported on 74.4% of returns)
Here:
$168,803
State:
$83,540
(% of AGI for various income ranges: 1342.4% for AGIs below $25k, 3522.1% for AGIs $25k-50k, 6978.8% for AGIs $50k-75k, 10655.0% for AGIs $75k-100k, 20674.1% for AGIs $100k-200k, 115896.9% for AGIs over 200k)
Taxable interest for individuals: $3,003 (reported on 57.2% of returns)
This zip code:
$3,003
Connecticut:
$3,402
(% of AGI for various income ranges: 55.9% for AGIs below $25k, 100.0% for AGIs $25k-50k, 166.5% for AGIs $50k-75k, 187.1% for AGIs $75k-100k, 306.5% for AGIs $100k-200k, 1405.9% for AGIs over 200k)
Ordinary dividends: $13,361 (reported on 51.7% of returns)
Here:
$13,361
State:
$12,683
(% of AGI for various income ranges: 215.0% for AGIs below $25k, 285.4% for AGIs $25k-50k, 424.1% for AGIs $50k-75k, 642.9% for AGIs $75k-100k, 1088.9% for AGIs $100k-200k, 6132.8% for AGIs over 200k)
Net capital gain/loss in AGI: +$36,483 (reported on 48.6% of returns)
Here:
+$36,483
State:
+$44,158
(% of AGI for various income ranges: 90.3% for AGIs below $25k, 231.7% for AGIs $25k-50k, 467.6% for AGIs $50k-75k, 618.6% for AGIs $75k-100k, 1675.9% for AGIs $100k-200k, 19006.9% for AGIs over 200k)
Profit/loss from business: +$56,092 (reported on 26.4% of returns)
Here:
+$56,092
State:
+$22,988
(% of AGI for various income ranges: 256.8% for AGIs below $25k, 651.7% for AGIs $25k-50k, 1052.9% for AGIs $50k-75k, 1610.0% for AGIs $75k-100k, 2458.9% for AGIs $100k-200k, 13002.8% for AGIs over 200k)
Taxable individual retirement arrangement distribution: $33,080 (reported on 13.6% of returns)
06612:
$33,080
Connecticut:
$22,031
(% of AGI for various income ranges: 70.6% for AGIs below $25k, 272.9% for AGIs $25k-50k, 529.4% for AGIs $50k-75k, 799.3% for AGIs $75k-100k, 1339.2% for AGIs $100k-200k, 2875.9% for AGIs over 200k)
Self-employed (Keogh) retirement plans: $30,365 (reported on 4.7% of returns)
06612:
$30,365
Connecticut:
$29,016
(% of AGI for various income ranges: 258.6% for AGIs $100k-200k, 1450.0% for AGIs over 200k)
Total itemized deductions: $36,088 (reported on 30.0% of returns)
Here:
$36,088
State:
$37,613
(% of AGI for various income ranges: 277.4% for AGIs below $25k, 665.4% for AGIs $25k-50k, 1081.2% for AGIs $50k-75k, 1299.3% for AGIs $75k-100k, 2797.8% for AGIs $100k-200k, 7733.1% for AGIs over 200k)
Charity contributions: $8,239 (reported on 26.1% of returns)
Here:
$8,239
State:
$13,557
(% of AGI for various income ranges: 9.1% for AGIs below $25k, 49.6% for AGIs $25k-50k, 52.4% for AGIs $50k-75k, 121.4% for AGIs $75k-100k, 397.6% for AGIs $100k-200k, 2022.4% for AGIs over 200k)
Taxes paid: $9,767 (reported on 30.0% of returns)
06612:
$9,767
State:
$9,096
(% of AGI for various income ranges: 78.2% for AGIs below $25k, 200.0% for AGIs $25k-50k, 320.6% for AGIs $50k-75k, 421.4% for AGIs $75k-100k, 849.2% for AGIs $100k-200k, 1905.2% for AGIs over 200k)
Earned income credit: $1,477 (reported on 3.6% of returns)
Here:
$1,477
State:
$2,059
(% of AGI for various income ranges: 31.2% for AGIs below $25k, 35.8% for AGIs $25k-50k)
Percentage of individuals using paid preparers for their 2020 taxes: 91.4%
Here:
91%
State:
93%
(% for various income ranges: 90.3% for AGIs below $25k, 90.2% for AGIs $25k-50k, 90.3% for AGIs $50k-75k, 86.2% for AGIs $75k-100k, 90.4% for AGIs $100k-200k, 95.2% for AGIs over 200k)
Averages for the 2012 tax year for zip code 06612, filed in 2013:
Average Adjusted Gross Income (AGI) in 2012: $197,743 (Individual Income Tax Returns)
Here:
$197,743
State:
$93,290
Salary/wage: $145,635 (reported on 76.3% of returns)
Here:
$145,635
State:
$73,117
(% of AGI for various income ranges: 63.7% for AGIs below $25k, 63.4% for AGIs $25k-50k, 57.5% for AGIs $50k-75k, 58.5% for AGIs $75k-100k, 64.3% for AGIs $100k-200k, 54.1% for AGIs over 200k)
Taxable interest for individuals: $5,018 (reported on 67.1% of returns)
This zip code:
$5,018
Connecticut:
$2,530
(% of AGI for various income ranges: 3.9% for AGIs below $25k, 2.0% for AGIs $25k-50k, 2.4% for AGIs $50k-75k, 1.8% for AGIs $75k-100k, 1.4% for AGIs $100k-200k, 1.7% for AGIs over 200k)
Ordinary dividends: $12,933 (reported on 53.8% of returns)
Here:
$12,933
State:
$10,909
(% of AGI for various income ranges: 12.0% for AGIs below $25k, 3.5% for AGIs $25k-50k, 4.9% for AGIs $50k-75k, 3.7% for AGIs $75k-100k, 3.8% for AGIs $100k-200k, 3.3% for AGIs over 200k)
Net capital gain/loss in AGI: +$52,017 (reported on 48.3% of returns)
Here:
+$52,017
State:
+$34,090
(% of AGI for various income ranges: 2.7% for AGIs $25k-50k, 2.3% for AGIs $50k-75k, 0.4% for AGIs $75k-100k, 1.9% for AGIs $100k-200k, 16.4% for AGIs over 200k)
Profit/loss from business: +$49,162 (reported on 24.6% of returns)
Here:
+$49,162
State:
+$22,741
(% of AGI for various income ranges: 9.3% for AGIs below $25k, 6.6% for AGIs $25k-50k, 9.4% for AGIs $50k-75k, 6.9% for AGIs $75k-100k, 7.1% for AGIs $100k-200k, 5.7% for AGIs over 200k)
Taxable individual retirement arrangement distribution: $32,177 (reported on 17.3% of returns)
06612:
$32,177
Connecticut:
$19,976
(% of AGI for various income ranges: 7.0% for AGIs below $25k, 6.4% for AGIs $25k-50k, 4.9% for AGIs $50k-75k, 7.1% for AGIs $75k-100k, 5.4% for AGIs $100k-200k, 1.8% for AGIs over 200k)
Self-employment retirement plans: $29,512 (reported on 4.6% of returns)
06612:
$29,512
Connecticut:
$24,004
(% of AGI for various income ranges: 0.7% for AGIs $100k-200k, 0.8% for AGIs over 200k)
Total itemized deductions: $52,174 (18% of AGI, reported on 65.6% of returns)
Here:
$52,174
State:
$33,239
Here:
18.2% of AGI
State:
18.9% of AGI
(% of AGI for various income ranges: 34.1% for AGIs below $25k, 26.1% for AGIs $25k-50k, 30.0% for AGIs $50k-75k, 27.6% for AGIs $75k-100k, 24.9% for AGIs $100k-200k, 14.2% for AGIs over 200k)
Charity contributions: $6,371 (reported on 58.7% of returns)
Here:
$6,371
State:
$4,947
(% of AGI for various income ranges: 1.5% for AGIs below $25k, 1.1% for AGIs $25k-50k, 1.8% for AGIs $50k-75k, 1.6% for AGIs $75k-100k, 1.8% for AGIs $100k-200k, 2.0% for AGIs over 200k)
Taxes paid: $31,052 (reported on 65.3% of returns)
06612:
$31,052
State:
$17,397
(% of AGI for various income ranges: 14.2% for AGIs below $25k, 12.7% for AGIs $25k-50k, 13.9% for AGIs $50k-75k, 14.5% for AGIs $75k-100k, 13.6% for AGIs $100k-200k, 9.1% for AGIs over 200k)
Earned income credit: $1,450 (reported on 2.9% of returns)
Here:
$1,450
State:
$2,053
(% of AGI for various income ranges: 1.3% for AGIs below $25k, 0.3% for AGIs $25k-50k)
Percentage of individuals using paid preparers for their 2012 taxes: 67.6%
Here:
68%
State:
55%
(% for various income ranges: 60.0% for AGIs below $25k, 60.0% for AGIs $25k-50k, 64.5% for AGIs $50k-75k, 71.0% for AGIs $75k-100k, 70.4% for AGIs $100k-200k, 77.1% for AGIs over 200k)
Averages for the 2004 tax year for zip code 06612, filed in 2005:
Average Adjusted Gross Income (AGI) in 2004: $147,089 (Individual Income Tax Returns)
Here:
$147,089
State:
$73,265
Salary/wage: $122,060 (reported on 72.1% of returns)
Here:
$122,060
State:
$62,030
(% of AGI for various income ranges: 53.7% for AGIs $10k-25k, 52.2% for AGIs $25k-50k, 54.1% for AGIs $50k-75k, 65.5% for AGIs $75k-100k, 59.6% for AGIs over 100k)
Taxable interest for individuals: $4,383 (reported on 77.9% of returns)
This zip code:
$4,383
Connecticut:
$2,287
(% of AGI for various income ranges: 6.7% for AGIs $10k-25k, 4.5% for AGIs $25k-50k, 3.6% for AGIs $50k-75k, 2.3% for AGIs $75k-100k, 2.1% for AGIs over 100k)
Taxable dividends: $6,585 (reported on 62.4% of returns)
Here:
$6,585
State:
$5,735
(% of AGI for various income ranges: 7.2% for AGIs $10k-25k, 5.0% for AGIs $25k-50k, 4.7% for AGIs $50k-75k, 3.5% for AGIs $75k-100k, 2.4% for AGIs over 100k)
Net capital gain/loss: +$26,192 (reported on 56.5% of returns)
Here:
+$26,192
State:
+$23,694
(% of AGI for various income ranges: 5.0% for AGIs $10k-25k, 1.1% for AGIs $25k-50k, 2.2% for AGIs $50k-75k, 3.0% for AGIs $75k-100k, 11.2% for AGIs over 100k)
Profit/loss from business: +$42,165 (reported on 24.7% of returns)
Here:
+$42,165
State:
+$20,783
(% of AGI for various income ranges: 16.8% for AGIs $10k-25k, 13.7% for AGIs $25k-50k, 10.3% for AGIs $50k-75k, 9.3% for AGIs $75k-100k, 6.4% for AGIs over 100k)
Profit/loss from farming: +$7,333 (reported on 0.3% of returns)
Here:
+$7,333
State:
-$3,306
IRA payment deduction: $3,912 (reported on 5.6% of returns)
06612:
$3,912
Connecticut:
$3,216
(% of AGI for various income ranges: 0.7% for AGIs $10k-25k, 0.4% for AGIs $25k-50k, 0.5% for AGIs $50k-75k, 0.3% for AGIs $75k-100k, 0.1% for AGIs over 100k)
Self-employed pension: $22,950 (reported on 6.6% of returns)
Here:
$22,950
Connecticut:
$17,335
(% of AGI for various income ranges: 1.0% for AGIs $25k-50k, 0.8% for AGIs $50k-75k, 0.6% for AGIs $75k-100k, 1.1% for AGIs over 100k)
Total itemized deductions: $38,782 (17% of AGI, reported on 63.2% of returns)
Here:
$38,782
State:
$24,919
Here:
17.4% of AGI
State:
18.6% of AGI
(% of AGI for various income ranges: 33.8% for AGIs $10k-25k, 28.6% for AGIs $25k-50k, 29.1% for AGIs $50k-75k, 28.0% for AGIs $75k-100k, 14.7% for AGIs over 100k)
Charity contributions deductions: $5,083 (2% of AGI, reported on 59.7% of returns)
Here:
$5,083
State:
$3,762
Here:
2.2% of AGI
State:
2.7% of AGI
(% of AGI for various income ranges: 2.0% for AGIs $10k-25k, 2.2% for AGIs $25k-50k, 2.5% for AGIs $50k-75k, 2.8% for AGIs $75k-100k, 2.0% for AGIs over 100k)
Total tax: $37,629 (reported on 82.0% of returns)
06612:
$37,629
State:
$15,148
(% of AGI for various income ranges: 6.3% for AGIs $10k-25k, 8.9% for AGIs $25k-50k, 10.1% for AGIs $50k-75k, 10.3% for AGIs $75k-100k, 22.6% for AGIs over 100k)
Earned income credit: $1,085 (reported on 2.6% of returns)
Here:
$1,085
State:
$1,570
Percentage of individuals using paid preparers for their 2004 taxes: 69.4%
Here:
69%
State:
59%
(% for various income ranges: 63.6% for AGIs below $10k, 64.9% for AGIs $10k-25k, 64.9% for AGIs $25k-50k, 72.9% for AGIs $50k-75k, 65.1% for AGIs $75k-100k, 75.1% for AGIs over 100k)
Likely homosexual households (counted as self-reported same-sex unmarried-partner households)
Lesbian couples: 0.4% of all households
Gay men: 0.0% of all households
Household received Food Stamps/SNAP in the past 12 months: 55 Household did not receive Food Stamps/SNAP in the past 12 months: 2,661
Women who had a birth in the past 12 months: 52 (36 now married, 16 unmarried) Women who did not have a birth in the past 12 months: 1,324 (721 now married, 583 unmarried)
Housing units in zip code 06612 with a mortgage: 1,367 (214 second mortgage, 9 home equity loan, 212 both second mortgage and home equity loan) Houses without a mortgage: 44
Median monthly owner costs for units with a mortgage: $3,810 Median monthly owner costs for units without a mortgage: $1,443
Residents with income below the poverty level in 2022:
This zip code:
7.5%
Whole state:
9.8%
Residents with income below 50% of the poverty level in 2022:
This zip code:
1.9%
Whole state:
4.8%
Median number of rooms in houses and condos:
Here:
10.0
State:
6.5
Median number of rooms in apartments:
Here:
6.5
State:
4.0
Notable locations in this zip code not listed on our city pages
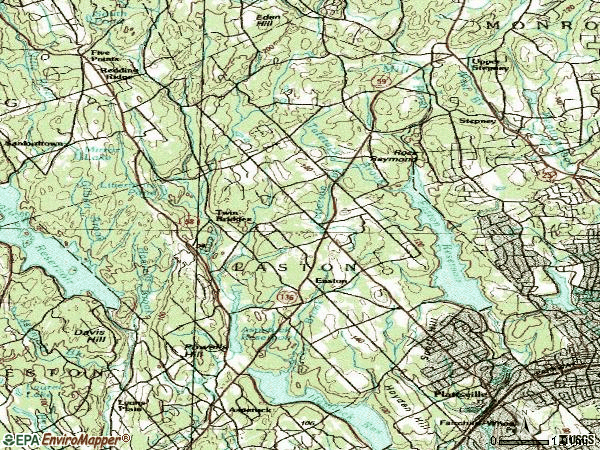
Notable locations in zip code 06612: Twin Bridges (A), Connecticut Golf Club (B), Aspetuck Four Corners (C), Easton Volunteer Emergency Management Service (D), Easton Volunteer Fire Department (E). Display/hide their locations on the map
Churches in zip code 06612 include: Covenant Church of Easton (A), Easton Baptist Church (B), Christ Church (C), Jesse Lee United Methodist Church (D), Notre Dame of Easton (E). Display/hide their locations on the map
Cemeteries: Gilbertown Cemetery (1), Union Cemetery (2), Aspetuck Cemetery (3), Old Indian Cemetery (4), Maple Grove Memorial Park (5). Display/hide their locations on the map
Lakes and reservoirs: Livermore Pond (A), Mother Superior Lake (B), Pfeiffer Pond (C), Big Lake (D), Aspetuck Reservoir (E), Hemlock Reservoir (F), Easton Reservoir (G), Saugatuck Reservoir (H). Display/hide their locations on the map
Streams, rivers, and creeks: Morehouse Brook (A), Patterson Brook (B), Ballwall Brook (C), Canoe Brook (D), Chub Brook (E), Gilbert Brook (F), Tatetuck Brook (G). Display/hide their locations on the map
In group quarters: 5 (-1 institutionalized population)
Size of family households: 1,001 2-persons, 494 3-persons, 474 4-persons, 143 5-persons, 53 6-persons, 3 7-or-more-persons
Size of nonfamily households: 392 1-person, 135 2-persons
1,542 married couples with children.
249 single-parent households (71 men, 178 women).
89.2% of residents of 06612 zip code speak English at home.
1.3% of residents speak Spanish at home (91% very well, 6% well, 2% not well).
8.2% of residents speak other Indo-European language at home (78% very well, 18% well, 4% not well).
0.7% of residents speak Asian or Pacific Island language at home (92% very well, 8% well).
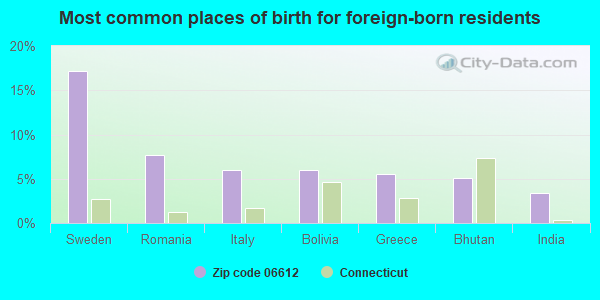
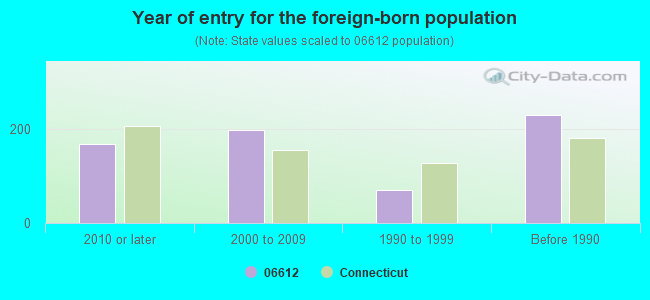
Foreign born population: 629 (8.2%) (65.2% of them are naturalized citizens)
This zip code:
8.2%
Whole state:
15.7%
17%Sweden
8%Romania
6%Italy
6%Bolivia
6%Greece
5%Bhutan
3%India
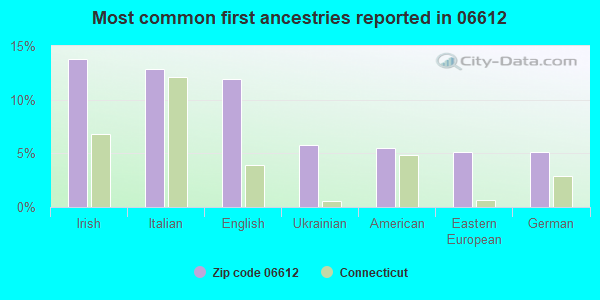
14%Irish
13%Italian
12%English
6%Ukrainian
5%American
5%Eastern European
5%German
Year of entry for the foreign-born population
1692010 or later
1992000 to 2009
701990 to 1999
230Before 1990
Facilities with environmental interests located in this zip code:
HOMEBOUND (605 MAIN STREET in EASTON, CT)
(National Center for Education Statistics) - STATE ID-88 Organizations: EASTON SCHOOL DISTRICT (SCHOOL DISTRICT)
, REGIONAL SCHOOL DISTRICT 09 (SCHOOL DISTRICT)
HELEN KELLER MIDDLE SCHOOL (360 SPORT HILL ROAD in EASTON, CT)
(National Center for Education Statistics) - STATE ID-51 Organizations: EASTON SCHOOL DISTRICT (SCHOOL DISTRICT)
EASTON TOWN OF (ROUTES 136 AND 59 in EASTON, CT)
(Resource Conservation and Recovery Act (tracking hazardous waste)) Organizations: TOWN OF EASTON (CONTACT/OWNER)
B H C COMPANY (43 BUCK HILL RD in EASTON, CT)
AIR MINOR (AIRS/AFS) Business SIC classification: WATER SUPPLY Alternative names: BDPT HYDRAULIC COMPANY
EASTON TOWN OF (15 WESTPORT RD in EASTON, CT)
Small Quantity Generators, between 100 kg and 1000 kg of hazardous waste/month (Resource Conservation and Recovery Act (tracking hazardous waste)) - notification Organizations: TOWN OF EASTON (CONTACT/OWNER)
EASTON BOARD OF EDUCATION (215 CENTER STREET in EASTON, CT)
COMPLIANCE ACTIVITY (Tracking inspections of insecticide, fungicide, and rodenticide, and toxic substances)
Housing units lacking complete plumbing facilities: 0.4% Housing units lacking complete kitchen facilities: 0.4%
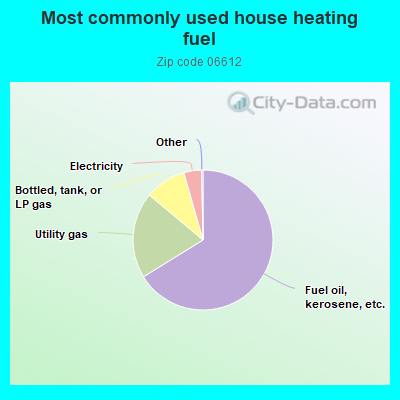
66.2%Fuel oil, kerosene, etc.
19.9%Utility gas
9.5%Bottled, tank, or LP gas
4.1%Electricity
Population in 1990: 6,213. Population change in the 1990s: +1,059 (+17.0%).
Place of birth for U.S.-born residents:
This state: 3,711
Northeast: 2,095
Midwest: 358
South: 429
West: 388
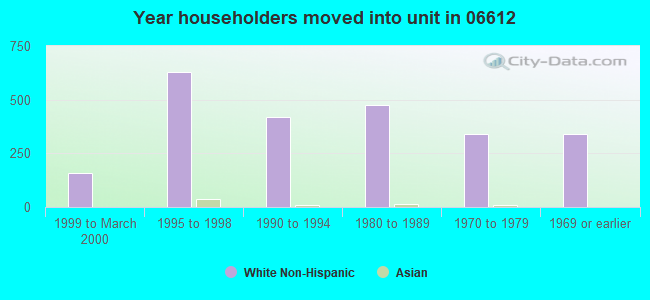
67% of the 06612 zip code residents lived in the same house 5 years ago. Out of people who lived in different houses, 73% lived in this county. Out of people who lived in different counties, 50% lived in Connecticut.
90% of the 06612 zip code residents lived in the same house 1 year ago. Out of people who lived in different houses, 32% moved from this county. Out of people who lived in different houses, 37% moved from different county within same state. Out of people who lived in different houses, 28% moved from different state. Out of people who lived in different houses, 3% moved from abroad.
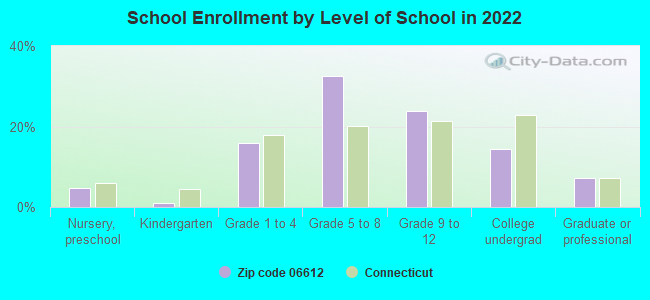
Private vs. public school enrollment:
Students in private schools in grades 1 to 8 (elementary and middle school): 75
Here:
7.7%
Connecticut:
9.5%
Students in private schools in grades 9 to 12 (high school): 12
Here:
2.6%
Connecticut:
12.9%
Students in private undergraduate colleges: 166
Here:
56.5%
Connecticut:
35.5%
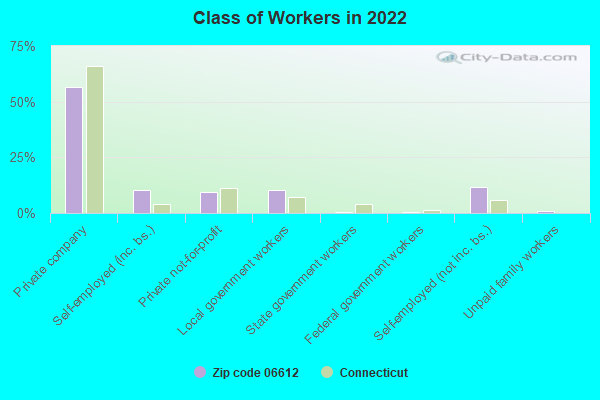
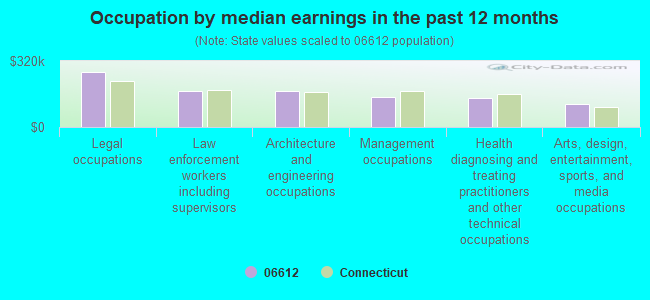
Occupation by median earnings in the past 12 months ($)
267,541Legal occupations
173,747Law enforcement workers including supervisors
173,083Architecture and engineering occupations
143,057Management occupations
140,800Health diagnosing and treating practitioners and other technical occupations
109,419Arts, design, entertainment, sports, and media occupations
Top industries in this zip code by the number of employees in 2005:
Administrative and Support and Waste Management and Remediation Services: Landscaping Services (10-19 employees: 2 establishments, 5-9 employees: 2 establishments, 1-4 employees: 14 establishments)
Other Services (except Public Administration): Religious Organizations (10-19: 3, 5-9: 1)
Health Care and Social Assistance: Services for the Elderly and Persons with Disabilities (20-49: 1)
Arts, Entertainment, and Recreation: Golf Courses and Country Clubs (20-49: 1)
Other Services (except Public Administration): Commercial and Industrial Machinery and Equipment (except Automotive and Electronic) Repair and Maintenance (20-49: 1)
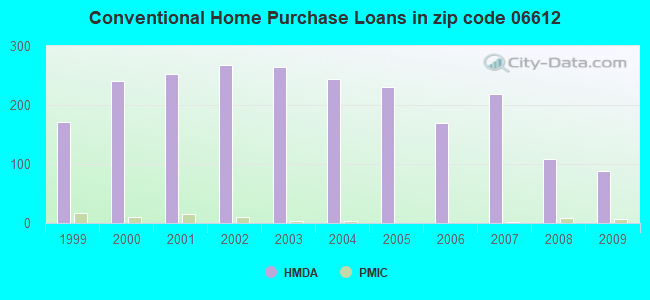
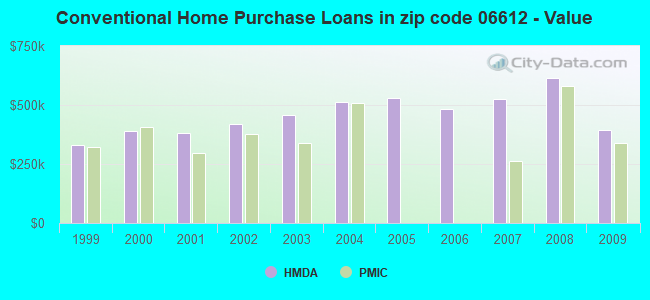
Detailed PMIC statistics for the following Tracts:1051.00
, 1052.00
2002 - 2018 National Fire Incident Reporting System (NFIRS) incidents
According to the data from the years 2002 - 2018 the average number of fires per year is 22. The highest number of fires - 34 took place in 2005, and the least - 0 in 2003. The data has a growing trend.
When looking into fire subcategories, the most reports belonged to: Structure Fires (44.2%), and Outside Fires (35.5%).
Fire incident types reported to NFIRS in Zip Code 06612


+$7,333
-$3,306
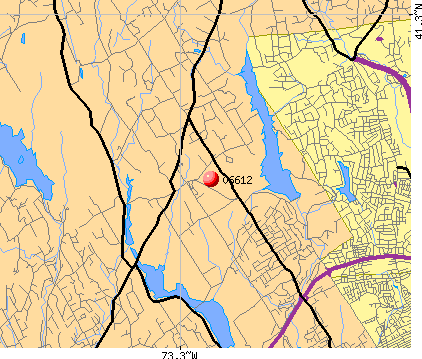 Nearest zip codes: 06883, 06611, 06825, 06824, 06896, 06468.


 According to the data from the years 2002 - 2018 the average number of fires per year is 22. The highest number of fires - 34 took place in 2005, and the least - 0 in 2003. The data has a growing trend.
 When looking into fire subcategories, the most reports belonged to: Structure Fires (44.2%), and Outside Fires (35.5%).