Estimated zip code population in 2022: 2,323 Zip code population in 2010: 2,376 Zip code population in 2000: 2,178
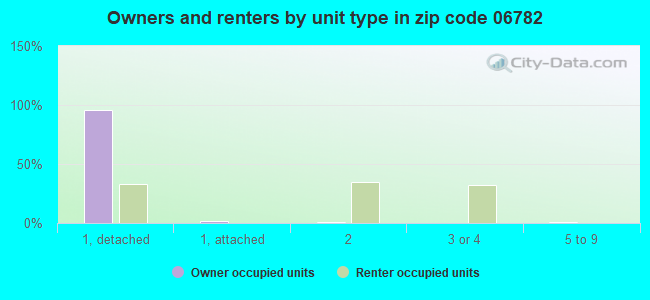
Houses and condos: 838 Renter-occupied apartments: 94
% of renters here:
11%
State:
34%
March 2022 cost of living index in zip code 06782: 124.8 (high, U.S. average is 100)
Land area: 7.5 sq. mi. Water area: 0.2 sq. mi.
Population density: 309 people per square mile
(very low).
OSM Map
Google Map
MSN Map
OSM Map
General Map
Google Map
MSN Map
OSM Map
Google Map
MSN Map
OSM Map
Google Map
MSN Map
Please wait while loading the map...
Real estate property taxes paid for housing units in 2022:
This zip code:
2.1% ($6,209)
Connecticut:
1.8% ($6,189)
Median real estate property taxes paid for housing units with mortgages in 2022: $6,451 (1.9%) Median real estate property taxes paid for housing units with no mortgage in 2022: $5,796 (2.4%)
Business Search- 14 Million verified businesses
Males: 1,094
(47.1%)
Females: 1,228
(52.9%)
For population 25 years and over in 06782:
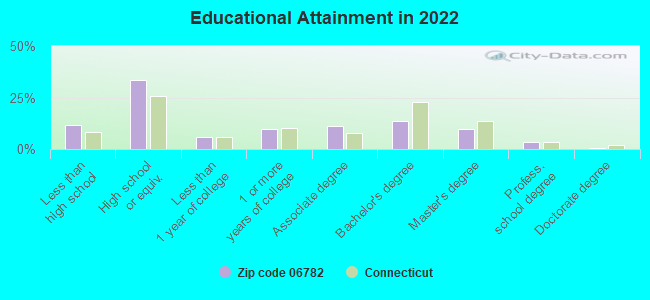
High school or higher: 88.3%
Bachelor's degree or higher: 27.5%
Graduate or professional degree: 13.8%
Unemployed: 1.3%
Mean travel time to work (commute): 24.6 minutes
For population 15 years and over in 06782:
Never married: 37.4%
Now married: 41.4%
Separated: 0.8%
Widowed: 10.4%
Divorced: 10.0%
Zip code 06782 compared to state average:
Unemployed percentage significantly below state average.
Black race population percentage below state average.
Median age significantly above state average.
Renting percentage significantly below state average.
Length of stay since moving in significantly above state average.
Averages for the 2020 tax year for zip code 06782, filed in 2021:
Average Adjusted Gross Income (AGI) in 2020: $69,510 (Individual Income Tax Returns)
Here:
$69,510
State:
$105,931
Salary/wage: $62,763 (reported on 81.3% of returns)
Here:
$62,763
State:
$83,540
(% of AGI for various income ranges: 1104.8% for AGIs below $25k, 3338.6% for AGIs $25k-50k, 6196.7% for AGIs $50k-75k, 9000.0% for AGIs $75k-100k, 16503.1% for AGIs $100k-200k)
Taxable interest for individuals: $1,012 (reported on 34.1% of returns)
This zip code:
$1,012
Connecticut:
$3,402
(% of AGI for various income ranges: 21.0% for AGIs below $25k, 23.6% for AGIs $25k-50k, 34.0% for AGIs $50k-75k, 64.0% for AGIs $75k-100k, 121.2% for AGIs $100k-200k)
Ordinary dividends: $3,007 (reported on 24.4% of returns)
Here:
$3,007
State:
$12,683
(% of AGI for various income ranges: 51.9% for AGIs below $25k, 33.2% for AGIs $25k-50k, 86.7% for AGIs $50k-75k, 114.0% for AGIs $75k-100k, 190.6% for AGIs $100k-200k)
Net capital gain/loss in AGI: +$7,691 (reported on 17.9% of returns)
Here:
+$7,691
State:
+$44,158
(% of AGI for various income ranges: 0.5% for AGIs below $25k, 15.9% for AGIs $25k-50k, 52.7% for AGIs $50k-75k, 147.0% for AGIs $75k-100k, 893.8% for AGIs $100k-200k)
Profit/loss from business: +$13,365 (reported on 13.8% of returns)
Here:
+$13,365
State:
+$22,988
(% of AGI for various income ranges: 77.1% for AGIs below $25k, 205.0% for AGIs $25k-50k, 332.0% for AGIs $50k-75k, 725.6% for AGIs $100k-200k)
Taxable individual retirement arrangement distribution: $14,062 (reported on 10.6% of returns)
06782:
$14,062
Connecticut:
$22,031
(% of AGI for various income ranges: 71.9% for AGIs below $25k, 108.6% for AGIs $25k-50k, 369.3% for AGIs $50k-75k, 552.5% for AGIs $100k-200k)
Total itemized deductions: $20,492 (reported on 9.8% of returns)
Here:
$20,492
State:
$37,613
(% of AGI for various income ranges: 624.0% for AGIs $50k-75k, 559.0% for AGIs $75k-100k, 602.5% for AGIs $100k-200k)
Charity contributions: $2,714 (reported on 5.7% of returns)
Here:
$2,714
State:
$13,557
(% of AGI for various income ranges: 51.3% for AGIs $50k-75k, 70.6% for AGIs $100k-200k)
Taxes paid: $8,467 (reported on 9.8% of returns)
06782:
$8,467
State:
$9,096
(% of AGI for various income ranges: 236.7% for AGIs $50k-75k, 249.0% for AGIs $75k-100k, 257.5% for AGIs $100k-200k)
Earned income credit: $1,660 (reported on 8.1% of returns)
Here:
$1,660
State:
$2,059
(% of AGI for various income ranges: 47.6% for AGIs below $25k, 30.0% for AGIs $25k-50k)
Percentage of individuals using paid preparers for their 2020 taxes: 93.5%
Here:
93%
State:
93%
(% for various income ranges: 93.5% for AGIs below $25k, 92.9% for AGIs $25k-50k, 90.5% for AGIs $50k-75k, 92.9% for AGIs $75k-100k, 96.0% for AGIs $100k-200k, 100.0% for AGIs over 200k)
Averages for the 2012 tax year for zip code 06782, filed in 2013:
Average Adjusted Gross Income (AGI) in 2012: $60,379 (Individual Income Tax Returns)
Here:
$60,379
State:
$93,290
Salary/wage: $54,865 (reported on 83.6% of returns)
Here:
$54,865
State:
$73,117
(% of AGI for various income ranges: 64.6% for AGIs below $25k, 79.2% for AGIs $25k-50k, 80.4% for AGIs $50k-75k, 75.9% for AGIs $75k-100k, 81.8% for AGIs $100k-200k, 50.1% for AGIs over 200k)
Taxable interest for individuals: $573 (reported on 52.5% of returns)
This zip code:
$573
Connecticut:
$2,530
(% of AGI for various income ranges: 1.8% for AGIs below $25k, 0.5% for AGIs $25k-50k, 0.6% for AGIs $50k-75k, 0.5% for AGIs $75k-100k, 0.3% for AGIs $100k-200k, 0.5% for AGIs over 200k)
Ordinary dividends: $1,759 (reported on 23.8% of returns)
Here:
$1,759
State:
$10,909
(% of AGI for various income ranges: 2.5% for AGIs below $25k, 0.7% for AGIs $25k-50k, 0.4% for AGIs $50k-75k, 0.9% for AGIs $75k-100k, 0.6% for AGIs $100k-200k)
Net capital gain/loss in AGI: +$439 (reported on 14.8% of returns)
Here:
+$439
State:
+$34,090
(% of AGI for various income ranges: 0.4% for AGIs $100k-200k)
Profit/loss from business: +$14,431 (reported on 13.1% of returns)
Here:
+$14,431
State:
+$22,741
(% of AGI for various income ranges: 7.2% for AGIs below $25k, 3.8% for AGIs $25k-50k, 3.0% for AGIs $50k-75k, 3.6% for AGIs $75k-100k, 2.9% for AGIs $100k-200k)
Taxable individual retirement arrangement distribution: $14,060 (reported on 8.2% of returns)
06782:
$14,060
Connecticut:
$19,976
(% of AGI for various income ranges: 3.3% for AGIs below $25k, 2.5% for AGIs $25k-50k, 3.7% for AGIs $50k-75k, 2.2% for AGIs $100k-200k)
Total itemized deductions: $20,021 (22% of AGI, reported on 47.5% of returns)
Here:
$20,021
State:
$33,239
Here:
21.9% of AGI
State:
18.9% of AGI
(% of AGI for various income ranges: 19.4% for AGIs below $25k, 13.0% for AGIs $25k-50k, 14.8% for AGIs $50k-75k, 16.5% for AGIs $75k-100k, 16.9% for AGIs $100k-200k, 13.5% for AGIs over 200k)
Charity contributions: $1,580 (reported on 36.9% of returns)
Here:
$1,580
State:
$4,947
(% of AGI for various income ranges: 0.6% for AGIs below $25k, 0.8% for AGIs $25k-50k, 0.8% for AGIs $50k-75k, 1.1% for AGIs $75k-100k, 1.1% for AGIs $100k-200k, 0.9% for AGIs over 200k)
Taxes paid: $10,549 (reported on 46.7% of returns)
06782:
$10,549
State:
$17,397
(% of AGI for various income ranges: 6.1% for AGIs below $25k, 6.1% for AGIs $25k-50k, 7.3% for AGIs $50k-75k, 8.7% for AGIs $75k-100k, 9.4% for AGIs $100k-200k, 8.4% for AGIs over 200k)
Earned income credit: $1,650 (reported on 8.2% of returns)
Here:
$1,650
State:
$2,053
(% of AGI for various income ranges: 2.8% for AGIs below $25k, 0.5% for AGIs $25k-50k)
Percentage of individuals using paid preparers for their 2012 taxes: 59.0%
Here:
59%
State:
55%
(% for various income ranges: 52.8% for AGIs below $25k, 55.6% for AGIs $25k-50k, 60.0% for AGIs $50k-75k, 64.7% for AGIs $75k-100k, 65.0% for AGIs $100k-200k, 100.0% for AGIs over 200k)
Averages for the 2004 tax year for zip code 06782, filed in 2005:
Average Adjusted Gross Income (AGI) in 2004: $50,245 (Individual Income Tax Returns)
Here:
$50,245
State:
$73,265
Salary/wage: $46,412 (reported on 88.1% of returns)
Here:
$46,412
State:
$62,030
(% of AGI for various income ranges: 102.3% for AGIs below $10k, 72.4% for AGIs $10k-25k, 84.6% for AGIs $25k-50k, 86.2% for AGIs $50k-75k, 89.4% for AGIs $75k-100k, 69.7% for AGIs over 100k)
Taxable interest for individuals: $731 (reported on 64.4% of returns)
This zip code:
$731
Connecticut:
$2,287
(% of AGI for various income ranges: 2.2% for AGIs below $10k, 2.3% for AGIs $10k-25k, 0.9% for AGIs $25k-50k, 0.9% for AGIs $50k-75k, 0.3% for AGIs $75k-100k, 1.2% for AGIs over 100k)
Taxable dividends: $1,626 (reported on 28.4% of returns)
Here:
$1,626
State:
$5,735
(% of AGI for various income ranges: 3.4% for AGIs below $10k, 0.8% for AGIs $10k-25k, 1.1% for AGIs $25k-50k, 0.5% for AGIs $50k-75k, 0.3% for AGIs $75k-100k, 1.5% for AGIs over 100k)
Net capital gain/loss: +$10,659 (reported on 18.4% of returns)
Here:
+$10,659
State:
+$23,694
(% of AGI for various income ranges: -2.0% for AGIs below $10k, 0.3% for AGIs $10k-25k, 0.5% for AGIs $25k-50k, 0.1% for AGIs $50k-75k, -0.2% for AGIs $75k-100k, 13.3% for AGIs over 100k)
Profit/loss from business: +$9,346 (reported on 13.3% of returns)
Here:
+$9,346
State:
+$20,783
(% of AGI for various income ranges: 6.3% for AGIs below $10k, 7.6% for AGIs $10k-25k, 2.9% for AGIs $25k-50k, 2.5% for AGIs $50k-75k, 2.8% for AGIs $75k-100k, 0.9% for AGIs over 100k)
IRA payment deduction: $3,000 (reported on 2.8% of returns)
06782:
$3,000
Connecticut:
$3,216
Total itemized deductions: $16,507 (22% of AGI, reported on 49.4% of returns)
Here:
$16,507
State:
$24,919
Here:
21.7% of AGI
State:
18.6% of AGI
(% of AGI for various income ranges: 10.3% for AGIs below $10k, 10.7% for AGIs $10k-25k, 15.9% for AGIs $25k-50k, 17.3% for AGIs $50k-75k, 18.8% for AGIs $75k-100k, 14.9% for AGIs over 100k)
Charity contributions deductions: $1,433 (2% of AGI, reported on 43.6% of returns)
Here:
$1,433
State:
$3,762
Here:
1.8% of AGI
State:
2.7% of AGI
(% of AGI for various income ranges: 0.5% for AGIs $10k-25k, 0.9% for AGIs $25k-50k, 1.5% for AGIs $50k-75k, 1.2% for AGIs $75k-100k, 1.5% for AGIs over 100k)
Total tax: $6,363 (reported on 84.2% of returns)
06782:
$6,363
State:
$15,148
(% of AGI for various income ranges: 3.7% for AGIs below $10k, 5.6% for AGIs $10k-25k, 7.7% for AGIs $25k-50k, 9.1% for AGIs $50k-75k, 9.9% for AGIs $75k-100k, 15.7% for AGIs over 100k)
Earned income credit: $1,317 (reported on 6.8% of returns)
Here:
$1,317
State:
$1,570
Percentage of individuals using paid preparers for their 2004 taxes: 58.9%
Here:
59%
State:
59%
(% for various income ranges: 47.0% for AGIs below $10k, 52.2% for AGIs $10k-25k, 58.1% for AGIs $25k-50k, 65.1% for AGIs $50k-75k, 66.2% for AGIs $75k-100k, 71.2% for AGIs over 100k)
Notable locations in zip code 06782: Camp Mattatuck (A), Plymouth Library Association (B), Plymouth Historical Society Building (C), Terryville Volunteer Fire Department Station 2 (D). Display/hide their locations on the map
In group quarters: 76 (-1 institutionalized population)
Size of family households: 215 2-persons, 85 3-persons, 154 4-persons, 54 5-persons, 21 6-persons
Size of nonfamily households: 268 1-person, 48 2-persons
206 married couples with children.
130 single-parent households (96 men, 34 women).
90.8% of residents of 06782 zip code speak English at home.
3.9% of residents speak Spanish at home (72% very well, 12% well, 16% not well).
2.5% of residents speak other Indo-European language at home (64% very well, 19% well, 17% not at all).
2.2% of residents speak Asian or Pacific Island language at home (64% very well, 36% well).
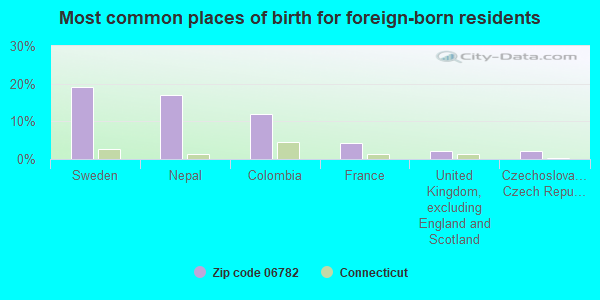
Foreign born population: 242 (10.4%) (73.0% of them are naturalized citizens)
This zip code:
10.4%
Whole state:
15.7%
19%Sweden
17%Nepal
12%Colombia
4%France
2%United Kingdom, excluding England and Scotland
2%Czechoslovakia (includes Czech Republic and Slovakia)
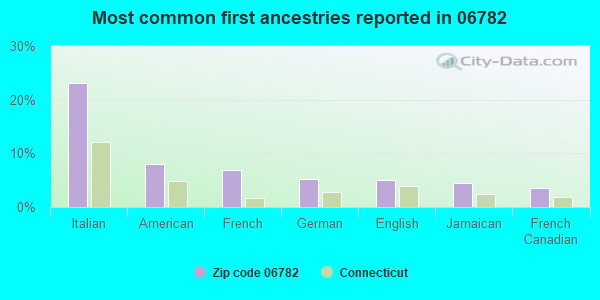
23%Italian
8%American
7%French
5%German
5%English
4%Jamaican
4%French Canadian
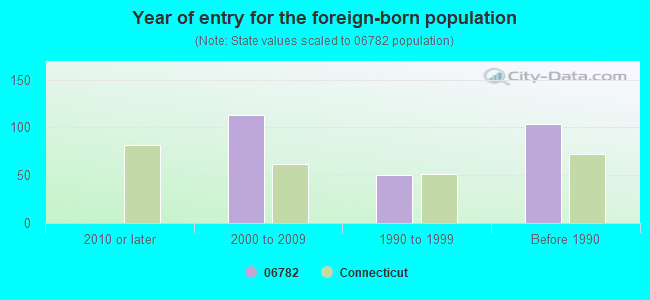
Year of entry for the foreign-born population
02010 or later
1132000 to 2009
501990 to 1999
104Before 1990
Facilities with environmental interests located in this zip code:
DRS RESEARCH GROUP (50 ALTAIR AVENUE in PLYMOUTH, CT)
ENFORCEMENT/COMPLIANCE ACTIVITY (Integrated Compliance Information System) - ICIS-01-2003-0133, FORMAL ENFORCEMENT ACTION (Integrated Compliance Information System) - ICIS-01-2003-0133, FORMAL ENFORCEMENT ACTION
ALLIEDSIGNAL AEROSPACE (50 ALTAIR AVE in PLYMOUTH, CT)
AIR MINOR (AIRS/AFS) COMPLIANCE ACTIVITY (Tracking inspections of insecticide, fungicide, and rodenticide, and toxic substances) (Resource Conservation and Recovery Act (tracking hazardous waste)) TRI REPORTER (Tracking of toxic chemicals releasing facilities) Business SIC classification: AIRCRAFT ENGINES AND ENGINE PARTS; AIRCRAFT PARTS AND AUXILIARY EQUIPMENT Organizations: MIDLAND ROSS CORP (CONTACT/OWNER)
Alternative names: FL AEROSPACE, GRIMES AEROSPACE CO, HONEYWELL INTERNATIONAL INC
HARWINTON HEIGHTS (HARWINTON HEIGHTS RD in PLYMOUTH, CT)
National Pollutant Discharge Elimination System NON-MAJOR (Tracking pollutant discharge elimination systems) - permit - ICIS-01-2004-2107, FORMAL ENFORCEMENT ACTION
ESTATE OF JOHN T MACDERMID (400 HARWINTON AVENUE in PLYMOUTH, CT)
Large Quantity Generators, more that 1000 kg of hazardous waste/month (Resource Conservation and Recovery Act (tracking hazardous waste)) - notification TRANSPORTER (Resource Conservation and Recovery Act (tracking hazardous waste)) - notification TSD (Resource Conservation and Recovery Act (tracking hazardous waste)) - notification Business NAICS classification: POLISH AND OTHER SANITATION GOOD MANUFACTURING. Organizations: MACDERMID OF BRISTOL INC (CONTACT/OWNER)
Alternative names: MACDERMID JOHN T ESTATE OF, MACDERMID OF BRISTOL INC
D & D AUTO WORKS, INC (559 MAIN ST in PLYMOUTH, CT)
AIR MINOR (AIRS/AFS) Business SIC classification: TOP, BODY, AND UPHOLSTERY REPAIR SHOPS AND PAINT SHOPS
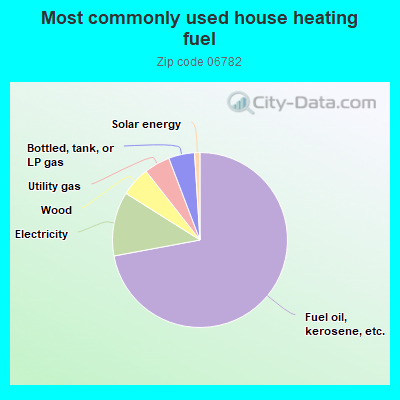
72.3%Fuel oil, kerosene, etc.
11.9%Electricity
5.5%Wood
4.8%Utility gas
4.8%Bottled, tank, or LP gas
1.0%Solar energy
Population in 1990: 2,910.
Place of birth for U.S.-born residents:
This state: 1,799
Northeast: 176
Midwest: 5
South: 8
West: 26
70% of the 06782 zip code residents lived in the same house 5 years ago. Out of people who lived in different houses, 50% lived in this county. Out of people who lived in different counties, 50% lived in Connecticut.
89% of the 06782 zip code residents lived in the same house 1 year ago. Out of people who lived in different houses, 71% moved from this county. Out of people who lived in different houses, 13% moved from different county within same state.
Private vs. public school enrollment:
Students in private schools in grades 1 to 8 (elementary and middle school): 16
Here:
9.7%
Connecticut:
9.5%
Students in private schools in grades 9 to 12 (high school): 20
Here:
16.4%
Connecticut:
12.9%
Students in private undergraduate colleges: 11
Here:
14.2%
Connecticut:
35.5%
Occupation by median earnings in the past 12 months ($)
100,184Management occupations
87,581Health diagnosing and treating practitioners and other technical occupations
83,493Construction and extraction occupations
62,352Installation, maintenance, and repair occupations
51,454Sales and related occupations
51,069Education, training, and library occupations
Top industries in this zip code by the number of employees in 2005:
Health Care and Social Assistance: Nursing Care Facilities (50-99 employees: 1 establishment)
Health Care and Social Assistance: Home Health Care Services (10-19: 1)
Wholesale Trade: Brick, Stone, and Related Construction Material Merchant Wholesalers (5-9: 1)
Administrative and Support and Waste Management and Remediation Services: All Other Support Services (5-9: 1)
Wholesale Trade: Industrial Machinery and Equipment Merchant Wholesalers (5-9: 1)
People in group quarters in 2010:
59 people in nursing facilities/skilled-nursing facilities
6 people in group homes intended for adults
People in group quarters in 2000:
57 people in nursing homes
6 people in homes for the mentally retarded
Home Mortgage Disclosure Act Aggregated Statistics For Year 2003 (Based on 4 partial tracts)
A) FHA, FSA/RHS & VA Home Purchase Loans
B) Conventional Home Purchase Loans
C) Refinancings
D) Home Improvement Loans
F) Non-occupant Loans on < 5 Family Dwellings (A B C & D)
Number
Average Value
Number
Average Value
Number
Average Value
Number
Average Value
Number
Average Value
LOANS ORIGINATED
24
$138,434
96
$146,998
431
$120,190
18
$20,823
10
$103,075
APPLICATIONS APPROVED, NOT ACCEPTED
2
$105,840
12
$138,341
61
$134,960
5
$22,156
3
$97,757
APPLICATIONS DENIED
3
$104,907
14
$113,666
173
$124,496
20
$44,283
8
$100,469
APPLICATIONS WITHDRAWN
1
$166,340
8
$107,895
99
$132,419
3
$13,070
6
$118,650
FILES CLOSED FOR INCOMPLETENESS
0
$0
1
$87,810
10
$120,233
0
$0
0
$0
Aggregated Statistics For Year 2002 (Based on 4 partial tracts)
A) FHA, FSA/RHS & VA Home Purchase Loans
B) Conventional Home Purchase Loans
C) Refinancings
D) Home Improvement Loans
F) Non-occupant Loans on < 5 Family Dwellings (A B C & D)
Number
Average Value
Number
Average Value
Number
Average Value
Number
Average Value
Number
Average Value
LOANS ORIGINATED
30
$116,368
100
$124,973
218
$114,696
22
$28,932
4
$60,955
APPLICATIONS APPROVED, NOT ACCEPTED
0
$0
6
$85,627
44
$91,516
5
$51,300
2
$50,685
APPLICATIONS DENIED
3
$102,043
10
$111,063
68
$97,361
8
$24,600
2
$111,570
APPLICATIONS WITHDRAWN
1
$146,750
6
$111,248
43
$95,344
4
$33,940
1
$28,220
FILES CLOSED FOR INCOMPLETENESS
1
$65,070
4
$163,118
39
$118,011
0
$0
1
$57,480
Aggregated Statistics For Year 2001 (Based on 4 partial tracts)
A) FHA, FSA/RHS & VA Home Purchase Loans
B) Conventional Home Purchase Loans
C) Refinancings
D) Home Improvement Loans
F) Non-occupant Loans on < 5 Family Dwellings (A B C & D)
Number
Average Value
Number
Average Value
Number
Average Value
Number
Average Value
Number
Average Value
LOANS ORIGINATED
43
$113,158
92
$113,127
182
$98,524
20
$20,340
4
$60,560
APPLICATIONS APPROVED, NOT ACCEPTED
5
$101,598
13
$132,901
25
$86,324
5
$43,188
1
$68,210
APPLICATIONS DENIED
4
$110,638
11
$90,401
70
$93,375
16
$19,945
5
$56,182
APPLICATIONS WITHDRAWN
3
$78,523
3
$107,303
38
$92,736
7
$48,354
1
$78,400
FILES CLOSED FOR INCOMPLETENESS
0
$0
3
$155,540
11
$99,154
3
$32,407
0
$0
Aggregated Statistics For Year 2000 (Based on 4 partial tracts)
A) FHA, FSA/RHS & VA Home Purchase Loans
B) Conventional Home Purchase Loans
C) Refinancings
D) Home Improvement Loans
E) Loans on Dwellings For 5+ Families
F) Non-occupant Loans on < 5 Family Dwellings (A B C & D)
Number
Average Value
Number
Average Value
Number
Average Value
Number
Average Value
Number
Average Value
Number
Average Value
LOANS ORIGINATED
37
$104,477
67
$104,458
47
$80,161
16
$18,694
1
$148,960
2
$82,225
APPLICATIONS APPROVED, NOT ACCEPTED
0
$0
5
$75,420
14
$88,161
7
$25,363
0
$0
1
$31,360
APPLICATIONS DENIED
7
$93,286
11
$70,542
47
$61,307
18
$20,869
0
$0
0
$0
APPLICATIONS WITHDRAWN
1
$142,260
3
$108,467
24
$69,613
4
$57,975
0
$0
1
$81,540
FILES CLOSED FOR INCOMPLETENESS
0
$0
2
$67,280
13
$99,961
2
$36,455
0
$0
1
$23,520
Aggregated Statistics For Year 1999 (Based on 2 partial tracts)
A) FHA, FSA/RHS & VA Home Purchase Loans
B) Conventional Home Purchase Loans
C) Refinancings
D) Home Improvement Loans
F) Non-occupant Loans on < 5 Family Dwellings (A B C & D)


 Nearest zip codes: 06786, 06787, 06704, 06779, 06710, 06795.