Estimated zip code population in 2022: 4,936 Zip code population in 2010: 4,881 Zip code population in 2000: 4,845
Houses and condos: 1,756 Renter-occupied apartments: 253
% of renters here:
15%
State:
35%
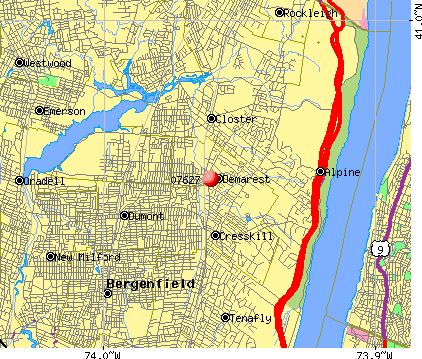
March 2022 cost of living index in zip code 07627: 125.2 (high, U.S. average is 100)
Land area: 2.1 sq. mi. Water area: 0.0 sq. mi.
Population density: 2,388 people per square mile
(low).
OSM Map
Google Map
MSN Map
OSM Map
General Map
Google Map
MSN Map
OSM Map
Google Map
MSN Map
OSM Map
Google Map
MSN Map
Please wait while loading the map...
Real estate property taxes paid for housing units in 2022:
This zip code:
0.9% ($9,521)
New Jersey:
2.1% ($8,897)
Median real estate property taxes paid for housing units with mortgages in 2022: $9,557 (0.8%) Median real estate property taxes paid for housing units with no mortgage in 2022: $9,483 (1.1%)
Business Search- 14 Million verified businesses
Males: 2,461
(49.9%)
Females: 2,475
(50.1%)
For population 25 years and over in 07627:
High school or higher: 101.0%
Bachelor's degree or higher: 77.9%
Graduate or professional degree: 39.3%
Unemployed: 3.7%
Mean travel time to work (commute): 35.8 minutes
For population 15 years and over in 07627:
Never married: 13.6%
Now married: 76.1%
Separated: 0.8%
Widowed: 4.3%
Divorced: 5.2%
Zip code 07627 compared to state average:
Median household income above state average.
Median house value significantly above state average.
Black race population percentage significantly below state average.
Hispanic race population percentage significantly below state average.
Median age above state average.
Renting percentage significantly below state average.
Length of stay since moving in significantly above state average.
Number of rooms per house significantly above state average.
Percentage of population with a bachelor's degree or higher above state average.
Estimated median house/condo value in 2022: $1,003,011
07627:
$1,003,011
New Jersey:
$428,900
Median resident age:
This zip code:
46.1 years
New Jersey median age:
40.4 years
Average household size:
This zip code:
2.9 people
New Jersey:
2.6 people
Averages for the 2020 tax year for zip code 07627, filed in 2021:
Average Adjusted Gross Income (AGI) in 2020: $274,058 (Individual Income Tax Returns)
Here:
$274,058
State:
$95,247
Salary/wage: $210,862 (reported on 75.4% of returns)
Here:
$210,862
State:
$80,635
(% of AGI for various income ranges: 1604.4% for AGIs below $25k, 4090.7% for AGIs $25k-50k, 7035.5% for AGIs $50k-75k, 10177.8% for AGIs $75k-100k, 23474.7% for AGIs $100k-200k, 161631.1% for AGIs over 200k)
Taxable interest for individuals: $8,347 (reported on 60.3% of returns)
This zip code:
$8,347
New Jersey:
$2,414
(% of AGI for various income ranges: 48.3% for AGIs below $25k, 139.3% for AGIs $25k-50k, 205.5% for AGIs $50k-75k, 352.2% for AGIs $75k-100k, 672.9% for AGIs $100k-200k, 5166.1% for AGIs over 200k)
Ordinary dividends: $22,863 (reported on 56.2% of returns)
Here:
$22,863
State:
$8,057
(% of AGI for various income ranges: 191.1% for AGIs below $25k, 400.7% for AGIs $25k-50k, 602.7% for AGIs $50k-75k, 1042.2% for AGIs $75k-100k, 1654.1% for AGIs $100k-200k, 13050.0% for AGIs over 200k)
Net capital gain/loss in AGI: +$61,163 (reported on 53.1% of returns)
Here:
+$61,163
State:
+$25,022
(% of AGI for various income ranges: 172.8% for AGIs below $25k, 312.9% for AGIs $25k-50k, 572.7% for AGIs $50k-75k, 542.2% for AGIs $75k-100k, 1790.6% for AGIs $100k-200k, 37707.2% for AGIs over 200k)
Profit/loss from business: +$45,058 (reported on 23.2% of returns)
Here:
+$45,058
State:
+$18,035
(% of AGI for various income ranges: 177.2% for AGIs below $25k, 365.0% for AGIs $25k-50k, 340.9% for AGIs $50k-75k, 880.0% for AGIs $75k-100k, 1654.1% for AGIs $100k-200k, 10345.0% for AGIs over 200k)
Taxable individual retirement arrangement distribution: $36,096 (reported on 11.2% of returns)
07627:
$36,096
New Jersey:
$21,558
(% of AGI for various income ranges: 128.3% for AGIs below $25k, 181.4% for AGIs $25k-50k, 305.5% for AGIs $50k-75k, 677.8% for AGIs $75k-100k, 1466.5% for AGIs $100k-200k, 2833.3% for AGIs over 200k)
Self-employed (Keogh) retirement plans: $44,230 (reported on 4.5% of returns)
07627:
$44,230
New Jersey:
$30,844
(% of AGI for various income ranges: 2457.2% for AGIs over 200k)
Total itemized deductions: $42,618 (reported on 32.1% of returns)
Here:
$42,618
State:
$32,863
(% of AGI for various income ranges: 277.2% for AGIs below $25k, 851.4% for AGIs $25k-50k, 904.5% for AGIs $50k-75k, 1598.9% for AGIs $75k-100k, 3168.2% for AGIs $100k-200k, 11763.3% for AGIs over 200k)
Charity contributions: $11,835 (reported on 29.0% of returns)
Here:
$11,835
State:
$7,880
(% of AGI for various income ranges: 69.3% for AGIs $25k-50k, 128.2% for AGIs $50k-75k, 97.8% for AGIs $75k-100k, 522.9% for AGIs $100k-200k, 3598.9% for AGIs over 200k)
Taxes paid: $9,686 (reported on 32.1% of returns)
07627:
$9,686
State:
$9,183
(% of AGI for various income ranges: 91.7% for AGIs below $25k, 255.0% for AGIs $25k-50k, 267.3% for AGIs $50k-75k, 494.4% for AGIs $75k-100k, 851.2% for AGIs $100k-200k, 2370.0% for AGIs over 200k)
Earned income credit: $1,675 (reported on 3.6% of returns)
Here:
$1,675
State:
$2,148
(% of AGI for various income ranges: 33.9% for AGIs below $25k, 52.1% for AGIs $25k-50k)
Percentage of individuals using paid preparers for their 2020 taxes: 92.9%
Here:
93%
State:
92%
(% for various income ranges: 91.1% for AGIs below $25k, 92.0% for AGIs $25k-50k, 90.0% for AGIs $50k-75k, 88.9% for AGIs $75k-100k, 93.2% for AGIs $100k-200k, 95.8% for AGIs over 200k)
Averages for the 2012 tax year for zip code 07627, filed in 2013:
Average Adjusted Gross Income (AGI) in 2012: $214,948 (Individual Income Tax Returns)
Here:
$214,948
State:
$79,688
Salary/wage: $168,617 (reported on 76.7% of returns)
Here:
$168,617
State:
$68,122
(% of AGI for various income ranges: 67.2% for AGIs below $25k, 69.6% for AGIs $25k-50k, 61.2% for AGIs $50k-75k, 59.5% for AGIs $75k-100k, 65.9% for AGIs $100k-200k, 58.7% for AGIs over 200k)
Taxable interest for individuals: $6,157 (reported on 61.7% of returns)
This zip code:
$6,157
New Jersey:
$2,193
(% of AGI for various income ranges: 4.9% for AGIs below $25k, 2.6% for AGIs $25k-50k, 2.8% for AGIs $50k-75k, 2.4% for AGIs $75k-100k, 1.5% for AGIs $100k-200k, 1.7% for AGIs over 200k)
Ordinary dividends: $17,841 (reported on 52.0% of returns)
Here:
$17,841
State:
$6,828
(% of AGI for various income ranges: 9.1% for AGIs below $25k, 5.1% for AGIs $25k-50k, 5.4% for AGIs $50k-75k, 3.2% for AGIs $75k-100k, 3.6% for AGIs $100k-200k, 4.4% for AGIs over 200k)
Net capital gain/loss in AGI: +$44,091 (reported on 43.6% of returns)
Here:
+$44,091
State:
+$15,358
(% of AGI for various income ranges: 0.4% for AGIs $50k-75k, 1.2% for AGIs $75k-100k, 2.0% for AGIs $100k-200k, 11.1% for AGIs over 200k)
Profit/loss from business: +$49,330 (reported on 23.3% of returns)
Here:
+$49,330
State:
+$19,577
(% of AGI for various income ranges: 12.7% for AGIs below $25k, 7.9% for AGIs $25k-50k, 3.1% for AGIs $50k-75k, 4.7% for AGIs $75k-100k, 7.9% for AGIs $100k-200k, 4.8% for AGIs over 200k)
Taxable individual retirement arrangement distribution: $35,694 (reported on 14.5% of returns)
07627:
$35,694
New Jersey:
$18,214
(% of AGI for various income ranges: 5.7% for AGIs below $25k, 4.2% for AGIs $25k-50k, 4.9% for AGIs $50k-75k, 5.7% for AGIs $75k-100k, 3.6% for AGIs $100k-200k, 1.9% for AGIs over 200k)
Self-employment retirement plans: $27,845 (reported on 4.8% of returns)
07627:
$27,845
New Jersey:
$24,511
Total itemized deductions: $63,744 (20% of AGI, reported on 63.9% of returns)
Here:
$63,744
State:
$30,827
Here:
19.9% of AGI
State:
21.2% of AGI
(% of AGI for various income ranges: 41.0% for AGIs below $25k, 27.6% for AGIs $25k-50k, 25.2% for AGIs $50k-75k, 27.9% for AGIs $75k-100k, 23.4% for AGIs $100k-200k, 17.0% for AGIs over 200k)
Charity contributions: $7,877 (reported on 54.6% of returns)
Here:
$7,877
State:
$3,451
(% of AGI for various income ranges: 1.7% for AGIs below $25k, 1.4% for AGIs $25k-50k, 1.7% for AGIs $50k-75k, 2.0% for AGIs $75k-100k, 2.0% for AGIs $100k-200k, 2.0% for AGIs over 200k)
Taxes paid: $40,331 (reported on 63.9% of returns)
07627:
$40,331
State:
$15,801
(% of AGI for various income ranges: 17.7% for AGIs below $25k, 12.5% for AGIs $25k-50k, 12.2% for AGIs $50k-75k, 13.6% for AGIs $75k-100k, 13.3% for AGIs $100k-200k, 11.6% for AGIs over 200k)
Earned income credit: $1,656 (reported on 4.0% of returns)
Here:
$1,656
State:
$2,182
(% of AGI for various income ranges: 2.0% for AGIs below $25k, 0.4% for AGIs $25k-50k)
Percentage of individuals using paid preparers for their 2012 taxes: 77.5%
Here:
78%
State:
65%
(% for various income ranges: 72.6% for AGIs below $25k, 74.1% for AGIs $25k-50k, 73.7% for AGIs $50k-75k, 76.5% for AGIs $75k-100k, 79.2% for AGIs $100k-200k, 85.2% for AGIs over 200k)
Averages for the 2004 tax year for zip code 07627, filed in 2005:
Average Adjusted Gross Income (AGI) in 2004: $165,803 (Individual Income Tax Returns)
Here:
$165,803
State:
$64,921
Salary/wage: $130,591 (reported on 72.6% of returns)
Here:
$130,591
State:
$57,755
(% of AGI for various income ranges: 47.9% for AGIs $10k-25k, 61.2% for AGIs $25k-50k, 59.8% for AGIs $50k-75k, 67.9% for AGIs $75k-100k, 55.9% for AGIs over 100k)
Taxable interest for individuals: $5,213 (reported on 76.9% of returns)
This zip code:
$5,213
New Jersey:
$2,068
(% of AGI for various income ranges: 8.1% for AGIs $10k-25k, 5.1% for AGIs $25k-50k, 3.5% for AGIs $50k-75k, 2.3% for AGIs $75k-100k, 2.1% for AGIs over 100k)
Taxable dividends: $9,100 (reported on 62.0% of returns)
Here:
$9,100
State:
$3,959
(% of AGI for various income ranges: 9.0% for AGIs $10k-25k, 4.9% for AGIs $25k-50k, 5.1% for AGIs $50k-75k, 2.5% for AGIs $75k-100k, 3.1% for AGIs over 100k)
Net capital gain/loss: +$42,533 (reported on 55.7% of returns)
Here:
+$42,533
State:
+$13,591
(% of AGI for various income ranges: -1.5% for AGIs $10k-25k, 1.7% for AGIs $25k-50k, 3.0% for AGIs $50k-75k, 1.5% for AGIs $75k-100k, 16.0% for AGIs over 100k)
Profit/loss from business: +$57,380 (reported on 21.1% of returns)
Here:
+$57,380
State:
+$17,520
(% of AGI for various income ranges: 12.3% for AGIs $10k-25k, 8.7% for AGIs $25k-50k, 6.5% for AGIs $50k-75k, 6.3% for AGIs $75k-100k, 7.2% for AGIs over 100k)
IRA payment deduction: $4,009 (reported on 5.1% of returns)
07627:
$4,009
New Jersey:
$3,270
(% of AGI for various income ranges: 0.6% for AGIs $25k-50k, 0.3% for AGIs $50k-75k, 0.4% for AGIs $75k-100k, 0.1% for AGIs over 100k)
Self-employed pension: $25,627 (reported on 4.9% of returns)
Here:
$25,627
New Jersey:
$17,258
Total itemized deductions: $44,690 (18% of AGI, reported on 64.7% of returns)
Here:
$44,690
State:
$23,924
Here:
18.1% of AGI
State:
21.1% of AGI
(% of AGI for various income ranges: 35.2% for AGIs $10k-25k, 36.6% for AGIs $25k-50k, 30.3% for AGIs $50k-75k, 27.7% for AGIs $75k-100k, 15.3% for AGIs over 100k)
Charity contributions deductions: $7,703 (3% of AGI, reported on 59.2% of returns)
Here:
$7,703
State:
$3,242
Here:
2.9% of AGI
State:
2.7% of AGI
(% of AGI for various income ranges: 3.0% for AGIs $10k-25k, 2.4% for AGIs $25k-50k, 3.0% for AGIs $50k-75k, 3.2% for AGIs $75k-100k, 2.7% for AGIs over 100k)
Total tax: $43,181 (reported on 80.6% of returns)
07627:
$43,181
State:
$12,321
(% of AGI for various income ranges: 5.2% for AGIs $10k-25k, 7.5% for AGIs $25k-50k, 8.9% for AGIs $50k-75k, 9.5% for AGIs $75k-100k, 22.6% for AGIs over 100k)
Earned income credit: $1,458 (reported on 3.2% of returns)
Here:
$1,458
State:
$1,711
Percentage of individuals using paid preparers for their 2004 taxes: 78.6%
Here:
79%
State:
65%
(% for various income ranges: 76.6% for AGIs below $10k, 77.1% for AGIs $10k-25k, 75.9% for AGIs $25k-50k, 78.2% for AGIs $50k-75k, 78.5% for AGIs $75k-100k, 81.2% for AGIs over 100k)
Household received Food Stamps/SNAP in the past 12 months: 0 Household did not receive Food Stamps/SNAP in the past 12 months: 1,707
Women who had a birth in the past 12 months: 9 (10 now married, 0 unmarried) Women who did not have a birth in the past 12 months: 801 (637 now married, 157 unmarried)
Housing units in zip code 07627 with a mortgage: 883 (160 second mortgage, 143 both second mortgage and home equity loan) Houses without a mortgage: 29
Median monthly owner costs for units with a mortgage: $3,744 Median monthly owner costs for units without a mortgage: $1,425
Residents with income below the poverty level in 2022:
This zip code:
0.5%
Whole state:
9.7%
Residents with income below 50% of the poverty level in 2022:
This zip code:
0.4%
Whole state:
5.2%
Median number of rooms in houses and condos:
Here:
8.4
State:
6.8
Median number of rooms in apartments:
Here:
5.2
State:
3.9
Notable locations in this zip code not listed on our city pages
Notable locations in zip code 07627: Demarest Station (A), Demarest Public Library (B), Demarest Ambulance Corps (C), Demarest Volunteer Fire Department (D), Demarest Boro Hall (E). Display/hide their locations on the map
In group quarters: 11 (-1 institutionalized population)
Size of family households: 634 2-persons, 248 3-persons, 451 4-persons, 149 5-persons, 21 6-persons
Size of nonfamily households: 192 1-person, 22 2-persons
1,234 married couples with children.
58 single-parent households (58 women).
56.6% of residents of 07627 zip code speak English at home.
2.7% of residents speak Spanish at home (67% very well, 27% well, 6% not well).
10.8% of residents speak other Indo-European language at home (71% very well, 20% well, 7% not well, 1% not at all).
20.8% of residents speak Asian or Pacific Island language at home (62% very well, 28% well, 10% not well).
9.1% of residents speak other language at home (75% very well, 25% well).
Foreign born population: 1,651 (33.5%) (62.4% of them are naturalized citizens)
This zip code:
33.5%
Whole state:
23.5%
26%Iraq
25%Japan
9%Taiwan
6%Bhutan
6%Dominica
4%India
3%Serbia
7%American
5%Italian
4%Eastern European
3%Irish
3%Armenian
3%German
2%Polish
Year of entry for the foreign-born population
5342010 or later
2802000 to 2009
3281990 to 1999
614Before 1990
Facilities with environmental interests located in this zip code:
NORTHERN VALLEY RGNL HIGH SD (150 KNICKERBOCKER ROAD in DEMAREST, NJ)
(National Center for Education Statistics) - STATE ID-050 STATE MASTER (New Jersey environmental info) - NJEMS-014648, STATE CLEANUP SITE, NJEMS-02210, AIR PROGRAM (Resource Conservation and Recovery Act (tracking hazardous waste)) Organizations: NORTHERN VALLEY REGIONAL (SCHOOL DISTRICT)
Alternative names: NORTHERN VALLEY REG H S DIST, NORTHERN VALLEY REGIONAL SCHOOL DISTRICT
NORTHERN VALLEY REGIONAL HIGH SCHOOL (162 KNICKERBOCKER RD in DEMAREST, NJ)
COMPLIANCE ACTIVITY (Tracking inspections of insecticide, fungicide, and rodenticide, and toxic substances) (Resource Conservation and Recovery Act (tracking hazardous waste)) Alternative names: NORTHERN VALLEY REG HS DISTRICT BD OF ED
91.7%Utility gas
6.6%Electricity
0.5%Wood
Population in 1990: 4,718. Population change in the 1990s: +127 (+2.7%).
Place of birth for U.S.-born residents:
This state: 1,519
Northeast: 1,499
Midwest: 92
South: 84
71% of the 07627 zip code residents lived in the same house 5 years ago. Out of people who lived in different houses, 73% lived in this county. Out of people who lived in different counties, 50% lived in New Jersey.
94% of the 07627 zip code residents lived in the same house 1 year ago. Out of people who lived in different houses, 52% moved from this county. Out of people who lived in different houses, 26% moved from different state. Out of people who lived in different houses, 30% moved from abroad.
Private vs. public school enrollment:
Students in private schools in grades 1 to 8 (elementary and middle school): 52
Here:
7.1%
New Jersey:
12.3%
Students in private schools in grades 9 to 12 (high school): 19
Here:
10.6%
New Jersey:
13.1%
Students in private undergraduate colleges: 61
Here:
37.2%
New Jersey:
33.2%
Occupation by median earnings in the past 12 months ($)
239,704Management occupations
180,260Legal occupations
139,572Computer and mathematical occupations
137,900Health diagnosing and treating practitioners and other technical occupations
115,612Business and financial operations occupations
74,031Sales and related occupations
Top industries in this zip code by the number of employees in 2005:
Educational Services: Elementary and Secondary Schools (50-99 employees: 1 establishment)
Administrative and Support and Waste Management and Remediation Services: Security Guards and Patrol Services (50-99: 1)
Educational Services: Fine Arts Schools (20-49: 1, 1-4: 1)
Arts, Entertainment, and Recreation: Golf Courses and Country Clubs (20-49: 1)
Health Care and Social Assistance: Offices of Physicians (except Mental Health Specialists) (10-19: 1, 1-4: 3)
Accommodation and Food Services: Food Service Contractors (10-19: 1, 1-4: 1)
Health Care and Social Assistance: Child Day Care Services (10-19: 1, 1-4: 1)
Construction: Poured Concrete Foundation and Structure Contractors (10-19: 1)
Construction: Commercial and Institutional Building Construction (10-19: 1)
Other Services (except Public Administration): Religious Organizations (5-9: 1, 1-4: 4)
People in group quarters in 2010:
6 people in other noninstitutional facilities
People in group quarters in 2000:
8 people in religious group quarters
6 people in other workers' dormitories
2 people in other nonhousehold living situations
Home Mortgage Disclosure Act Aggregated Statistics For Year 2009 (Based on 2 full tracts)
A) FHA, FSA/RHS & VA Home Purchase Loans
B) Conventional Home Purchase Loans
C) Refinancings
D) Home Improvement Loans
F) Non-occupant Loans on < 5 Family Dwellings (A B C & D)
Number
Average Value
Number
Average Value
Number
Average Value
Number
Average Value
Number
Average Value
LOANS ORIGINATED
2
$442,800
102
$569,419
297
$461,458
6
$286,558
6
$449,782
APPLICATIONS APPROVED, NOT ACCEPTED
0
$0
8
$567,712
34
$525,284
0
$0
0
$0
APPLICATIONS DENIED
2
$484,690
4
$706,588
84
$443,751
0
$0
4
$512,612
APPLICATIONS WITHDRAWN
0
$0
6
$412,217
40
$423,304
4
$532,060
2
$648,245
FILES CLOSED FOR INCOMPLETENESS
0
$0
4
$358,030
12
$412,383
2
$149,595
0
$0
Aggregated Statistics For Year 2008 (Based on 2 full tracts)
A) FHA, FSA/RHS & VA Home Purchase Loans
B) Conventional Home Purchase Loans
C) Refinancings
D) Home Improvement Loans
F) Non-occupant Loans on < 5 Family Dwellings (A B C & D)
Number
Average Value
Number
Average Value
Number
Average Value
Number
Average Value
Number
Average Value
LOANS ORIGINATED
0
$0
116
$712,485
120
$422,639
8
$151,590
6
$686,475
APPLICATIONS APPROVED, NOT ACCEPTED
0
$0
16
$549,138
22
$444,070
8
$521,838
0
$0
APPLICATIONS DENIED
4
$503,138
34
$586,647
40
$618,326
6
$58,177
10
$702,099
APPLICATIONS WITHDRAWN
2
$519,595
28
$443,799
34
$580,487
0
$0
0
$0
FILES CLOSED FOR INCOMPLETENESS
0
$0
6
$541,867
10
$359,227
0
$0
0
$0
Aggregated Statistics For Year 2007 (Based on 2 full tracts)
B) Conventional Home Purchase Loans
C) Refinancings
D) Home Improvement Loans
F) Non-occupant Loans on < 5 Family Dwellings (A B C & D)
Number
Average Value
Number
Average Value
Number
Average Value
Number
Average Value
LOANS ORIGINATED
134
$655,851
185
$522,370
36
$378,974
14
$633,856
APPLICATIONS APPROVED, NOT ACCEPTED
10
$708,482
42
$448,595
10
$148,598
4
$832,745
APPLICATIONS DENIED
32
$728,465
56
$545,951
12
$81,280
8
$1,100,271
APPLICATIONS WITHDRAWN
12
$798,505
30
$487,879
2
$96,740
6
$738,002
FILES CLOSED FOR INCOMPLETENESS
4
$851,195
8
$534,552
0
$0
0
$0
Aggregated Statistics For Year 2006 (Based on 2 full tracts)
B) Conventional Home Purchase Loans
C) Refinancings
D) Home Improvement Loans
F) Non-occupant Loans on < 5 Family Dwellings (A B C & D)
Number
Average Value
Number
Average Value
Number
Average Value
Number
Average Value
LOANS ORIGINATED
114
$679,249
180
$489,264
34
$195,647
20
$958,904
APPLICATIONS APPROVED, NOT ACCEPTED
28
$626,091
32
$462,747
16
$317,266
2
$149,595
APPLICATIONS DENIED
24
$853,356
62
$532,912
20
$248,128
4
$1,059,632
APPLICATIONS WITHDRAWN
20
$566,965
60
$513,377
4
$313,650
2
$289,215
FILES CLOSED FOR INCOMPLETENESS
2
$598,380
26
$589,097
0
$0
0
$0
Aggregated Statistics For Year 2005 (Based on 2 full tracts)
B) Conventional Home Purchase Loans
C) Refinancings
D) Home Improvement Loans
F) Non-occupant Loans on < 5 Family Dwellings (A B C & D)
Number
Average Value
Number
Average Value
Number
Average Value
Number
Average Value
LOANS ORIGINATED
166
$561,744
237
$433,779
34
$338,554
26
$430,373
APPLICATIONS APPROVED, NOT ACCEPTED
14
$576,439
34
$386,542
12
$105,714
2
$573,450
APPLICATIONS DENIED
24
$626,969
54
$501,051
32
$175,213
6
$423,853
APPLICATIONS WITHDRAWN
14
$519,736
42
$505,489
4
$1,296,490
10
$435,621
FILES CLOSED FOR INCOMPLETENESS
4
$867,152
38
$525,734
4
$147,102
0
$0
Aggregated Statistics For Year 2004 (Based on 2 full tracts)
B) Conventional Home Purchase Loans
C) Refinancings
D) Home Improvement Loans
E) Loans on Dwellings For 5+ Families
F) Non-occupant Loans on < 5 Family Dwellings (A B C & D)
Number
Average Value
Number
Average Value
Number
Average Value
Number
Average Value
Number
Average Value
LOANS ORIGINATED
184
$539,019
227
$351,454
50
$146,085
2
$74,800
16
$361,148
APPLICATIONS APPROVED, NOT ACCEPTED
22
$605,905
28
$392,010
8
$141,866
0
$0
0
$0
APPLICATIONS DENIED
28
$518,311
38
$351,784
12
$157,906
0
$0
2
$1,198,755
APPLICATIONS WITHDRAWN
18
$436,042
32
$387,700
2
$199,460
0
$0
0
$0
FILES CLOSED FOR INCOMPLETENESS
2
$536,545
12
$448,951
2
$19,945
0
$0
0
$0
Aggregated Statistics For Year 2003 (Based on 2 full tracts)
B) Conventional Home Purchase Loans
C) Refinancings
D) Home Improvement Loans
F) Non-occupant Loans on < 5 Family Dwellings (A B C & D)
Number
Average Value
Number
Average Value
Number
Average Value
Number
Average Value
LOANS ORIGINATED
138
$401,406
746
$301,538
24
$182,506
6
$269,272
APPLICATIONS APPROVED, NOT ACCEPTED
18
$390,055
120
$288,569
8
$170,289
0
$0
APPLICATIONS DENIED
12
$348,889
140
$342,758
12
$110,036
6
$245,668
APPLICATIONS WITHDRAWN
16
$436,319
82
$349,590
0
$0
4
$249,325
FILES CLOSED FOR INCOMPLETENESS
4
$269,770
30
$384,492
2
$99,730
2
$216,415
Aggregated Statistics For Year 2002 (Based on 2 full tracts)
B) Conventional Home Purchase Loans
C) Refinancings
D) Home Improvement Loans
F) Non-occupant Loans on < 5 Family Dwellings (A B C & D)
Number
Average Value
Number
Average Value
Number
Average Value
Number
Average Value
LOANS ORIGINATED
116
$429,441
551
$293,195
54
$98,068
6
$317,473
APPLICATIONS APPROVED, NOT ACCEPTED
20
$399,020
84
$227,551
10
$76,393
4
$277,748
APPLICATIONS DENIED
8
$332,101
92
$309,423
18
$108,262
0
$0
APPLICATIONS WITHDRAWN
14
$289,217
66
$291,453
2
$199,460
0
$0
FILES CLOSED FOR INCOMPLETENESS
12
$416,539
24
$430,750
2
$74,800
2
$299,190
Aggregated Statistics For Year 2001 (Based on 2 full tracts)
B) Conventional Home Purchase Loans
C) Refinancings
D) Home Improvement Loans
F) Non-occupant Loans on < 5 Family Dwellings (A B C & D)
Number
Average Value
Number
Average Value
Number
Average Value
Number
Average Value
LOANS ORIGINATED
152
$341,969
249
$294,336
32
$107,023
6
$300,852
APPLICATIONS APPROVED, NOT ACCEPTED
16
$390,942
30
$284,231
6
$28,257
0
$0
APPLICATIONS DENIED
14
$356,749
66
$251,984
14
$54,139
0
$0
APPLICATIONS WITHDRAWN
4
$488,678
38
$168,334
2
$79,785
0
$0
FILES CLOSED FOR INCOMPLETENESS
4
$350,550
16
$231,748
2
$398,920
0
$0
Aggregated Statistics For Year 2000 (Based on 2 full tracts)
A) FHA, FSA/RHS & VA Home Purchase Loans
B) Conventional Home Purchase Loans
C) Refinancings
D) Home Improvement Loans
F) Non-occupant Loans on < 5 Family Dwellings (A B C & D)
Number
Average Value
Number
Average Value
Number
Average Value
Number
Average Value
Number
Average Value
LOANS ORIGINATED
4
$197,965
152
$345,919
50
$237,956
34
$43,999
2
$215,415
APPLICATIONS APPROVED, NOT ACCEPTED
0
$0
14
$342,929
22
$143,067
8
$43,382
0
$0
APPLICATIONS DENIED
0
$0
14
$190,199
26
$181,278
10
$93,746
2
$39,890
APPLICATIONS WITHDRAWN
0
$0
12
$370,164
14
$171,678
10
$97,336
0
$0
FILES CLOSED FOR INCOMPLETENESS
0
$0
6
$534,220
10
$254,511
0
$0
0
$0
Aggregated Statistics For Year 1999 (Based on 1 full tract)
B) Conventional Home Purchase Loans
C) Refinancings
D) Home Improvement Loans
F) Non-occupant Loans on < 5 Family Dwellings (A B C & D)
Detailed PMIC statistics for the following Tracts:0091.00
2002 - 2018 National Fire Incident Reporting System (NFIRS) incidents
According to the data from the years 2002 - 2018 the average number of fire incidents per year is 13. The highest number of reported fires - 25 took place in 2018, and the least - 1 in 2002. The data has a rising trend.
When looking into fire subcategories, the most incidents belonged to: Structure Fires (67.4%), and Outside Fires (18.6%).
Fire incident types reported to NFIRS in Zip Code 07627


 Nearest zip codes: 07626, 07624, 07670, 07628, 07648, 07641.


 According to the data from the years 2002 - 2018 the average number of fire incidents per year is 13. The highest number of reported fires - 25 took place in 2018, and the least - 1 in 2002. The data has a rising trend.
 When looking into fire subcategories, the most incidents belonged to: Structure Fires (67.4%), and Outside Fires (18.6%).