Estimated zip code population in 2022: 3,568 Zip code population in 2010: 3,244 Zip code population in 2000: 3,248
Houses and condos: 2,033 Renter-occupied apartments: 917
% of renters here:
48%
State:
35%
March 2022 cost of living index in zip code 07857: 112.4 (more than average, U.S. average is 100)
Land area: 1.1 sq. mi. Water area: 0.1 sq. mi.
Population density: 3,281 people per square mile
(average).
OSM Map
Google Map
MSN Map
OSM Map
General Map
Google Map
MSN Map
OSM Map
Google Map
MSN Map
OSM Map
Google Map
MSN Map
Please wait while loading the map...
Real estate property taxes paid for housing units in 2022:
This zip code:
2.4% ($8,603)
New Jersey:
2.1% ($8,897)
Median real estate property taxes paid for housing units with mortgages in 2022: $8,554 (2.4%) Median real estate property taxes paid for housing units with no mortgage in 2022: $9,029 (2.7%)
Averages for the 2020 tax year for zip code 07857, filed in 2021:
Average Adjusted Gross Income (AGI) in 2020: $61,261 (Individual Income Tax Returns)
Here:
$61,261
State:
$95,247
Salary/wage: $53,424 (reported on 84.3% of returns)
Here:
$53,424
State:
$80,635
(% of AGI for various income ranges: 1372.9% for AGIs below $25k, 3678.9% for AGIs $25k-50k, 6801.7% for AGIs $50k-75k, 10087.9% for AGIs $75k-100k, 16367.1% for AGIs $100k-200k)
Taxable interest for individuals: $1,026 (reported on 27.0% of returns)
This zip code:
$1,026
New Jersey:
$2,414
(% of AGI for various income ranges: 10.9% for AGIs below $25k, 6.4% for AGIs $25k-50k, 30.9% for AGIs $50k-75k, 38.6% for AGIs $75k-100k, 141.2% for AGIs $100k-200k)
Ordinary dividends: $3,109 (reported on 18.4% of returns)
Here:
$3,109
State:
$8,057
(% of AGI for various income ranges: 32.4% for AGIs below $25k, 37.8% for AGIs $25k-50k, 44.3% for AGIs $50k-75k, 47.1% for AGIs $75k-100k, 378.2% for AGIs $100k-200k)
Net capital gain/loss in AGI: +$5,334 (reported on 15.7% of returns)
Here:
+$5,334
State:
+$25,022
(% of AGI for various income ranges: 15.9% for AGIs below $25k, 47.8% for AGIs $25k-50k, 49.1% for AGIs $50k-75k, 28.6% for AGIs $75k-100k, 270.6% for AGIs $100k-200k)
Profit/loss from business: +$10,658 (reported on 13.0% of returns)
Here:
+$10,658
State:
+$18,035
(% of AGI for various income ranges: 107.4% for AGIs below $25k, 184.4% for AGIs $25k-50k, 147.4% for AGIs $50k-75k, 47.1% for AGIs $75k-100k, 661.2% for AGIs $100k-200k)
Taxable individual retirement arrangement distribution: $13,812 (reported on 8.6% of returns)
07857:
$13,812
New Jersey:
$21,558
(% of AGI for various income ranges: 56.8% for AGIs below $25k, 51.1% for AGIs $25k-50k, 149.6% for AGIs $50k-75k, 130.0% for AGIs $75k-100k, 768.8% for AGIs $100k-200k)
Total itemized deductions: $25,967 (reported on 8.1% of returns)
Here:
$25,967
State:
$32,863
(% of AGI for various income ranges: 215.6% for AGIs $25k-50k, 290.9% for AGIs $50k-75k, 572.9% for AGIs $75k-100k, 969.4% for AGIs $100k-200k)
Charity contributions: $2,842 (reported on 6.5% of returns)
Here:
$2,842
State:
$7,880
(% of AGI for various income ranges: 15.3% for AGIs below $25k, 35.7% for AGIs $50k-75k, 72.9% for AGIs $75k-100k, 61.8% for AGIs $100k-200k)
Taxes paid: $9,187 (reported on 8.1% of returns)
07857:
$9,187
State:
$9,183
(% of AGI for various income ranges: 79.7% for AGIs $25k-50k, 123.9% for AGIs $50k-75k, 230.0% for AGIs $75k-100k, 284.7% for AGIs $100k-200k)
Earned income credit: $1,911 (reported on 9.7% of returns)
Here:
$1,911
State:
$2,148
(% of AGI for various income ranges: 53.2% for AGIs below $25k, 45.3% for AGIs $25k-50k)
Percentage of individuals using paid preparers for their 2020 taxes: 92.4%
Here:
92%
State:
92%
(% for various income ranges: 90.6% for AGIs below $25k, 93.8% for AGIs $25k-50k, 90.9% for AGIs $50k-75k, 95.0% for AGIs $75k-100k, 92.6% for AGIs $100k-200k, 100.0% for AGIs over 200k)
Averages for the 2012 tax year for zip code 07857, filed in 2013:
Average Adjusted Gross Income (AGI) in 2012: $48,435 (Individual Income Tax Returns)
Here:
$48,435
State:
$79,688
Salary/wage: $44,942 (reported on 81.9% of returns)
Here:
$44,942
State:
$68,122
(% of AGI for various income ranges: 70.7% for AGIs below $25k, 77.9% for AGIs $25k-50k, 77.4% for AGIs $50k-75k, 75.0% for AGIs $75k-100k, 76.0% for AGIs $100k-200k)
Taxable interest for individuals: $944 (reported on 32.2% of returns)
This zip code:
$944
New Jersey:
$2,193
(% of AGI for various income ranges: 1.0% for AGIs below $25k, 0.3% for AGIs $25k-50k, 0.7% for AGIs $50k-75k, 1.1% for AGIs $75k-100k, 0.4% for AGIs $100k-200k)
Ordinary dividends: $2,466 (reported on 20.5% of returns)
Here:
$2,466
State:
$6,828
(% of AGI for various income ranges: 1.0% for AGIs below $25k, 1.6% for AGIs $25k-50k, 0.5% for AGIs $50k-75k, 1.4% for AGIs $75k-100k, 0.9% for AGIs $100k-200k)
Profit/loss from business: +$9,979 (reported on 11.1% of returns)
Here:
+$9,979
State:
+$19,577
(% of AGI for various income ranges: 6.3% for AGIs below $25k, 2.7% for AGIs $25k-50k, 3.5% for AGIs $50k-75k, 1.3% for AGIs $100k-200k)
Taxable individual retirement arrangement distribution: $9,405 (reported on 11.1% of returns)
07857:
$9,405
New Jersey:
$18,214
(% of AGI for various income ranges: 2.8% for AGIs below $25k, 2.4% for AGIs $25k-50k, 2.3% for AGIs $50k-75k, 2.5% for AGIs $75k-100k, 1.6% for AGIs $100k-200k)
Total itemized deductions: $19,998 (24% of AGI, reported on 33.3% of returns)
Here:
$19,998
State:
$30,827
Here:
24.3% of AGI
State:
21.2% of AGI
(% of AGI for various income ranges: 10.7% for AGIs below $25k, 9.8% for AGIs $25k-50k, 12.3% for AGIs $50k-75k, 17.5% for AGIs $75k-100k, 16.0% for AGIs $100k-200k)
Charity contributions: $1,788 (reported on 28.7% of returns)
Here:
$1,788
State:
$3,451
(% of AGI for various income ranges: 0.6% for AGIs below $25k, 0.8% for AGIs $25k-50k, 1.1% for AGIs $50k-75k, 1.6% for AGIs $75k-100k, 1.1% for AGIs $100k-200k)
Taxes paid: $9,054 (reported on 33.3% of returns)
07857:
$9,054
State:
$15,801
(% of AGI for various income ranges: 4.1% for AGIs below $25k, 3.5% for AGIs $25k-50k, 5.2% for AGIs $50k-75k, 7.6% for AGIs $75k-100k, 8.4% for AGIs $100k-200k)
Earned income credit: $1,935 (reported on 11.7% of returns)
Here:
$1,935
State:
$2,182
(% of AGI for various income ranges: 3.7% for AGIs below $25k, 0.5% for AGIs $25k-50k)
Percentage of individuals using paid preparers for their 2012 taxes: 57.9%
Here:
58%
State:
65%
(% for various income ranges: 55.6% for AGIs below $25k, 56.5% for AGIs $25k-50k, 50.0% for AGIs $50k-75k, 68.8% for AGIs $75k-100k, 70.0% for AGIs $100k-200k)
Averages for the 2004 tax year for zip code 07857, filed in 2005:
Average Adjusted Gross Income (AGI) in 2004: $43,401 (Individual Income Tax Returns)
Here:
$43,401
State:
$64,921
Salary/wage: $41,372 (reported on 85.2% of returns)
Here:
$41,372
State:
$57,755
(% of AGI for various income ranges: 79.0% for AGIs below $10k, 70.2% for AGIs $10k-25k, 84.8% for AGIs $25k-50k, 82.9% for AGIs $50k-75k, 85.0% for AGIs $75k-100k, 77.1% for AGIs over 100k)
Taxable interest for individuals: $1,515 (reported on 49.2% of returns)
This zip code:
$1,515
New Jersey:
$2,068
(% of AGI for various income ranges: 4.8% for AGIs below $10k, 1.8% for AGIs $10k-25k, 1.3% for AGIs $25k-50k, 1.5% for AGIs $50k-75k, 0.9% for AGIs $75k-100k, 2.7% for AGIs over 100k)
Taxable dividends: $1,388 (reported on 25.0% of returns)
Here:
$1,388
State:
$3,959
(% of AGI for various income ranges: 2.6% for AGIs below $10k, 1.2% for AGIs $10k-25k, 0.8% for AGIs $25k-50k, 0.6% for AGIs $50k-75k, 0.7% for AGIs $75k-100k, 0.8% for AGIs over 100k)
Net capital gain/loss: +$1,694 (reported on 15.0% of returns)
Here:
+$1,694
State:
+$13,591
(% of AGI for various income ranges: -2.9% for AGIs below $10k, 0.5% for AGIs $10k-25k, 0.3% for AGIs $25k-50k, 0.1% for AGIs $50k-75k, 0.7% for AGIs $75k-100k, 1.6% for AGIs over 100k)
Profit/loss from business: +$5,969 (reported on 9.5% of returns)
Here:
+$5,969
State:
+$17,520
(% of AGI for various income ranges: 8.9% for AGIs below $10k, 5.3% for AGIs $10k-25k, 2.4% for AGIs $25k-50k, -0.1% for AGIs $50k-75k, 0.8% for AGIs $75k-100k, 0.1% for AGIs over 100k)
IRA payment deduction: $2,667 (reported on 2.1% of returns)
07857:
$2,667
New Jersey:
$3,270
Total itemized deductions: $16,559 (24% of AGI, reported on 36.1% of returns)
Here:
$16,559
State:
$23,924
Here:
23.7% of AGI
State:
21.1% of AGI
(% of AGI for various income ranges: 20.0% for AGIs below $10k, 10.1% for AGIs $10k-25k, 10.8% for AGIs $25k-50k, 15.6% for AGIs $50k-75k, 16.2% for AGIs $75k-100k, 14.0% for AGIs over 100k)
Charity contributions deductions: $1,838 (3% of AGI, reported on 32.3% of returns)
Here:
$1,838
State:
$3,242
Here:
2.5% of AGI
State:
2.7% of AGI
(% of AGI for various income ranges: 1.1% for AGIs below $10k, 0.9% for AGIs $10k-25k, 1.0% for AGIs $25k-50k, 1.6% for AGIs $50k-75k, 1.4% for AGIs $75k-100k, 1.6% for AGIs over 100k)
Total tax: $5,576 (reported on 81.0% of returns)
07857:
$5,576
State:
$12,321
(% of AGI for various income ranges: 2.6% for AGIs below $10k, 5.0% for AGIs $10k-25k, 8.1% for AGIs $25k-50k, 9.5% for AGIs $50k-75k, 10.6% for AGIs $75k-100k, 15.9% for AGIs over 100k)
Earned income credit: $1,304 (reported on 8.2% of returns)
Here:
$1,304
State:
$1,711
Percentage of individuals using paid preparers for their 2004 taxes: 59.2%
Here:
59%
State:
65%
(% for various income ranges: 51.8% for AGIs below $10k, 59.9% for AGIs $10k-25k, 54.7% for AGIs $25k-50k, 63.9% for AGIs $50k-75k, 65.8% for AGIs $75k-100k, 71.9% for AGIs over 100k)
Household received Food Stamps/SNAP in the past 12 months: 195 Household did not receive Food Stamps/SNAP in the past 12 months: 1,743
Women who had a birth in the past 12 months: 58 (40 now married, 17 unmarried) Women who did not have a birth in the past 12 months: 647 (301 now married, 345 unmarried)
Housing units in zip code 07857 with a mortgage: 804 (30 second mortgage, 20 both second mortgage and home equity loan) Houses without a mortgage: 14
Median monthly owner costs for units with a mortgage: $2,487 Median monthly owner costs for units without a mortgage: $1,225
Residents with income below the poverty level in 2022:
This zip code:
9.3%
Whole state:
9.7%
Residents with income below 50% of the poverty level in 2022:
This zip code:
6.9%
Whole state:
5.2%
Median number of rooms in houses and condos:
Here:
6.4
State:
6.8
Median number of rooms in apartments:
Here:
3.1
State:
3.9
Notable locations in this zip code not listed on our city pages
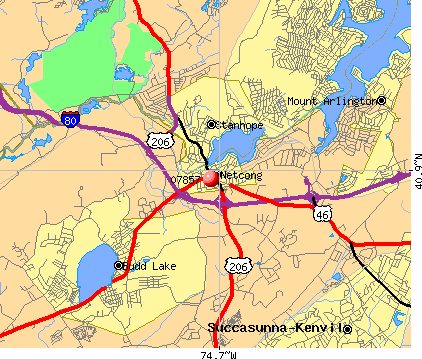
Notable locations in zip code 07857: Netcong Circle (A), Atlantic Air Ambulance (B), Netcong Fire Department Company 1 (C), Netcong Fire Department Hilltop Fire Company 2 (D). Display/hide their locations on the map
In group quarters: 4 (-1 institutionalized population)
Size of family households: 572 2-persons, 223 3-persons, 104 4-persons, 39 5-persons, 11 6-persons
Size of nonfamily households: 832 1-person, 158 2-persons, 9 3-persons
361 married couples with children.
165 single-parent households (35 men, 130 women).
80.2% of residents of 07857 zip code speak English at home.
12.8% of residents speak Spanish at home (63% very well, 24% not well, 13% not at all).
2.9% of residents speak other Indo-European language at home (67% very well, 33% well).
1.8% of residents speak Asian or Pacific Island language at home (100% very well).
2.0% of residents speak other language at home (75% very well, 25% well).
Foreign born population: 634 (17.8%) (34.1% of them are naturalized citizens)
This zip code:
17.8%
Whole state:
23.5%
26%El Salvador
13%Colombia
12%Guatemala
8%Bhutan
7%Belize
6%Haiti
5%Czechoslovakia (includes Czech Republic and Slovakia)
16%Italian
11%German
5%Irish
4%Jamaican
4%Polish
3%American
2%Hungarian
Year of entry for the foreign-born population
1732010 or later
1452000 to 2009
2511990 to 1999
125Before 1990
Major facilities with environmental interests located in this zip code:
NETCONG BORO BD OF ED PUBLIC SCHOOL (26 COLLEGE RD in NETCONG, NJ)
COMPLIANCE ACTIVITY (Tracking inspections of insecticide, fungicide, and rodenticide, and toxic substances) (National Center for Education Statistics) - STATE ID-060 STATE MASTER (New Jersey environmental info) - NJEMS-021480, STATE CLEANUP SITE, NJEMS-25907, AIR PROGRAM Alternative names: NETCONG BD OF ED, NETCONG ELEMENTARY SCHOOL, NETCONG PUBLIC SCHOOL DISTRICT
NETCONG BORO DPW (23 MAPLE AVE in NETCONG BORO, NJ)
STATE MASTER (New Jersey environmental info) - NJEMS-1428001, DRINKING WATER PROGRAM, NJEMS-197989, National Pollutant Discharge Elimination System Permit, NJEMS-205731, REFUSE DISPOSAL, NJEMS-5061, DRINKING WATER PROGRAM National Pollutant Discharge Elimination System NON-MAJOR (Tracking pollutant discharge elimination systems) - permit
NJDOT NETCONG YARD & GARAGE MM 0.2 N (ROUTE 183 MILE POST 0.2 in NETCONG, NJ)
STATE MASTER (New Jersey environmental info) - NJEMS-012702, STATE CLEANUP SITE, NJEMS-H2537, AIR PROGRAM HAZARDOUS WASTE BIENNIAL REPORTER (Resource Conservation and Recovery Act (tracking hazardous waste)) Large Quantity Generators, more that 1000 kg of hazardous waste/month (Resource Conservation and Recovery Act (tracking hazardous waste)) Business SIC classification: GASOLINE SERVICE STATIONS Organizations: NJDOT BUREAU OF FACILITIES PLNG & ENG, TIMOTHY STEINBEISER (CONTACT/OPERATOR)
, STATE OF NJ (CONTACT/OWNER)
, NJDOT BUREAU OF FACILITIES PLNG & ENG (CONTACT/OWNER)
Alternative names: NETCONG MAINTENANCE FACILITY, NJDOT NETCONG YARD MM 0.2 N, NJDOT YARD - NETCONG
GREAT NORTHERN TRUCK LINES INC (69 LOVE LN in NETCONG, NJ)
STATE MASTER (New Jersey environmental info) - NJEMS-001307, STATE CLEANUP SITE, NJEMS-198720, REFUSE DISPOSAL, NJEMS-49121, National Pollutant Discharge Elimination System Permit National Pollutant Discharge Elimination System NON-MAJOR (Tracking pollutant discharge elimination systems) - permit Organizations: PRUDEN TIMOTHY, TIMOTHY PRUDEN (CONTACT/OPERATOR)
, PRUDEN TIMOTHY (CONTACT/OWNER)
ALLIED CONCRETE CO (397 ALLEN ST in NETCONG, NJ)
STATE MASTER (New Jersey environmental info) - NJEMS-25610, AIR PROGRAM, NJEMS-48840, National Pollutant Discharge Elimination System Permit National Pollutant Discharge Elimination System NON-MAJOR (Tracking pollutant discharge elimination systems) - permit Business SIC classification: CONCRETE PRODUCTS, EXCEPT BLOCK AND BRICK Organizations: ALLIED CONCRETE CO INC, GALLO BROS CO INC (CONTACT/OWNER)
, GALLO BROTHERS CO INC (CONTACT/OWNER)
NETCONG TANK INC (80 STOLL ST in NETCONG BORO, NJ)
STATE MASTER (New Jersey environmental info) - NJEMS-26379, AIR PROGRAM, NJEMS-38101800000, EPCRA National Pollutant Discharge Elimination System NON-MAJOR (Tracking pollutant discharge elimination systems) - permit Business SIC classification: FABRICATED PLATE WORK (BOILER SHOPS); SHEET METALWORK; METALS SERVICE CENTERS AND OFFICES Organizations: WELDFAB LLC (CONTACT/OPERATOR)
, ANTHONY ARBOLINO (CONTACT/OWNER)
AUTO REFINISHERS OF NJ INC (5 ALLEN ST in NETCONG, NJ)
STATE MASTER (New Jersey environmental info) - NJEMS-025939, STATE CLEANUP SITE, NJEMS-50333100000, EPCRA, NJEMS-G2575, AIR PROGRAM (Resource Conservation and Recovery Act (tracking hazardous waste)) Business SIC classification: TOP, BODY, AND UPHOLSTERY REPAIR SHOPS AND PAINT SHOPS Organizations: ADAMS ASSOCIATES INC (CONTACT/OWNER)
B&S EXXON SERVICE STATION (RT 80 & RT 206 in NETCONG, NJ)
STATE MASTER (New Jersey environmental info) - NJEMS-007840, STATE CLEANUP SITE (Resource Conservation and Recovery Act (tracking hazardous waste)) Organizations: EXXON MOBIL CORP USA (CONTACT/OWNER)
Alternative names: EXXON CO USA-NETCONG
ALL CAR TRANSMISSIONS INC (148 RTE 46 W in NETCONG, NJ)
STATE MASTER (New Jersey environmental info) - NJEMS-80047900000, EPCRA (Resource Conservation and Recovery Act (tracking hazardous waste)) Business SIC classification: AUTOMOTIVE TRANSMISSION REPAIR SHOPS Alternative names: ALL CAR TRANSMISSIONS II
AMPLITRONICS INC (23 RAILROAD AVE in NETCONG, NJ)
STATE MASTER (New Jersey environmental info) - NJEMS-G000002883, STATE CLEANUP SITE (Resource Conservation and Recovery Act (tracking hazardous waste))
FAMILY FORD INC ANNEX BUILDING (ROUTE 183 SOUTH in NETCONG, NJ)
STATE MASTER (New Jersey environmental info) - NJEMS-007657, STATE CLEANUP SITE (Resource Conservation and Recovery Act (tracking hazardous waste))
A & S FUEL CO INC (14 FLANDERS RD in NETCONG, NJ)
(Resource Conservation and Recovery Act (tracking hazardous waste)) Organizations: WILLIAM J TORIELLO (CONTACT/OWNER)
Alternative names: CONNELL'S FUEL OIL T/A CONTEX
NJ BELL TELEPHONE CO (OLD LEDGEWOOD RD in NETCONG, NJ)
63% of the 07857 zip code residents lived in the same house 5 years ago. Out of people who lived in different houses, 57% lived in this county. Out of people who lived in different counties, 50% lived in New Jersey.
92% of the 07857 zip code residents lived in the same house 1 year ago. Out of people who lived in different houses, 50% moved from this county. Out of people who lived in different houses, 21% moved from different county within same state. Out of people who lived in different houses, 28% moved from different state.
Private vs. public school enrollment:
Students in private schools in grades 1 to 8 (elementary and middle school): 35
Here:
19.4%
New Jersey:
12.3%
Students in private schools in grades 9 to 12 (high school): 20
Here:
16.3%
New Jersey:
13.1%
Students in private undergraduate colleges: 1
Here:
1.0%
New Jersey:
33.2%
Occupation by median earnings in the past 12 months ($)
168,324Business and financial operations occupations
108,113Sales and related occupations
95,634Education, training, and library occupations
92,718Health diagnosing and treating practitioners and other technical occupations
80,063Architecture and engineering occupations
79,682Material moving occupations
Companies with federal contracts located in this zip code:
MCGREARY, JAMES H (16 UNION ST in NETCONG, NJ; small business) : $133,439 in 2 contractsin 2004
$72,052 with Defense Logistics Agency for Switches. Signed on 2004-01-23. Completion date: 2004-05-19.
$61,387, same as above.Signed on 2004-01-28. Completion date: 2004-05-18.
CLOVER INDUSTRIES (16 UNION ST in NETCONG, NJ; small business)
$27,629 with Defense Logistics Agency for Electric Vehicular Lights and Fixtures. Signed on 2004-02-23. Completion date: 2004-06-08.
WEB NOTIONS (35 LOVE LN in NETCONG, NJ; small business) : $0 in 2 contractsin 2005
$2,656 with Air Force for Books and Pamphlets. Signed on 2005-04-12. Completion date: 2005-04-28.
-$2,656, same as above.Signed on 2005-04-22. Completion date: 2005-04-28.
Top industries in this zip code by the number of employees in 2005:
Other Services (except Public Administration): General Automotive Repair (50-99 employees: 1 establishment, 10-19 employees: 1 establishment, 1-4 employees: 2 establishments)
Educational Services: Elementary and Secondary Schools (50-99: 1)
Accommodation and Food Services: Full-Service Restaurants (10-19: 2, 1-4: 2)
Health Care and Social Assistance: Other Individual and Family Services (20-49: 1)
Other Services (except Public Administration): Religious Organizations (10-19: 1, 5-9: 1)
Educational Services: Other Technical and Trade Schools (10-19: 1, 1-4: 1)
Accommodation and Food Services: Limited-Service Restaurants (5-9: 2, 1-4: 1)
Health Care and Social Assistance: Offices of Dentists (5-9: 2, 1-4: 1)
People in group quarters in 2000:
4 people in religious group quarters
Home Mortgage Disclosure Act Aggregated Statistics For Year 2009 (Based on 2 full tracts)
A) FHA, FSA/RHS & VA Home Purchase Loans
B) Conventional Home Purchase Loans
C) Refinancings
D) Home Improvement Loans
F) Non-occupant Loans on < 5 Family Dwellings (A B C & D)
Number
Average Value
Number
Average Value
Number
Average Value
Number
Average Value
Number
Average Value
LOANS ORIGINATED
2
$256,095
8
$178,088
104
$202,014
10
$64,170
4
$78,005
APPLICATIONS APPROVED, NOT ACCEPTED
4
$209,978
0
$0
10
$229,012
0
$0
0
$0
APPLICATIONS DENIED
0
$0
4
$195,260
51
$231,409
8
$77,024
0
$0
APPLICATIONS WITHDRAWN
4
$159,445
2
$88,310
24
$202,291
2
$82,420
2
$82,420
FILES CLOSED FOR INCOMPLETENESS
0
$0
0
$0
8
$256,584
2
$228,620
0
$0
Aggregated Statistics For Year 2008 (Based on 2 full tracts)
A) FHA, FSA/RHS & VA Home Purchase Loans
B) Conventional Home Purchase Loans
C) Refinancings
D) Home Improvement Loans
F) Non-occupant Loans on < 5 Family Dwellings (A B C & D)
Number
Average Value
Number
Average Value
Number
Average Value
Number
Average Value
Number
Average Value
LOANS ORIGINATED
10
$245,496
35
$203,417
80
$207,107
29
$72,947
2
$262,960
APPLICATIONS APPROVED, NOT ACCEPTED
0
$0
6
$179,233
8
$236,715
2
$24,530
0
$0
APPLICATIONS DENIED
0
$0
10
$170,336
59
$211,573
12
$36,795
8
$249,470
APPLICATIONS WITHDRAWN
2
$330,665
10
$205,660
12
$198,039
2
$58,870
0
$0
FILES CLOSED FOR INCOMPLETENESS
0
$0
2
$208,015
2
$229,600
0
$0
0
$0
Aggregated Statistics For Year 2007 (Based on 2 full tracts)
A) FHA, FSA/RHS & VA Home Purchase Loans
B) Conventional Home Purchase Loans
C) Refinancings
D) Home Improvement Loans
E) Loans on Dwellings For 5+ Families
F) Non-occupant Loans on < 5 Family Dwellings (A B C & D)
Number
Average Value
Number
Average Value
Number
Average Value
Number
Average Value
Number
Average Value
Number
Average Value
LOANS ORIGINATED
4
$253,640
59
$213,835
145
$166,019
20
$81,538
2
$2,576,630
10
$206,444
APPLICATIONS APPROVED, NOT ACCEPTED
0
$0
10
$169,944
29
$195,969
6
$62,470
0
$0
4
$233,525
APPLICATIONS DENIED
0
$0
14
$223,293
77
$204,574
16
$63,901
0
$0
4
$233,525
APPLICATIONS WITHDRAWN
0
$0
2
$187,410
49
$255,472
4
$229,600
0
$0
2
$187,410
FILES CLOSED FOR INCOMPLETENESS
0
$0
0
$0
24
$222,160
2
$267,870
0
$0
0
$0
Aggregated Statistics For Year 2006 (Based on 2 full tracts)
B) Conventional Home Purchase Loans
C) Refinancings
D) Home Improvement Loans
F) Non-occupant Loans on < 5 Family Dwellings (A B C & D)
Number
Average Value
Number
Average Value
Number
Average Value
Number
Average Value
LOANS ORIGINATED
80
$195,283
147
$193,036
26
$38,569
10
$232,937
APPLICATIONS APPROVED, NOT ACCEPTED
14
$170,589
41
$159,290
6
$111,857
2
$208,995
APPLICATIONS DENIED
26
$241,149
73
$242,289
16
$62,061
4
$371,875
APPLICATIONS WITHDRAWN
24
$211,203
45
$200,296
4
$290,435
2
$239,415
FILES CLOSED FOR INCOMPLETENESS
2
$215,865
16
$251,923
0
$0
0
$0
Aggregated Statistics For Year 2005 (Based on 2 full tracts)
A) FHA, FSA/RHS & VA Home Purchase Loans
B) Conventional Home Purchase Loans
C) Refinancings
D) Home Improvement Loans
E) Loans on Dwellings For 5+ Families
F) Non-occupant Loans on < 5 Family Dwellings (A B C & D)
Number
Average Value
Number
Average Value
Number
Average Value
Number
Average Value
Number
Average Value
Number
Average Value
LOANS ORIGINATED
4
$167,295
96
$194,237
175
$182,941
24
$96,239
2
$515,130
12
$211,448
APPLICATIONS APPROVED, NOT ACCEPTED
0
$0
8
$246,771
27
$133,225
6
$89,943
0
$0
2
$98,120
APPLICATIONS DENIED
0
$0
18
$213,793
33
$210,631
16
$105,111
0
$0
0
$0
APPLICATIONS WITHDRAWN
4
$237,450
26
$191,485
86
$210,958
6
$81,113
0
$0
4
$92,722
FILES CLOSED FOR INCOMPLETENESS
0
$0
10
$78,496
29
$228,180
2
$98,120
0
$0
0
$0
Aggregated Statistics For Year 2004 (Based on 2 full tracts)
A) FHA, FSA/RHS & VA Home Purchase Loans
B) Conventional Home Purchase Loans
C) Refinancings
D) Home Improvement Loans
F) Non-occupant Loans on < 5 Family Dwellings (A B C & D)
G) Loans On Manufactured Home Dwelling (A B C & D)
Number
Average Value
Number
Average Value
Number
Average Value
Number
Average Value
Number
Average Value
Number
Average Value
LOANS ORIGINATED
6
$221,423
51
$209,669
169
$158,385
22
$92,233
26
$201,976
0
$0
APPLICATIONS APPROVED, NOT ACCEPTED
0
$0
6
$222,405
22
$135,227
6
$43,500
4
$225,675
0
$0
APPLICATIONS DENIED
0
$0
0
$0
55
$161,202
24
$40,475
8
$240,885
0
$0
APPLICATIONS WITHDRAWN
0
$0
14
$229,321
53
$138,775
10
$206,837
8
$193,296
2
$255,110
FILES CLOSED FOR INCOMPLETENESS
0
$0
0
$0
18
$193,732
2
$34,340
0
$0
0
$0
Aggregated Statistics For Year 2003 (Based on 2 full tracts)
A) FHA, FSA/RHS & VA Home Purchase Loans
B) Conventional Home Purchase Loans
C) Refinancings
D) Home Improvement Loans
E) Loans on Dwellings For 5+ Families
F) Non-occupant Loans on < 5 Family Dwellings (A B C & D)
Number
Average Value
Number
Average Value
Number
Average Value
Number
Average Value
Number
Average Value
Number
Average Value
LOANS ORIGINATED
16
$225,186
71
$188,307
288
$141,811
31
$39,248
2
$224,695
16
$159,445
APPLICATIONS APPROVED, NOT ACCEPTED
0
$0
4
$189,862
51
$127,479
6
$34,342
0
$0
2
$98,120
APPLICATIONS DENIED
2
$186,430
6
$233,198
53
$126,075
18
$21,804
0
$0
4
$196,240
APPLICATIONS WITHDRAWN
2
$201,145
8
$228,620
73
$150,728
10
$30,221
0
$0
10
$163,075
FILES CLOSED FOR INCOMPLETENESS
0
$0
0
$0
2
$240,395
2
$19,625
0
$0
0
$0
Aggregated Statistics For Year 2002 (Based on 2 full tracts)
A) FHA, FSA/RHS & VA Home Purchase Loans
B) Conventional Home Purchase Loans
C) Refinancings
D) Home Improvement Loans
E) Loans on Dwellings For 5+ Families
F) Non-occupant Loans on < 5 Family Dwellings (A B C & D)
Number
Average Value
Number
Average Value
Number
Average Value
Number
Average Value
Number
Average Value
Number
Average Value
LOANS ORIGINATED
12
$176,452
78
$158,980
214
$125,676
24
$53,067
4
$220,770
22
$169,569
APPLICATIONS APPROVED, NOT ACCEPTED
0
$0
16
$148,406
37
$131,693
2
$73,590
0
$0
6
$167,458
APPLICATIONS DENIED
0
$0
12
$137,368
57
$109,412
8
$34,342
0
$0
8
$150,369
APPLICATIONS WITHDRAWN
4
$194,278
10
$171,906
45
$116,872
6
$15,372
0
$0
6
$162,880
FILES CLOSED FOR INCOMPLETENESS
0
$0
6
$234,507
14
$124,893
0
$0
0
$0
2
$220,770
Aggregated Statistics For Year 2001 (Based on 2 full tracts)
A) FHA, FSA/RHS & VA Home Purchase Loans
B) Conventional Home Purchase Loans
C) Refinancings
D) Home Improvement Loans
F) Non-occupant Loans on < 5 Family Dwellings (A B C & D)
Number
Average Value
Number
Average Value
Number
Average Value
Number
Average Value
Number
Average Value
LOANS ORIGINATED
8
$155,765
43
$141,247
120
$112,462
18
$30,308
12
$87,327
APPLICATIONS APPROVED, NOT ACCEPTED
0
$0
6
$255,112
29
$102,789
2
$9,810
8
$120,198
APPLICATIONS DENIED
0
$0
8
$135,160
63
$94,351
20
$40,524
0
$0
APPLICATIONS WITHDRAWN
0
$0
2
$102,045
47
$105,051
8
$39,248
0
$0
FILES CLOSED FOR INCOMPLETENESS
0
$0
2
$95,175
8
$142,029
0
$0
0
$0
Aggregated Statistics For Year 2000 (Based on 2 full tracts)
A) FHA, FSA/RHS & VA Home Purchase Loans
B) Conventional Home Purchase Loans
C) Refinancings
D) Home Improvement Loans
E) Loans on Dwellings For 5+ Families
F) Non-occupant Loans on < 5 Family Dwellings (A B C & D)
Number
Average Value
Number
Average Value
Number
Average Value
Number
Average Value
Number
Average Value
Number
Average Value
LOANS ORIGINATED
14
$139,471
29
$127,759
35
$86,233
22
$30,863
2
$2,551,120
4
$55,438
APPLICATIONS APPROVED, NOT ACCEPTED
0
$0
8
$110,385
14
$57,751
2
$49,060
0
$0
2
$58,870
APPLICATIONS DENIED
0
$0
10
$100,279
27
$74,717
12
$18,970
0
$0
4
$76,042
APPLICATIONS WITHDRAWN
2
$107,930
6
$87,982
37
$69,957
2
$24,530
0
$0
0
$0
FILES CLOSED FOR INCOMPLETENESS
0
$0
4
$108,422
6
$63,123
0
$0
0
$0
0
$0
Aggregated Statistics For Year 1999 (Based on 1 full tract)
A) FHA, FSA/RHS & VA Home Purchase Loans
B) Conventional Home Purchase Loans
C) Refinancings
D) Home Improvement Loans
F) Non-occupant Loans on < 5 Family Dwellings (A B C & D)
Detailed PMIC statistics for the following Tracts:0460.00
2002 - 2018 National Fire Incident Reporting System (NFIRS) incidents
Based on the data from the years 2002 - 2018 the average number of fire incidents per year is 10. The highest number of reported fires - 22 took place in 2012, and the least - 0 in 2003. The data has a growing trend.
When looking into fire subcategories, the most reports belonged to: Structure Fires (68.0%), and Outside Fires (20.0%).
Fire incident types reported to NFIRS in Zip Code 07857


 Nearest zip codes: 07852, 07850, 07874, 07828, 07836, 07843.


 Based on the data from the years 2002 - 2018 the average number of fire incidents per year is 10. The highest number of reported fires - 22 took place in 2012, and the least - 0 in 2003. The data has a growing trend.
 When looking into fire subcategories, the most reports belonged to: Structure Fires (68.0%), and Outside Fires (20.0%).