Estimated zip code population in 2022: 4,888 Zip code population in 2010: 5,030 Zip code population in 2000: 4,596
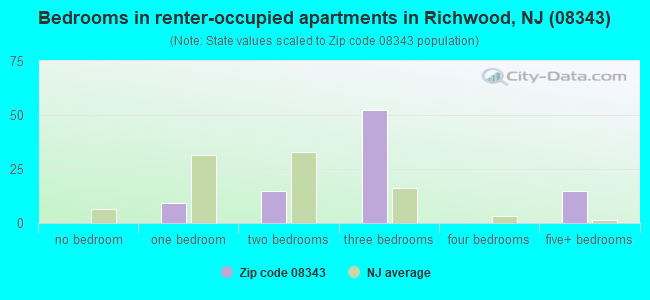
Houses and condos: 1,680 Renter-occupied apartments: 92
% of renters here:
6%
State:
35%
March 2022 cost of living index in zip code 08343: 100.9 (near average, U.S. average is 100)
Land area: 33.3 sq. mi. Water area: 0.2 sq. mi.
Population density: 147 people per square mile
(very low).
OSM Map
Google Map
MSN Map
OSM Map
General Map
Google Map
MSN Map
OSM Map
Google Map
MSN Map
OSM Map
Google Map
MSN Map
Please wait while loading the map...
Real estate property taxes paid for housing units in 2022:
This zip code:
2.5% ($8,454)
New Jersey:
2.1% ($8,897)
Median real estate property taxes paid for housing units with mortgages in 2022: $9,165 (2.7%) Median real estate property taxes paid for housing units with no mortgage in 2022: $7,849 (2.4%)
Business Search- 14 Million verified businesses
Males: 2,209
(45.2%)
Females: 2,679
(54.8%)
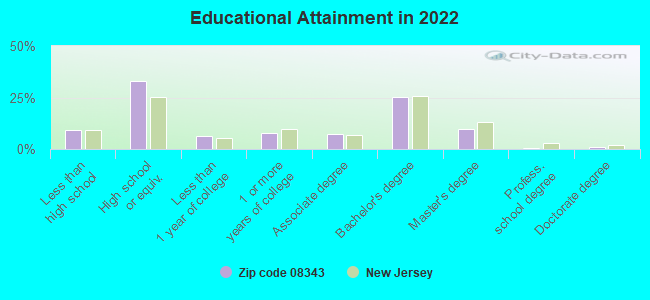
For population 25 years and over in 08343:
High school or higher: 90.1%
Bachelor's degree or higher: 36.0%
Graduate or professional degree: 11.0%
Unemployed: 1.1%
Mean travel time to work (commute): 26.0 minutes
For population 15 years and over in 08343:
Never married: 24.7%
Now married: 61.6%
Separated: 0.8%
Widowed: 6.7%
Divorced: 6.2%
Zip code 08343 compared to state average:
Unemployed percentage significantly below state average.
Black race population percentage significantly below state average.
Hispanic race population percentage significantly below state average.
Median age above state average.
Foreign-born population percentage significantly below state average.
Renting percentage significantly below state average.
Length of stay since moving in significantly above state average.
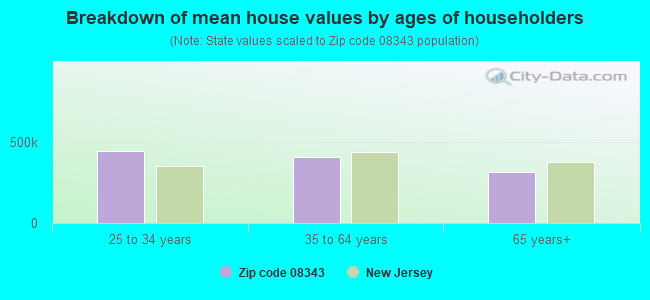
Estimated median house/condo value in 2022: $332,627
08343:
$332,627
New Jersey:
$428,900
According to our research of New Jersey and other state lists, there were 2 registered sex offenders living in 08343 zip code as of May 28, 2024. The ratio of all residents to sex offenders in zip code 08343 is 2,684 to 1. The ratio of registered sex offenders to all residents in this zip code is lower than the state average.
Median resident age:
This zip code:
45.5 years
New Jersey median age:
40.4 years
Average household size:
This zip code:
3.1 people
New Jersey:
2.6 people
Averages for the 2020 tax year for zip code 08343, filed in 2021:
Average Adjusted Gross Income (AGI) in 2020: $88,061 (Individual Income Tax Returns)
Here:
$88,061
State:
$95,247
Salary/wage: $73,176 (reported on 81.9% of returns)
Here:
$73,176
State:
$80,635
(% of AGI for various income ranges: 1224.0% for AGIs below $25k, 3511.2% for AGIs $25k-50k, 6277.7% for AGIs $50k-75k, 8853.5% for AGIs $75k-100k, 16973.3% for AGIs $100k-200k, 71428.0% for AGIs over 200k)
Taxable interest for individuals: $858 (reported on 37.4% of returns)
This zip code:
$858
New Jersey:
$2,414
(% of AGI for various income ranges: 24.6% for AGIs below $25k, 31.9% for AGIs $25k-50k, 21.4% for AGIs $50k-75k, 26.5% for AGIs $75k-100k, 82.7% for AGIs $100k-200k, 352.0% for AGIs over 200k)
Ordinary dividends: $4,712 (reported on 26.4% of returns)
Here:
$4,712
State:
$8,057
(% of AGI for various income ranges: 36.9% for AGIs below $25k, 51.2% for AGIs $25k-50k, 58.2% for AGIs $50k-75k, 190.0% for AGIs $75k-100k, 330.0% for AGIs $100k-200k, 1988.0% for AGIs over 200k)
Net capital gain/loss in AGI: +$8,155 (reported on 22.5% of returns)
Here:
+$8,155
State:
+$25,022
(% of AGI for various income ranges: 11.4% for AGIs below $25k, 30.6% for AGIs $25k-50k, 115.5% for AGIs $50k-75k, 192.9% for AGIs $75k-100k, 376.7% for AGIs $100k-200k, 4392.0% for AGIs over 200k)
Profit/loss from business: +$19,639 (reported on 13.7% of returns)
Here:
+$19,639
State:
+$18,035
(% of AGI for various income ranges: 87.4% for AGIs below $25k, 167.5% for AGIs $25k-50k, 127.3% for AGIs $50k-75k, 374.1% for AGIs $75k-100k, 632.1% for AGIs $100k-200k, 4488.0% for AGIs over 200k)
Taxable individual retirement arrangement distribution: $20,388 (reported on 11.5% of returns)
08343:
$20,388
New Jersey:
$21,558
(% of AGI for various income ranges: 96.3% for AGIs below $25k, 141.2% for AGIs $25k-50k, 294.5% for AGIs $50k-75k, 408.2% for AGIs $75k-100k, 960.6% for AGIs $100k-200k)
Total itemized deductions: $28,061 (reported on 12.3% of returns)
Here:
$28,061
State:
$32,863
(% of AGI for various income ranges: 215.3% for AGIs $25k-50k, 522.7% for AGIs $50k-75k, 565.3% for AGIs $75k-100k, 753.9% for AGIs $100k-200k, 5138.0% for AGIs over 200k)
Charity contributions: $8,558 (reported on 10.6% of returns)
Here:
$8,558
State:
$7,880
(% of AGI for various income ranges: 20.0% for AGIs below $25k, 43.6% for AGIs $50k-75k, 100.0% for AGIs $75k-100k, 161.2% for AGIs $100k-200k, 2372.0% for AGIs over 200k)
Taxes paid: $8,789 (reported on 12.3% of returns)
08343:
$8,789
State:
$9,183
(% of AGI for various income ranges: 74.1% for AGIs $25k-50k, 190.0% for AGIs $50k-75k, 185.9% for AGIs $75k-100k, 269.7% for AGIs $100k-200k, 1200.0% for AGIs over 200k)
Earned income credit: $1,862 (reported on 7.0% of returns)
Here:
$1,862
State:
$2,148
(% of AGI for various income ranges: 54.9% for AGIs below $25k, 33.1% for AGIs $25k-50k)
Percentage of individuals using paid preparers for their 2020 taxes: 92.1%
Here:
92%
State:
92%
(% for various income ranges: 90.9% for AGIs below $25k, 91.1% for AGIs $25k-50k, 93.8% for AGIs $50k-75k, 92.3% for AGIs $75k-100k, 94.3% for AGIs $100k-200k, 87.5% for AGIs over 200k)
Averages for the 2012 tax year for zip code 08343, filed in 2013:
Average Adjusted Gross Income (AGI) in 2012: $63,999 (Individual Income Tax Returns)
Here:
$63,999
State:
$79,688
Salary/wage: $56,589 (reported on 85.1% of returns)
Here:
$56,589
State:
$68,122
(% of AGI for various income ranges: 69.2% for AGIs below $25k, 72.3% for AGIs $25k-50k, 71.2% for AGIs $50k-75k, 74.4% for AGIs $75k-100k, 81.3% for AGIs $100k-200k, 67.4% for AGIs over 200k)
Taxable interest for individuals: $1,100 (reported on 43.2% of returns)
This zip code:
$1,100
New Jersey:
$2,193
(% of AGI for various income ranges: 2.1% for AGIs below $25k, 1.1% for AGIs $25k-50k, 1.0% for AGIs $50k-75k, 0.4% for AGIs $75k-100k, 0.5% for AGIs $100k-200k, 0.6% for AGIs over 200k)
Ordinary dividends: $2,987 (reported on 24.8% of returns)
Here:
$2,987
State:
$6,828
(% of AGI for various income ranges: 2.1% for AGIs below $25k, 1.0% for AGIs $25k-50k, 1.0% for AGIs $50k-75k, 1.4% for AGIs $75k-100k, 0.8% for AGIs $100k-200k, 1.9% for AGIs over 200k)
Net capital gain/loss in AGI: +$3,098 (reported on 18.0% of returns)
Here:
+$3,098
State:
+$15,358
(% of AGI for various income ranges: 0.4% for AGIs $25k-50k, 0.3% for AGIs $50k-75k, 0.2% for AGIs $75k-100k, 0.9% for AGIs $100k-200k, 3.1% for AGIs over 200k)
Profit/loss from business: +$14,106 (reported on 14.9% of returns)
Here:
+$14,106
State:
+$19,577
(% of AGI for various income ranges: 8.5% for AGIs below $25k, 2.4% for AGIs $25k-50k, 5.0% for AGIs $50k-75k, 3.4% for AGIs $75k-100k, 3.2% for AGIs $100k-200k)
Taxable individual retirement arrangement distribution: $17,104 (reported on 10.4% of returns)
08343:
$17,104
New Jersey:
$18,214
(% of AGI for various income ranges: 2.4% for AGIs below $25k, 3.0% for AGIs $25k-50k, 3.0% for AGIs $50k-75k, 3.4% for AGIs $75k-100k, 3.4% for AGIs $100k-200k)
Total itemized deductions: $23,553 (24% of AGI, reported on 47.7% of returns)
Here:
$23,553
State:
$30,827
Here:
23.5% of AGI
State:
21.2% of AGI
(% of AGI for various income ranges: 17.5% for AGIs below $25k, 13.9% for AGIs $25k-50k, 16.9% for AGIs $50k-75k, 18.9% for AGIs $75k-100k, 18.4% for AGIs $100k-200k, 17.6% for AGIs over 200k)
Charity contributions: $2,887 (reported on 40.1% of returns)
Here:
$2,887
State:
$3,451
(% of AGI for various income ranges: 0.9% for AGIs below $25k, 1.3% for AGIs $25k-50k, 1.6% for AGIs $50k-75k, 1.5% for AGIs $75k-100k, 2.1% for AGIs $100k-200k, 2.3% for AGIs over 200k)
Taxes paid: $10,647 (reported on 47.3% of returns)
08343:
$10,647
State:
$15,801
(% of AGI for various income ranges: 5.8% for AGIs below $25k, 4.9% for AGIs $25k-50k, 7.1% for AGIs $50k-75k, 8.2% for AGIs $75k-100k, 8.9% for AGIs $100k-200k, 8.5% for AGIs over 200k)
Earned income credit: $2,048 (reported on 10.4% of returns)
Here:
$2,048
State:
$2,182
(% of AGI for various income ranges: 3.8% for AGIs below $25k, 0.9% for AGIs $25k-50k)
Percentage of individuals using paid preparers for their 2012 taxes: 61.7%
Here:
62%
State:
65%
(% for various income ranges: 50.0% for AGIs below $25k, 62.2% for AGIs $25k-50k, 68.8% for AGIs $50k-75k, 69.6% for AGIs $75k-100k, 69.8% for AGIs $100k-200k, 71.4% for AGIs over 200k)
Averages for the 2004 tax year for zip code 08343, filed in 2005:
Average Adjusted Gross Income (AGI) in 2004: $55,600 (Individual Income Tax Returns)
Here:
$55,600
State:
$64,921
Salary/wage: $52,171 (reported on 84.9% of returns)
Here:
$52,171
State:
$57,755
(% of AGI for various income ranges: 135.9% for AGIs below $10k, 68.4% for AGIs $10k-25k, 74.8% for AGIs $25k-50k, 82.3% for AGIs $50k-75k, 85.5% for AGIs $75k-100k, 78.0% for AGIs over 100k)
Taxable interest for individuals: $1,157 (reported on 58.1% of returns)
This zip code:
$1,157
New Jersey:
$2,068
(% of AGI for various income ranges: 7.7% for AGIs below $10k, 3.2% for AGIs $10k-25k, 1.7% for AGIs $25k-50k, 1.0% for AGIs $50k-75k, 0.4% for AGIs $75k-100k, 1.1% for AGIs over 100k)
Taxable dividends: $1,985 (reported on 29.7% of returns)
Here:
$1,985
State:
$3,959
(% of AGI for various income ranges: 7.0% for AGIs below $10k, 2.7% for AGIs $10k-25k, 1.4% for AGIs $25k-50k, 0.8% for AGIs $50k-75k, 0.7% for AGIs $75k-100k, 0.9% for AGIs over 100k)
Net capital gain/loss: +$5,435 (reported on 19.7% of returns)
Here:
+$5,435
State:
+$13,591
(% of AGI for various income ranges: 3.4% for AGIs below $10k, -0.6% for AGIs $10k-25k, 0.5% for AGIs $25k-50k, 0.5% for AGIs $50k-75k, 1.5% for AGIs $75k-100k, 3.6% for AGIs over 100k)
Profit/loss from business: +$11,865 (reported on 14.3% of returns)
Here:
+$11,865
State:
+$17,520
(% of AGI for various income ranges: 5.1% for AGIs below $10k, 7.5% for AGIs $10k-25k, 4.4% for AGIs $25k-50k, 3.6% for AGIs $50k-75k, 3.3% for AGIs $75k-100k, 1.6% for AGIs over 100k)
IRA payment deduction: $3,333 (reported on 3.2% of returns)
08343:
$3,333
New Jersey:
$3,270
(% of AGI for various income ranges: 0.5% for AGIs $10k-25k, 0.3% for AGIs $25k-50k, 0.2% for AGIs $50k-75k, 0.5% for AGIs $75k-100k)
Self-employed pension: $11,700 (reported on 0.5% of returns)
Here:
$11,700
New Jersey:
$17,258
Total itemized deductions: $18,645 (21% of AGI, reported on 47.2% of returns)
Here:
$18,645
State:
$23,924
Here:
21.1% of AGI
State:
21.1% of AGI
(% of AGI for various income ranges: 40.4% for AGIs below $10k, 12.8% for AGIs $10k-25k, 14.5% for AGIs $25k-50k, 17.8% for AGIs $50k-75k, 16.8% for AGIs $75k-100k, 14.9% for AGIs over 100k)
Charity contributions deductions: $2,707 (3% of AGI, reported on 43.8% of returns)
Here:
$2,707
State:
$3,242
Here:
3.0% of AGI
State:
2.7% of AGI
(% of AGI for various income ranges: 1.9% for AGIs below $10k, 1.7% for AGIs $10k-25k, 2.0% for AGIs $25k-50k, 2.0% for AGIs $50k-75k, 2.5% for AGIs $75k-100k, 2.2% for AGIs over 100k)
Total tax: $8,396 (reported on 81.1% of returns)
08343:
$8,396
State:
$12,321
(% of AGI for various income ranges: 3.6% for AGIs below $10k, 4.9% for AGIs $10k-25k, 7.4% for AGIs $25k-50k, 8.9% for AGIs $50k-75k, 10.2% for AGIs $75k-100k, 17.3% for AGIs over 100k)
Earned income credit: $1,572 (reported on 8.0% of returns)
Here:
$1,572
State:
$1,711
Percentage of individuals using paid preparers for their 2004 taxes: 63.5%
Here:
64%
State:
65%
(% for various income ranges: 53.3% for AGIs below $10k, 57.1% for AGIs $10k-25k, 63.8% for AGIs $25k-50k, 71.3% for AGIs $50k-75k, 67.8% for AGIs $75k-100k, 70.8% for AGIs over 100k)
Likely homosexual households (counted as self-reported same-sex unmarried-partner households)
Lesbian couples: 0.4% of all households
Gay men: 0.0% of all households
Household received Food Stamps/SNAP in the past 12 months: 56 Household did not receive Food Stamps/SNAP in the past 12 months: 1,497
Women who had a birth in the past 12 months: 19 (20 now married, 0 unmarried) Women who did not have a birth in the past 12 months: 1,161 (506 now married, 655 unmarried)
Housing units in zip code 08343 with a mortgage: 737 (116 second mortgage, 94 both second mortgage and home equity loan) Median monthly owner costs for units with a mortgage: $2,440 Median monthly owner costs for units without a mortgage: $969
Residents with income below the poverty level in 2022:
This zip code:
3.0%
Whole state:
9.7%
Residents with income below 50% of the poverty level in 2022:
This zip code:
1.8%
Whole state:
5.2%
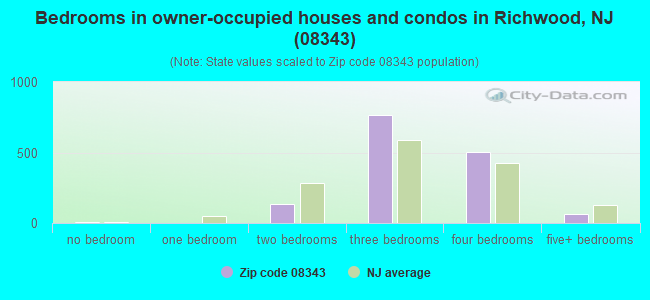
Median number of rooms in houses and condos:
Here:
7.0
State:
6.8
Median number of rooms in apartments:
Here:
6.7
State:
3.9
Notable locations in this zip code not listed on our city pages
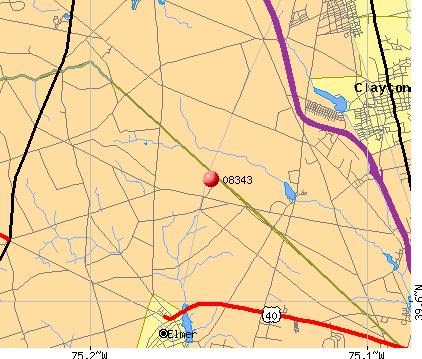
Notable locations in zip code 08343: Holiness Camp (A), Fruitwood Farms (B), Robert Schober Orchards (C), Monroeville Volunteer Fire Company (D), Aura Volunteer Fire Company (E). Display/hide their locations on the map
Lakes, reservoirs, and swamps: Loggerhead Pond (A), Garrison Lake (B), Rich Crow Lake (C), Wrights Millpond (D), Ewan Lake (E), Gilman Lake (F), Omary Lake (G), Elephant Swamp (H). Display/hide their locations on the map
In group quarters: 37 (-1 institutionalized population)
Size of family households: 492 2-persons, 238 3-persons, 190 4-persons, 221 5-persons, 84 6-persons, 67 7-or-more-persons
Size of nonfamily households: 205 1-person, 67 2-persons
1,015 married couples with children.
79 single-parent households (18 men, 61 women).
92.2% of residents of 08343 zip code speak English at home.
6.5% of residents speak Spanish at home (70% very well, 30% not well).
0.5% of residents speak other Indo-European language at home (52% very well, 48% well).
0.6% of residents speak Asian or Pacific Island language at home (100% very well).
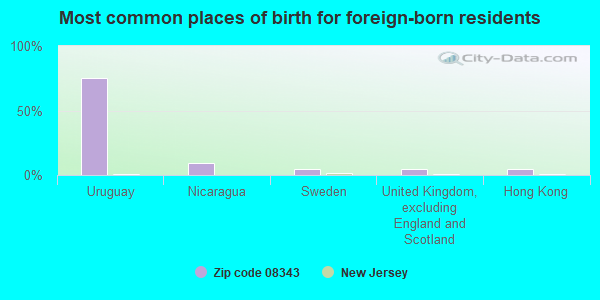
Foreign born population: 133 (2.7%) (100.0% of them are naturalized citizens)
This zip code:
2.7%
Whole state:
23.5%
75%Uruguay
9%Nicaragua
5%Sweden
5%United Kingdom, excluding England and Scotland
5%Hong Kong
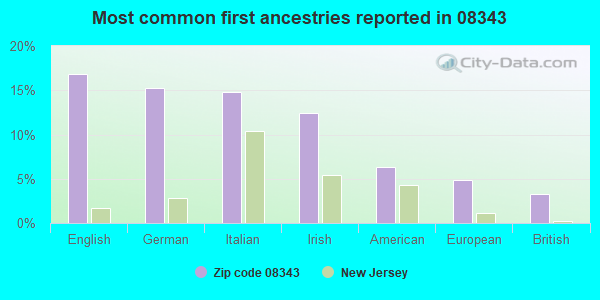
17%English
15%German
15%Italian
12%Irish
6%American
5%European
3%British
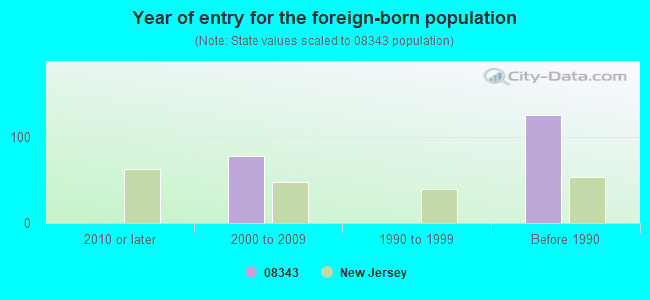
Year of entry for the foreign-born population
02010 or later
772000 to 2009
01990 to 1999
125Before 1990
Facilities with environmental interests located in this zip code:
P E KRAMME INC (MAIN ST in MONROEVILLE, NJ)
National Pollutant Discharge Elimination System NON-MAJOR (Tracking pollutant discharge elimination systems) - permit (Resource Conservation and Recovery Act (tracking hazardous waste)) Business SIC classification: TRUCKING, EXCEPT LOCAL
FORD VINTAGE RESTORATION (RTE 538 in MONROEVILLE, NJ)
(Resource Conservation and Recovery Act (tracking hazardous waste))
ATLANTIC ELECTRIC ET OPERATION (RD 1 BOX 238A AURA-WILLOW in MONROEVILLE, NJ)
Small Quantity Generators, between 100 kg and 1000 kg of hazardous waste/month (Resource Conservation and Recovery Act (tracking hazardous waste)) - notification
Housing units lacking complete kitchen facilities: 1.0%
43.4%Fuel oil, kerosene, etc.
43.4%Utility gas
6.1%Bottled, tank, or LP gas
3.4%Electricity
2.8%Wood
1.0%Solar energy
Population in 1990: 5,068.
Place of birth for U.S.-born residents:
This state: 3,390
Northeast: 872
Midwest: 67
South: 256
West: 68
78% of the 08343 zip code residents lived in the same house 5 years ago. Out of people who lived in different houses, 46% lived in this county. Out of people who lived in different counties, 50% lived in New Jersey.
95% of the 08343 zip code residents lived in the same house 1 year ago. Out of people who lived in different houses, 62% moved from this county. Out of people who lived in different houses, 14% moved from different county within same state. Out of people who lived in different houses, 24% moved from different state.
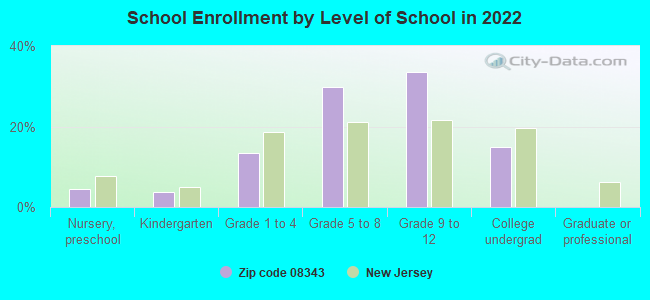
Private vs. public school enrollment:
Students in private schools in grades 1 to 8 (elementary and middle school): 43
Here:
7.5%
New Jersey:
12.3%
Students in private schools in grades 9 to 12 (high school): 25
Here:
5.6%
New Jersey:
13.1%
Students in private undergraduate colleges: 92
Here:
46.2%
New Jersey:
33.2%
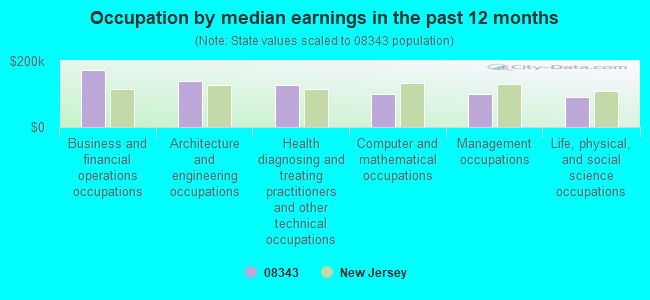
Occupation by median earnings in the past 12 months ($)
172,066Business and financial operations occupations
139,448Architecture and engineering occupations
127,679Health diagnosing and treating practitioners and other technical occupations
99,426Computer and mathematical occupations
98,933Management occupations
91,685Life, physical, and social science occupations
Top industries in this zip code by the number of employees in 2005:
Other Services (except Public Administration): Religious Organizations (50-99: 1, 1-4: 3)
Construction: Drywall and Insulation Contractors (20-49: 1, 1-4: 1)
Other Services (except Public Administration): Commercial and Industrial Machinery and Equipment (except Automotive and Electronic) Repair and Maintenance (20-49: 1, 1-4: 1)
Administrative and Support and Waste Management and Remediation Services: Landscaping Services (20-49: 1, 1-4: 1)
Accommodation and Food Services: Full-Service Restaurants (20-49: 1)
Other Services (except Public Administration): General Automotive Repair (5-9: 2, 1-4: 3)
Construction: Commercial and Institutional Building Construction (10-19: 1, 1-4: 1)
Administrative and Support and Waste Management and Remediation Services: Janitorial Services (10-19: 1, 1-4: 1)
People in group quarters in 2010:
17 people in workers' group living quarters and job corps centers
5 people in group homes intended for adults
People in group quarters in 2000:
36 people in agriculture workers' dormitories on farms
6 people in homes or halfway houses for drug/alcohol abuse
5 people in other noninstitutional group quarters
Fatal accident statistics in 2014:
Fatal accident count: 1
Vehicles involved in fatal accidents: 3
Fatal accidents caused by drunken drivers: 0
Fatalities: 1
Persons involved in fatal accidents: 4
Pedestrians involved in fatal accidents: 0
Fatal accident statistics in 2013:
Fatal accident count: 2
Vehicles involved in fatal accidents: 4
Fatal accidents caused by drunken drivers: 0
Fatalities: 2
Persons involved in fatal accidents: 8
Pedestrians involved in fatal accidents: 0
Home Mortgage Disclosure Act Aggregated Statistics For Year 2009 (Based on 6 partial tracts)
A) FHA, FSA/RHS & VA Home Purchase Loans
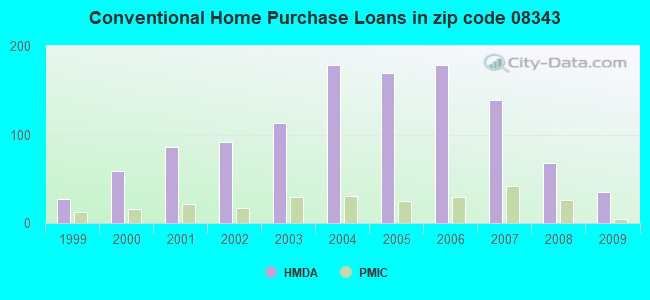
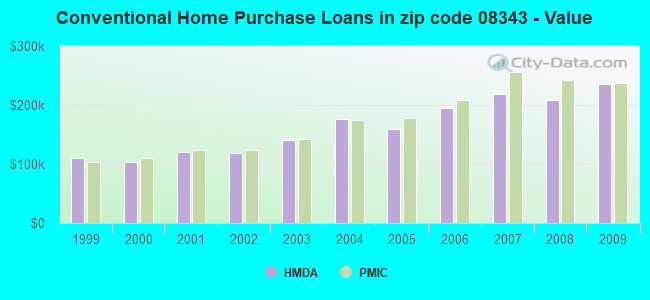
B) Conventional Home Purchase Loans
C) Refinancings
D) Home Improvement Loans
F) Non-occupant Loans on < 5 Family Dwellings (A B C & D)
G) Loans On Manufactured Home Dwelling (A B C & D)
Number
Average Value
Number
Average Value
Number
Average Value
Number
Average Value
Number
Average Value
Number
Average Value
LOANS ORIGINATED
29
$214,704
35
$235,630
274
$186,046
40
$44,688
11
$249,305
5
$65,472
APPLICATIONS APPROVED, NOT ACCEPTED
0
$0
5
$168,418
28
$199,986
5
$62,016
2
$243,310
1
$52,760
APPLICATIONS DENIED
13
$214,405
15
$191,243
118
$223,544
17
$61,264
0
$0
3
$68,687
APPLICATIONS WITHDRAWN
3
$216,907
6
$122,988
58
$197,936
5
$48,868
1
$191,260
2
$87,630
FILES CLOSED FOR INCOMPLETENESS
4
$143,348
1
$174,300
18
$206,567
1
$32,180
0
$0
0
$0
Aggregated Statistics For Year 2008 (Based on 6 partial tracts)
A) FHA, FSA/RHS & VA Home Purchase Loans
B) Conventional Home Purchase Loans
C) Refinancings
D) Home Improvement Loans
F) Non-occupant Loans on < 5 Family Dwellings (A B C & D)
G) Loans On Manufactured Home Dwelling (A B C & D)
Number
Average Value
Number
Average Value
Number
Average Value
Number
Average Value
Number
Average Value
Number
Average Value
LOANS ORIGINATED
37
$210,264
68
$208,476
212
$180,551
57
$44,901
13
$156,573
8
$54,169
APPLICATIONS APPROVED, NOT ACCEPTED
3
$200,460
10
$241,112
30
$172,356
13
$50,588
1
$448,460
0
$0
APPLICATIONS DENIED
13
$196,398
13
$106,496
110
$207,266
39
$49,180
9
$176,361
8
$57,362
APPLICATIONS WITHDRAWN
5
$191,160
5
$158,554
67
$192,590
2
$85,360
0
$0
1
$38,030
FILES CLOSED FOR INCOMPLETENESS
1
$311,280
4
$254,292
14
$235,024
2
$223,795
0
$0
2
$187,635
Aggregated Statistics For Year 2007 (Based on 6 partial tracts)
A) FHA, FSA/RHS & VA Home Purchase Loans
B) Conventional Home Purchase Loans
C) Refinancings
D) Home Improvement Loans
F) Non-occupant Loans on < 5 Family Dwellings (A B C & D)
G) Loans On Manufactured Home Dwelling (A B C & D)
Number
Average Value
Number
Average Value
Number
Average Value
Number
Average Value
Number
Average Value
Number
Average Value
LOANS ORIGINATED
12
$228,163
139
$219,184
270
$162,431
119
$59,499
25
$123,614
9
$44,532
APPLICATIONS APPROVED, NOT ACCEPTED
0
$0
29
$210,513
62
$168,948
15
$32,270
3
$134,170
1
$57,000
APPLICATIONS DENIED
2
$221,180
32
$261,162
182
$198,465
53
$60,425
9
$100,470
4
$101,425
APPLICATIONS WITHDRAWN
0
$0
33
$279,585
90
$199,924
9
$92,378
7
$176,227
1
$18,390
FILES CLOSED FOR INCOMPLETENESS
0
$0
6
$281,230
25
$228,436
1
$68,950
0
$0
0
$0
Aggregated Statistics For Year 2006 (Based on 6 partial tracts)
A) FHA, FSA/RHS & VA Home Purchase Loans
B) Conventional Home Purchase Loans
C) Refinancings
D) Home Improvement Loans
F) Non-occupant Loans on < 5 Family Dwellings (A B C & D)
G) Loans On Manufactured Home Dwelling (A B C & D)
Number
Average Value
Number
Average Value
Number
Average Value
Number
Average Value
Number
Average Value
Number
Average Value
LOANS ORIGINATED
11
$204,226
179
$194,166
306
$166,831
120
$56,799
32
$137,775
3
$102,503
APPLICATIONS APPROVED, NOT ACCEPTED
1
$161,810
28
$195,204
51
$152,252
19
$52,097
6
$115,440
2
$80,800
APPLICATIONS DENIED
1
$106,840
50
$179,643
143
$163,746
65
$44,832
7
$139,243
11
$47,008
APPLICATIONS WITHDRAWN
2
$136,585
30
$207,415
109
$155,983
17
$55,829
3
$162,887
0
$0
FILES CLOSED FOR INCOMPLETENESS
0
$0
6
$174,488
20
$190,819
1
$165,490
3
$132,043
0
$0
Aggregated Statistics For Year 2005 (Based on 6 partial tracts)
A) FHA, FSA/RHS & VA Home Purchase Loans
B) Conventional Home Purchase Loans
C) Refinancings
D) Home Improvement Loans
F) Non-occupant Loans on < 5 Family Dwellings (A B C & D)
G) Loans On Manufactured Home Dwelling (A B C & D)
Number
Average Value
Number
Average Value
Number
Average Value
Number
Average Value
Number
Average Value
Number
Average Value
LOANS ORIGINATED
10
$154,574
169
$159,696
356
$153,245
100
$53,728
19
$147,428
8
$50,820
APPLICATIONS APPROVED, NOT ACCEPTED
3
$148,733
16
$174,034
57
$148,104
13
$39,626
5
$111,580
2
$127,945
APPLICATIONS DENIED
1
$97,610
42
$124,113
153
$146,194
60
$48,966
7
$135,484
8
$20,760
APPLICATIONS WITHDRAWN
2
$189,995
28
$171,051
168
$150,669
24
$139,524
5
$122,540
2
$17,350
FILES CLOSED FOR INCOMPLETENESS
1
$154,460
3
$88,597
30
$171,423
1
$19,010
0
$0
0
$0
Aggregated Statistics For Year 2004 (Based on 6 partial tracts)
A) FHA, FSA/RHS & VA Home Purchase Loans
B) Conventional Home Purchase Loans
C) Refinancings
D) Home Improvement Loans
F) Non-occupant Loans on < 5 Family Dwellings (A B C & D)
G) Loans On Manufactured Home Dwelling (A B C & D)
Number
Average Value
Number
Average Value
Number
Average Value
Number
Average Value
Number
Average Value
Number
Average Value
LOANS ORIGINATED
12
$142,775
178
$176,204
284
$126,066
102
$38,905
20
$121,050
3
$39,120
APPLICATIONS APPROVED, NOT ACCEPTED
3
$65,087
16
$167,574
64
$130,153
18
$42,748
6
$41,500
0
$0
APPLICATIONS DENIED
2
$208,305
34
$131,308
144
$126,489
65
$28,993
9
$93,900
12
$49,559
APPLICATIONS WITHDRAWN
0
$0
23
$190,582
120
$120,321
17
$96,974
4
$75,468
0
$0
FILES CLOSED FOR INCOMPLETENESS
0
$0
3
$220,100
23
$141,040
3
$47,347
1
$114,080
0
$0
Aggregated Statistics For Year 2003 (Based on 6 partial tracts)
A) FHA, FSA/RHS & VA Home Purchase Loans
B) Conventional Home Purchase Loans
C) Refinancings
D) Home Improvement Loans
E) Loans on Dwellings For 5+ Families
F) Non-occupant Loans on < 5 Family Dwellings (A B C & D)
Number
Average Value
Number
Average Value
Number
Average Value
Number
Average Value
Number
Average Value
Number
Average Value
LOANS ORIGINATED
18
$129,633
113
$140,520
526
$118,702
67
$29,244
1
$3,429,400
12
$67,609
APPLICATIONS APPROVED, NOT ACCEPTED
1
$120,420
11
$105,883
81
$113,153
19
$30,349
0
$0
2
$88,480
APPLICATIONS DENIED
1
$211,040
28
$90,521
154
$106,716
41
$24,960
0
$0
3
$51,083
APPLICATIONS WITHDRAWN
2
$119,335
8
$171,315
141
$118,241
5
$50,208
0
$0
3
$59,153
FILES CLOSED FOR INCOMPLETENESS
1
$182,020
3
$256,767
21
$124,303
1
$25,350
0
$0
0
$0
Aggregated Statistics For Year 2002 (Based on 6 partial tracts)
A) FHA, FSA/RHS & VA Home Purchase Loans
B) Conventional Home Purchase Loans
C) Refinancings
D) Home Improvement Loans
E) Loans on Dwellings For 5+ Families
F) Non-occupant Loans on < 5 Family Dwellings (A B C & D)
Number
Average Value
Number
Average Value
Number
Average Value
Number
Average Value
Number
Average Value
Number
Average Value
LOANS ORIGINATED
22
$2,101,550
91
$118,459
287
$169,023
81
$31,157
2
$1,796,920
17
$61,481
APPLICATIONS APPROVED, NOT ACCEPTED
1
$126,760
10
$156,094
48
$98,549
19
$36,497
0
$0
1
$64,010
APPLICATIONS DENIED
0
$0
24
$109,293
123
$100,315
50
$19,653
0
$0
3
$27,303
APPLICATIONS WITHDRAWN
0
$0
8
$93,316
95
$99,941
8
$36,929
0
$0
0
$0
FILES CLOSED FOR INCOMPLETENESS
0
$0
1
$129,300
26
$135,800
1
$59,580
0
$0
0
$0
Aggregated Statistics For Year 2001 (Based on 6 partial tracts)
A) FHA, FSA/RHS & VA Home Purchase Loans
B) Conventional Home Purchase Loans
C) Refinancings
D) Home Improvement Loans
F) Non-occupant Loans on < 5 Family Dwellings (A B C & D)
Number
Average Value
Number
Average Value
Number
Average Value
Number
Average Value
Number
Average Value
LOANS ORIGINATED
21
$104,505
86
$120,564
194
$98,744
70
$29,555
9
$58,191
APPLICATIONS APPROVED, NOT ACCEPTED
0
$0
10
$85,719
38
$90,093
14
$45,566
1
$65,950
APPLICATIONS DENIED
1
$69,720
22
$88,575
87
$76,246
41
$22,935
2
$71,255
APPLICATIONS WITHDRAWN
2
$93,125
7
$71,801
80
$82,035
13
$30,711
0
$0
FILES CLOSED FOR INCOMPLETENESS
0
$0
2
$102,055
15
$103,274
2
$43,670
1
$139,810
Aggregated Statistics For Year 2000 (Based on 6 partial tracts)
A) FHA, FSA/RHS & VA Home Purchase Loans
B) Conventional Home Purchase Loans
C) Refinancings
D) Home Improvement Loans
F) Non-occupant Loans on < 5 Family Dwellings (A B C & D)
Number
Average Value
Number
Average Value
Number
Average Value
Number
Average Value
Number
Average Value
LOANS ORIGINATED
19
$103,419
59
$102,852
67
$82,535
57
$21,861
5
$74,858
APPLICATIONS APPROVED, NOT ACCEPTED
1
$111,550
5
$91,654
20
$68,034
10
$34,844
0
$0
APPLICATIONS DENIED
0
$0
20
$59,160
70
$72,183
36
$13,966
4
$55,780
APPLICATIONS WITHDRAWN
3
$68,480
11
$98,912
37
$89,853
8
$29,879
1
$114,750
FILES CLOSED FOR INCOMPLETENESS
0
$0
1
$26,620
8
$93,762
0
$0
0
$0
Aggregated Statistics For Year 1999 (Based on 3 partial tracts)
A) FHA, FSA/RHS & VA Home Purchase Loans
B) Conventional Home Purchase Loans
C) Refinancings
D) Home Improvement Loans
F) Non-occupant Loans on < 5 Family Dwellings (A B C & D)
2003 - 2018 National Fire Incident Reporting System (NFIRS) incidents
According to the data from the years 2003 - 2018 the average number of fires per year is 39. The highest number of reported fire incidents - 59 took place in 2014, and the least - 8 in 2003. The data has an increasing trend.
When looking into fire subcategories, the most incidents belonged to: Structure Fires (61.6%), and Outside Fires (26.2%).
Fire incident types reported to NFIRS in Zip Code 08343


 Nearest zip codes: 08028, 08318, 08074, 08312, 08062, 08071.


 According to the data from the years 2003 - 2018 the average number of fires per year is 39. The highest number of reported fire incidents - 59 took place in 2014, and the least - 8 in 2003. The data has an increasing trend.
 When looking into fire subcategories, the most incidents belonged to: Structure Fires (61.6%), and Outside Fires (26.2%).