Estimated zip code population in 2022: 2,453 Zip code population in 2010: 2,347 Zip code population in 2000: 2,497
Houses and condos: 1,092 Renter-occupied apartments: 314
% of renters here:
36%
State:
35%
March 2022 cost of living index in zip code 08349: 96.7 (near average, U.S. average is 100)
Land area: 40.9 sq. mi. Water area: 2.9 sq. mi.
Population density: 60 people per square mile
(very low).
OSM Map
Google Map
MSN Map
OSM Map
General Map
Google Map
MSN Map
OSM Map
Google Map
MSN Map
OSM Map
Google Map
MSN Map
Please wait while loading the map...
Real estate property taxes paid for housing units in 2022:
This zip code:
2.4% ($3,542)
New Jersey:
2.1% ($8,897)
Median real estate property taxes paid for housing units with mortgages in 2022: $3,530 (2.2%) Median real estate property taxes paid for housing units with no mortgage in 2022: $3,555 (2.5%)
Business Search- 14 Million verified businesses
Males: 1,187
(48.4%)
Females: 1,266
(51.6%)
For population 25 years and over in 08349:
High school or higher: 88.2%
Bachelor's degree or higher: 5.7%
Graduate or professional degree: 0.2%
Unemployed: 4.7%
Mean travel time to work (commute): 29.1 minutes
For population 15 years and over in 08349:
Never married: 43.9%
Now married: 37.7%
Separated: 1.0%
Widowed: 7.2%
Divorced: 10.2%
Zip code 08349 compared to state average:
Median household income below state average.
Median house value significantly below state average.
Hispanic race population percentage below state average.
Median age below state average.
Foreign-born population percentage significantly below state average.
Length of stay since moving in significantly above state average.
House age above state average.
Percentage of population with a bachelor's degree or higher significantly below state average.
Averages for the 2020 tax year for zip code 08349, filed in 2021:
Average Adjusted Gross Income (AGI) in 2020: $46,280 (Individual Income Tax Returns)
Here:
$46,280
State:
$95,247
Salary/wage: $41,864 (reported on 82.1% of returns)
Here:
$41,864
State:
$80,635
(% of AGI for various income ranges: 1125.2% for AGIs below $25k, 3621.4% for AGIs $25k-50k, 5809.1% for AGIs $50k-75k, 10757.5% for AGIs $75k-100k, 16450.0% for AGIs $100k-200k)
Taxable interest for individuals: $260 (reported on 17.9% of returns)
This zip code:
$260
New Jersey:
$2,414
(% of AGI for various income ranges: 2.4% for AGIs below $25k, 1.0% for AGIs $25k-50k, 5.5% for AGIs $50k-75k, 7.5% for AGIs $75k-100k, 46.0% for AGIs $100k-200k)
Ordinary dividends: $1,229 (reported on 8.3% of returns)
Here:
$1,229
State:
$8,057
(% of AGI for various income ranges: 34.5% for AGIs $50k-75k, 96.0% for AGIs $100k-200k)
Net capital gain/loss in AGI: +$1,000 (reported on 7.1% of returns)
Here:
+$1,000
State:
+$25,022
(% of AGI for various income ranges: 22.4% for AGIs $25k-50k, 32.5% for AGIs $75k-100k)
Profit/loss from business: +$8,262 (reported on 9.5% of returns)
Here:
+$8,262
State:
+$18,035
(% of AGI for various income ranges: 199.0% for AGIs below $25k, 220.9% for AGIs $50k-75k)
Taxable individual retirement arrangement distribution: $5,925 (reported on 4.8% of returns)
08349:
$5,925
New Jersey:
$21,558
(% of AGI for various income ranges: 112.9% for AGIs $25k-50k)
Total itemized deductions: $24,700 (reported on 3.6% of returns)
Here:
$24,700
State:
$32,863
(% of AGI for various income ranges: 673.6% for AGIs $50k-75k)
Charity contributions: $6,333 (reported on 3.6% of returns)
Here:
$6,333
State:
$7,880
(% of AGI for various income ranges: 90.5% for AGIs $25k-50k)
Taxes paid: $6,433 (reported on 3.6% of returns)
08349:
$6,433
State:
$9,183
(% of AGI for various income ranges: 175.5% for AGIs $50k-75k)
Earned income credit: $2,312 (reported on 19.0% of returns)
Here:
$2,312
State:
$2,148
(% of AGI for various income ranges: 108.6% for AGIs below $25k, 67.6% for AGIs $25k-50k)
Percentage of individuals using paid preparers for their 2020 taxes: 91.7%
Here:
92%
State:
92%
(% for various income ranges: 89.3% for AGIs below $25k, 92.6% for AGIs $25k-50k, 85.7% for AGIs $50k-75k, 100.0% for AGIs $75k-100k, 100.0% for AGIs $100k-200k)
Averages for the 2012 tax year for zip code 08349, filed in 2013:
Average Adjusted Gross Income (AGI) in 2012: $40,380 (Individual Income Tax Returns)
Here:
$40,380
State:
$79,688
Salary/wage: $36,133 (reported on 85.2% of returns)
Here:
$36,133
State:
$68,122
(% of AGI for various income ranges: 68.8% for AGIs below $25k, 78.6% for AGIs $25k-50k, 76.2% for AGIs $50k-75k, 83.9% for AGIs $75k-100k, 73.9% for AGIs $100k-200k)
Taxable interest for individuals: $456 (reported on 22.2% of returns)
This zip code:
$456
New Jersey:
$2,193
(% of AGI for various income ranges: 0.5% for AGIs below $25k, 0.4% for AGIs $50k-75k, 0.2% for AGIs $100k-200k)
Ordinary dividends: $2,273 (reported on 13.6% of returns)
Here:
$2,273
State:
$6,828
(% of AGI for various income ranges: 0.1% for AGIs below $25k, 1.1% for AGIs $25k-50k, 1.4% for AGIs $50k-75k, 1.0% for AGIs $75k-100k)
Net capital gain/loss in AGI: +$880 (reported on 6.2% of returns)
Here:
+$880
State:
+$15,358
Profit/loss from business: +$8,014 (reported on 8.6% of returns)
Here:
+$8,014
State:
+$19,577
Taxable individual retirement arrangement distribution: $6,660 (reported on 6.2% of returns)
08349:
$6,660
New Jersey:
$18,214
Total itemized deductions: $17,280 (26% of AGI, reported on 24.7% of returns)
Here:
$17,280
State:
$30,827
Here:
25.6% of AGI
State:
21.2% of AGI
(% of AGI for various income ranges: 7.5% for AGIs below $25k, 9.1% for AGIs $25k-50k, 10.0% for AGIs $50k-75k, 11.9% for AGIs $75k-100k, 13.6% for AGIs $100k-200k)
Charity contributions: $2,538 (reported on 19.8% of returns)
Here:
$2,538
State:
$3,451
(% of AGI for various income ranges: 0.9% for AGIs below $25k, 1.0% for AGIs $25k-50k, 2.1% for AGIs $50k-75k, 1.5% for AGIs $100k-200k)
Taxes paid: $6,045 (reported on 24.7% of returns)
08349:
$6,045
State:
$15,801
(% of AGI for various income ranges: 2.7% for AGIs below $25k, 2.4% for AGIs $25k-50k, 3.2% for AGIs $50k-75k, 5.0% for AGIs $75k-100k, 5.4% for AGIs $100k-200k)
Earned income credit: $2,317 (reported on 22.2% of returns)
Here:
$2,317
State:
$2,182
(% of AGI for various income ranges: 6.8% for AGIs below $25k, 1.4% for AGIs $25k-50k)
Percentage of individuals using paid preparers for their 2012 taxes: 56.8%
Here:
57%
State:
65%
(% for various income ranges: 47.1% for AGIs below $25k, 60.9% for AGIs $25k-50k, 61.5% for AGIs $50k-75k, 60.0% for AGIs $75k-100k, 83.3% for AGIs $100k-200k)
Averages for the 2004 tax year for zip code 08349, filed in 2005:
Average Adjusted Gross Income (AGI) in 2004: $32,493 (Individual Income Tax Returns)
Here:
$32,493
State:
$64,921
Salary/wage: $31,962 (reported on 87.4% of returns)
Here:
$31,962
State:
$57,755
(% of AGI for various income ranges: 125.7% for AGIs below $10k, 77.6% for AGIs $10k-25k, 86.5% for AGIs $25k-50k, 85.4% for AGIs $50k-75k, 91.0% for AGIs $75k-100k, 79.3% for AGIs over 100k)
Taxable interest for individuals: $927 (reported on 32.3% of returns)
This zip code:
$927
New Jersey:
$2,068
(% of AGI for various income ranges: 3.3% for AGIs below $10k, 1.8% for AGIs $10k-25k, 0.5% for AGIs $25k-50k, 1.3% for AGIs $50k-75k, 0.4% for AGIs $75k-100k, 0.2% for AGIs over 100k)
Taxable dividends: $2,086 (reported on 13.7% of returns)
Here:
$2,086
State:
$3,959
(% of AGI for various income ranges: 0.9% for AGIs below $10k, 0.9% for AGIs $10k-25k, 0.7% for AGIs $25k-50k, 0.9% for AGIs $50k-75k, 1.7% for AGIs $75k-100k)
Net capital gain/loss: +$377 (reported on 8.2% of returns)
Here:
+$377
State:
+$13,591
(% of AGI for various income ranges: -0.0% for AGIs $10k-25k, 0.1% for AGIs $25k-50k, -0.1% for AGIs $50k-75k, 0.4% for AGIs $75k-100k)
Profit/loss from business: +$4,169 (reported on 8.4% of returns)
Here:
+$4,169
State:
+$17,520
(% of AGI for various income ranges: -1.0% for AGIs below $10k, 4.9% for AGIs $10k-25k, 0.3% for AGIs $25k-50k, 1.1% for AGIs $50k-75k)
Total itemized deductions: $13,005 (24% of AGI, reported on 25.1% of returns)
Here:
$13,005
State:
$23,924
Here:
24.5% of AGI
State:
21.1% of AGI
(% of AGI for various income ranges: 8.8% for AGIs $10k-25k, 10.3% for AGIs $25k-50k, 11.4% for AGIs $50k-75k, 8.5% for AGIs $75k-100k, 12.9% for AGIs over 100k)
Charity contributions deductions: $2,429 (4% of AGI, reported on 22.6% of returns)
Here:
$2,429
State:
$3,242
Here:
4.5% of AGI
State:
2.7% of AGI
(% of AGI for various income ranges: 1.0% for AGIs $10k-25k, 1.7% for AGIs $25k-50k, 2.0% for AGIs $50k-75k, 1.4% for AGIs $75k-100k, 3.2% for AGIs over 100k)
Total tax: $3,717 (reported on 66.4% of returns)
08349:
$3,717
State:
$12,321
(% of AGI for various income ranges: 2.4% for AGIs below $10k, 3.5% for AGIs $10k-25k, 5.7% for AGIs $25k-50k, 9.0% for AGIs $50k-75k, 11.1% for AGIs $75k-100k, 13.6% for AGIs over 100k)
Earned income credit: $1,744 (reported on 24.0% of returns)
Here:
$1,744
State:
$1,711
Percentage of individuals using paid preparers for their 2004 taxes: 61.3%
Here:
61%
State:
65%
(% for various income ranges: 53.3% for AGIs below $10k, 59.9% for AGIs $10k-25k, 63.0% for AGIs $25k-50k, 64.4% for AGIs $50k-75k, 74.5% for AGIs $75k-100k, 75.0% for AGIs over 100k)
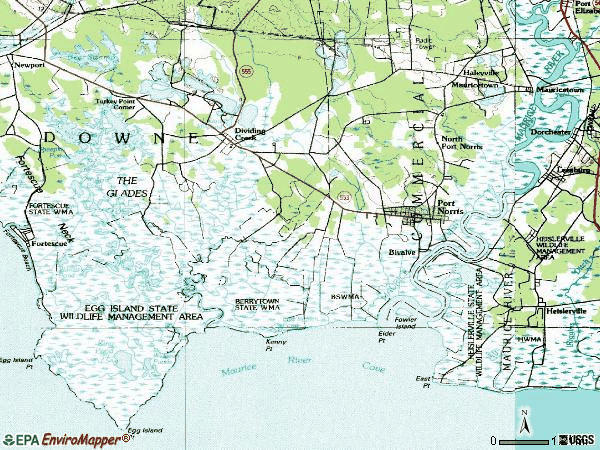
Notable locations in zip code 08349: Whitehead Station (A), Dividing Creek Station (B), Mauricetown Station (C), Port Norris Fire Company 1 (D), Dividing Creek Fire Company (E). Display/hide their locations on the map
Lakes, reservoirs, and swamps: East Branch Pond (A), Round Pond (B), Ladow Millpond (C), Buckshutem Swamp (D), Cub Swamp (E). Display/hide their locations on the map
Streams, rivers, and creeks: Lands Branch (A), Joshua Branch (B), Iron Mine Branch (C), Mill Creek (D), Hansey Creek (E), Haleys Branch (F), Dickeys Ditch (G), Ware Creek (H), Reubens Branch (I). Display/hide their locations on the map
In group quarters: 14 (-1 institutionalized population)
Size of family households: 223 2-persons, 134 3-persons, 153 4-persons, 53 5-persons, 14 7-or-more-persons
Size of nonfamily households: 238 1-person, 31 2-persons, 14 3-persons
342 married couples with children.
416 single-parent households (23 men, 393 women).
92.2% of residents of 08349 zip code speak English at home.
6.6% of residents speak Spanish at home (66% very well, 34% well).
0.4% of residents speak other Indo-European language at home (100% very well).
0.1% of residents speak other language at home (100% very well).
Foreign born population: 23 (1.0%) (65.4% of them are naturalized citizens)
This zip code:
1.0%
Whole state:
23.5%
61%France
35%Costa Rica
4%North Macedonia (Macedonia)
14%Irish
13%English
9%Italian
7%German
6%Scottish
5%American
1%African
Year of entry for the foreign-born population
242010 or later
72000 to 2009
11990 to 1999
13Before 1990
Facilities with environmental interests located in this zip code:
BIVALVE PACKING CO INC (MILLER AVENUE in PORT NORRIS, NJ)
STATE MASTER (New Jersey environmental info) - NJEMS-0602-02-0004.1, LAND USE - COASTAL AND LAND USE STATE MASTER (New Jersey environmental info) - NJEMS-05143100000, EPCRA, NJEMS-46132, National Pollutant Discharge Elimination System Permit National Pollutant Discharge Elimination System NON-MAJOR (Tracking pollutant discharge elimination systems) - permit Business SIC classification: PREPARED FRESH OR FROZEN FISH AND SEAFOODS Organizations: COMMERCIAL TWP, COMMERCIAL TWP (CONTACT/OWNER)
, HILLARD BLOOM/TALLMADGE BROS (CONTACT/OWNER)
Alternative names: COMMERCIAL TWP
PORT NORRIS MARINA (SHELLPILE RD in PORT NORRIS, NJ)
ENFORCEMENT/COMPLIANCE ACTIVITY (Integrated Compliance Information System) - ICIS-02-2004-0907, FORMAL ENFORCEMENT ACTION (Integrated Compliance Information System) - ICIS-02-2004-0907, FORMAL ENFORCEMENT ACTION STATE MASTER (New Jersey environmental info) - NJEMS-NRG100000269, HAZARDOUS WASTE PROGRAM Business SIC classification: MARINAS
BREWSTER VAULTS & MONUMENTS INC (1017 STEEP RUN RD in COMMERCIAL TWP, NJ)
STATE MASTER (New Jersey environmental info) - NJEMS-13902200000, EPCRA, NJEMS-195020, National Pollutant Discharge Elimination System Permit National Pollutant Discharge Elimination System NON-MAJOR (Tracking pollutant discharge elimination systems) - permit Business SIC classification: CONCRETE PRODUCTS, EXCEPT BLOCK AND BRICK; BURIAL CASKETS
PORT NORRIS EXPRESS (1788 NORTH AVE in COMMERCIAL TWP, NJ)
STATE MASTER (New Jersey environmental info) - NJEMS-004633, STATE CLEANUP SITE, NJEMS-195464, National Pollutant Discharge Elimination System Permit National Pollutant Discharge Elimination System NON-MAJOR (Tracking pollutant discharge elimination systems) - permit Business SIC classification: TRUCKING, EXCEPT LOCAL Organizations: PORT NORRIS EXPRESS CO INC
PORT NORRIS CENTRAL OFFICE (NOBEL & BATEMAN ST NW CORNER in PORT NORRIS, NJ)
(Resource Conservation and Recovery Act (tracking hazardous waste))
GF PETTINOS (PORT ELIZABETH in MAURICE RIVER, NJ)
AIR MINOR (AIRS/AFS) Business SIC classification: INDUSTRIAL SAND
PORT NORRIS EXRESS CO INC (270 NORTH AVE in PORT NORRIS, NJ)
TRANSPORTER (Resource Conservation and Recovery Act (tracking hazardous waste)) - notification Organizations: GARRISON GEORGE PRESIDENT (CONTACT/OWNER)
Housing units lacking complete kitchen facilities: 1.1%
62.1%Utility gas
21.5%Fuel oil, kerosene, etc.
10.4%Electricity
2.8%Wood
1.8%Other fuel
1.7%Bottled, tank, or LP gas
Population in 1990: 2,726.
Place of birth for U.S.-born residents:
This state: 1,749
Northeast: 490
Midwest: 18
South: 139
73% of the 08349 zip code residents lived in the same house 5 years ago. Out of people who lived in different houses, 81% lived in this county. Out of people who lived in different counties, 50% lived in New Jersey.
96% of the 08349 zip code residents lived in the same house 1 year ago. Out of people who lived in different houses, 80% moved from this county. Out of people who lived in different houses, 13% moved from different county within same state. Out of people who lived in different houses, 5% moved from different state.
Private vs. public school enrollment:
Students in private schools in grades 1 to 8 (elementary and middle school): 36
Here:
11.6%
New Jersey:
12.3%
Students in private schools in grades 9 to 12 (high school): 9
Here:
2.7%
New Jersey:
13.1%
Students in private undergraduate colleges: 18
Here:
11.6%
New Jersey:
33.2%
Occupation by median earnings in the past 12 months ($)
71,666Building and grounds cleaning and maintenance occupations
68,149Law enforcement workers including supervisors
59,098Health technologists and technicians
53,881Construction and extraction occupations
46,053Office and administrative support occupations
33,758Fire fighting and prevention, and other protective service workers including supervisors
Top industries in this zip code by the number of employees in 2005:
Wholesale Trade: Fish and Seafood Merchant Wholesalers (20-49 employees: 1 establishment, 10-19 employees: 1 establishment, 1-4 employees: 2 establishments)
Mining: Industrial Sand Mining (20-49: 1)
Other Services (except Public Administration): Religious Organizations (10-19: 1, 1-4: 1)
Other Services (except Public Administration): Other Social Advocacy Organizations (10-19: 1)
Accommodation and Food Services: Food Service Contractors (10-19: 1)
People in group quarters in 2010:
27 people in group homes intended for adults
3 people in college/university student housing
People in group quarters in 2000:
7 people in homes for the mentally ill
Home Mortgage Disclosure Act Aggregated Statistics For Year 2009 (Based on 8 partial tracts)
A) FHA, FSA/RHS & VA Home Purchase Loans
B) Conventional Home Purchase Loans
C) Refinancings
D) Home Improvement Loans
F) Non-occupant Loans on < 5 Family Dwellings (A B C & D)
G) Loans On Manufactured Home Dwelling (A B C & D)
Number
Average Value
Number
Average Value
Number
Average Value
Number
Average Value
Number
Average Value
Number
Average Value
LOANS ORIGINATED
42
$122,928
13
$136,541
93
$121,548
19
$50,068
9
$93,302
7
$80,606
APPLICATIONS APPROVED, NOT ACCEPTED
2
$175,130
5
$167,468
6
$91,802
0
$0
2
$84,000
0
$0
APPLICATIONS DENIED
7
$99,920
11
$126,835
75
$137,290
42
$27,391
12
$54,501
4
$110,318
APPLICATIONS WITHDRAWN
6
$113,603
5
$116,158
35
$141,117
2
$43,370
1
$57,640
2
$103,115
FILES CLOSED FOR INCOMPLETENESS
1
$80,700
0
$0
12
$151,771
1
$13,720
0
$0
0
$0
Aggregated Statistics For Year 2008 (Based on 8 partial tracts)
A) FHA, FSA/RHS & VA Home Purchase Loans
B) Conventional Home Purchase Loans
C) Refinancings
D) Home Improvement Loans
F) Non-occupant Loans on < 5 Family Dwellings (A B C & D)
G) Loans On Manufactured Home Dwelling (A B C & D)
Number
Average Value
Number
Average Value
Number
Average Value
Number
Average Value
Number
Average Value
Number
Average Value
LOANS ORIGINATED
44
$143,002
28
$137,486
112
$125,021
34
$61,657
18
$95,417
5
$81,958
APPLICATIONS APPROVED, NOT ACCEPTED
2
$114,120
5
$102,694
26
$113,900
10
$36,635
3
$95,267
1
$89,210
APPLICATIONS DENIED
10
$134,553
6
$125,647
121
$126,302
50
$43,094
13
$100,270
19
$92,763
APPLICATIONS WITHDRAWN
7
$142,384
2
$167,580
58
$124,937
4
$94,395
2
$94,195
0
$0
FILES CLOSED FOR INCOMPLETENESS
2
$138,815
2
$192,485
12
$153,987
0
$0
1
$158,110
0
$0
Aggregated Statistics For Year 2007 (Based on 8 partial tracts)
A) FHA, FSA/RHS & VA Home Purchase Loans
B) Conventional Home Purchase Loans
C) Refinancings
D) Home Improvement Loans
F) Non-occupant Loans on < 5 Family Dwellings (A B C & D)
G) Loans On Manufactured Home Dwelling (A B C & D)
Number
Average Value
Number
Average Value
Number
Average Value
Number
Average Value
Number
Average Value
Number
Average Value
LOANS ORIGINATED
26
$119,203
63
$127,414
164
$125,378
60
$43,153
31
$87,060
13
$77,983
APPLICATIONS APPROVED, NOT ACCEPTED
2
$119,325
7
$187,077
38
$117,180
9
$35,352
3
$54,067
0
$0
APPLICATIONS DENIED
7
$135,176
29
$99,397
177
$116,461
83
$41,488
15
$79,738
10
$73,077
APPLICATIONS WITHDRAWN
6
$146,963
12
$149,918
82
$118,519
8
$92,134
7
$128,016
1
$92,690
FILES CLOSED FOR INCOMPLETENESS
2
$161,045
1
$254,740
20
$145,411
0
$0
0
$0
0
$0
Aggregated Statistics For Year 2006 (Based on 8 partial tracts)
A) FHA, FSA/RHS & VA Home Purchase Loans
B) Conventional Home Purchase Loans
C) Refinancings
D) Home Improvement Loans
F) Non-occupant Loans on < 5 Family Dwellings (A B C & D)
G) Loans On Manufactured Home Dwelling (A B C & D)
Number
Average Value
Number
Average Value
Number
Average Value
Number
Average Value
Number
Average Value
Number
Average Value
LOANS ORIGINATED
19
$131,142
98
$112,732
206
$109,763
87
$50,669
33
$86,758
10
$69,484
APPLICATIONS APPROVED, NOT ACCEPTED
1
$87,290
13
$125,068
45
$93,917
17
$57,342
5
$98,408
6
$77,028
APPLICATIONS DENIED
8
$103,950
36
$94,660
169
$117,627
95
$44,560
18
$62,994
25
$75,685
APPLICATIONS WITHDRAWN
7
$84,577
23
$106,930
104
$111,559
15
$79,708
4
$150,750
6
$68,165
FILES CLOSED FOR INCOMPLETENESS
0
$0
4
$139,570
30
$110,753
2
$70,905
3
$135,787
0
$0
Aggregated Statistics For Year 2005 (Based on 8 partial tracts)
A) FHA, FSA/RHS & VA Home Purchase Loans
B) Conventional Home Purchase Loans
C) Refinancings
D) Home Improvement Loans
E) Loans on Dwellings For 5+ Families
F) Non-occupant Loans on < 5 Family Dwellings (A B C & D)
G) Loans On Manufactured Home Dwelling (A B C & D)
Number
Average Value
Number
Average Value
Number
Average Value
Number
Average Value
Number
Average Value
Number
Average Value
Number
Average Value
LOANS ORIGINATED
17
$98,159
81
$105,058
196
$96,288
49
$43,267
0
$0
19
$54,981
9
$34,786
APPLICATIONS APPROVED, NOT ACCEPTED
0
$0
16
$89,014
39
$82,387
3
$89,120
0
$0
3
$58,193
3
$74,743
APPLICATIONS DENIED
2
$138,935
68
$83,129
208
$85,193
89
$31,500
0
$0
22
$47,196
21
$50,000
APPLICATIONS WITHDRAWN
3
$92,873
16
$92,863
174
$98,669
22
$70,003
1
$38,430
9
$85,746
5
$73,866
FILES CLOSED FOR INCOMPLETENESS
1
$126,290
2
$41,710
21
$86,980
0
$0
0
$0
1
$66,040
1
$55,610
Aggregated Statistics For Year 2004 (Based on 8 partial tracts)
A) FHA, FSA/RHS & VA Home Purchase Loans
B) Conventional Home Purchase Loans
C) Refinancings
D) Home Improvement Loans
F) Non-occupant Loans on < 5 Family Dwellings (A B C & D)
G) Loans On Manufactured Home Dwelling (A B C & D)
Number
Average Value
Number
Average Value
Number
Average Value
Number
Average Value
Number
Average Value
Number
Average Value
LOANS ORIGINATED
13
$84,028
85
$92,957
159
$84,049
44
$30,981
40
$74,142
10
$40,490
APPLICATIONS APPROVED, NOT ACCEPTED
0
$0
8
$89,559
27
$91,898
9
$42,411
5
$85,770
2
$79,125
APPLICATIONS DENIED
6
$95,688
24
$77,015
175
$78,136
73
$35,447
13
$35,849
16
$44,828
APPLICATIONS WITHDRAWN
6
$79,465
21
$84,352
102
$84,756
16
$57,446
11
$84,640
2
$51,540
FILES CLOSED FOR INCOMPLETENESS
0
$0
2
$97,445
3
$62,417
1
$34,760
1
$42,820
0
$0
Aggregated Statistics For Year 2003 (Based on 8 partial tracts)
A) FHA, FSA/RHS & VA Home Purchase Loans
B) Conventional Home Purchase Loans
C) Refinancings
D) Home Improvement Loans
F) Non-occupant Loans on < 5 Family Dwellings (A B C & D)
Number
Average Value
Number
Average Value
Number
Average Value
Number
Average Value
Number
Average Value
LOANS ORIGINATED
25
$69,324
65
$75,422
213
$76,609
25
$30,495
37
$57,021
APPLICATIONS APPROVED, NOT ACCEPTED
2
$33,145
10
$88,495
36
$67,449
8
$21,514
5
$77,960
APPLICATIONS DENIED
6
$54,068
34
$57,134
160
$67,970
51
$17,243
16
$51,417
APPLICATIONS WITHDRAWN
6
$63,723
15
$66,383
90
$80,028
9
$30,222
4
$36,910
FILES CLOSED FOR INCOMPLETENESS
5
$56,668
3
$140,973
18
$87,047
1
$40,080
1
$44,030
Aggregated Statistics For Year 2002 (Based on 8 partial tracts)
A) FHA, FSA/RHS & VA Home Purchase Loans
B) Conventional Home Purchase Loans
C) Refinancings
D) Home Improvement Loans
F) Non-occupant Loans on < 5 Family Dwellings (A B C & D)
Number
Average Value
Number
Average Value
Number
Average Value
Number
Average Value
Number
Average Value
LOANS ORIGINATED
32
$75,708
48
$81,402
139
$208,667
39
$29,098
23
$54,792
APPLICATIONS APPROVED, NOT ACCEPTED
1
$74,150
11
$67,130
57
$64,037
9
$22,336
3
$42,037
APPLICATIONS DENIED
3
$79,723
22
$53,456
139
$64,876
31
$15,727
10
$40,638
APPLICATIONS WITHDRAWN
3
$72,467
12
$69,927
77
$60,033
11
$23,086
6
$58,358
FILES CLOSED FOR INCOMPLETENESS
0
$0
3
$76,430
13
$59,618
0
$0
2
$59,005
Aggregated Statistics For Year 2001 (Based on 8 partial tracts)
A) FHA, FSA/RHS & VA Home Purchase Loans
B) Conventional Home Purchase Loans
C) Refinancings
D) Home Improvement Loans
F) Non-occupant Loans on < 5 Family Dwellings (A B C & D)
Number
Average Value
Number
Average Value
Number
Average Value
Number
Average Value
Number
Average Value
LOANS ORIGINATED
18
$68,449
41
$68,594
96
$66,234
25
$15,416
15
$55,611
APPLICATIONS APPROVED, NOT ACCEPTED
0
$0
7
$67,471
40
$52,969
7
$33,979
1
$34,760
APPLICATIONS DENIED
1
$69,720
21
$65,617
144
$57,503
32
$17,682
6
$55,523
APPLICATIONS WITHDRAWN
3
$76,397
4
$73,452
86
$65,804
14
$21,281
1
$50,510
FILES CLOSED FOR INCOMPLETENESS
1
$78,780
1
$43,920
27
$65,653
0
$0
0
$0
Aggregated Statistics For Year 2000 (Based on 8 partial tracts)
A) FHA, FSA/RHS & VA Home Purchase Loans
B) Conventional Home Purchase Loans
C) Refinancings
D) Home Improvement Loans
F) Non-occupant Loans on < 5 Family Dwellings (A B C & D)
Number
Average Value
Number
Average Value
Number
Average Value
Number
Average Value
Number
Average Value
LOANS ORIGINATED
26
$65,958
53
$64,277
68
$49,176
15
$23,414
5
$38,994
APPLICATIONS APPROVED, NOT ACCEPTED
5
$58,320
10
$49,818
24
$57,669
17
$22,415
3
$77,233
APPLICATIONS DENIED
3
$85,817
29
$51,010
95
$46,783
36
$22,779
5
$48,908
APPLICATIONS WITHDRAWN
3
$89,070
13
$70,396
47
$57,521
4
$37,788
1
$72,990
FILES CLOSED FOR INCOMPLETENESS
3
$65,660
2
$44,515
11
$73,988
0
$0
0
$0
Aggregated Statistics For Year 1999 (Based on 4 partial tracts)
A) FHA, FSA/RHS & VA Home Purchase Loans
B) Conventional Home Purchase Loans
C) Refinancings
D) Home Improvement Loans
F) Non-occupant Loans on < 5 Family Dwellings (A B C & D)
Detailed PMIC statistics for the following Tracts:0102.00
, 0103.00
2002 - 2018 National Fire Incident Reporting System (NFIRS) incidents
According to the data from the years 2002 - 2018 the average number of fires per year is 13. The highest number of reported fire incidents - 21 took place in 2007, and the least - 3 in 2002. The data has an increasing trend.
When looking into fire subcategories, the most incidents belonged to: Structure Fires (57.6%), and Outside Fires (25.8%).
Fire incident types reported to NFIRS in Zip Code 08349


 Nearest zip codes: 08329, 08321, 08345, 08324, 08348, 08327.


 According to the data from the years 2002 - 2018 the average number of fires per year is 13. The highest number of reported fire incidents - 21 took place in 2007, and the least - 3 in 2002. The data has an increasing trend.
 When looking into fire subcategories, the most incidents belonged to: Structure Fires (57.6%), and Outside Fires (25.8%).