Estimated zip code population in 2022: 4,189 Zip code population in 2010: 3,818 Zip code population in 2000: 3,656
Houses and condos: 1,566 Renter-occupied apartments: 198
% of renters here:
13%
State:
35%
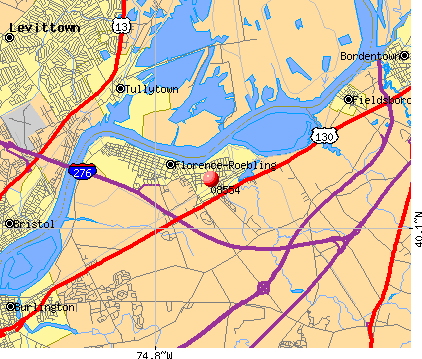
March 2022 cost of living index in zip code 08554: 100.8 (near average, U.S. average is 100)
Land area: 1.1 sq. mi. Water area: 0.2 sq. mi.
Population density: 3,963 people per square mile
(average).
OSM Map
Google Map
MSN Map
OSM Map
General Map
Google Map
MSN Map
OSM Map
Google Map
MSN Map
OSM Map
Google Map
MSN Map
Please wait while loading the map...
Real estate property taxes paid for housing units in 2022:
This zip code:
2.2% ($4,388)
New Jersey:
2.1% ($8,897)
Median real estate property taxes paid for housing units with mortgages in 2022: $4,556 (2.2%) Median real estate property taxes paid for housing units with no mortgage in 2022: $3,866 (2.0%)
Business Search- 14 Million verified businesses
Males: 2,174
(51.9%)
Females: 2,014
(48.1%)
For population 25 years and over in 08554:
High school or higher: 93.5%
Bachelor's degree or higher: 29.5%
Graduate or professional degree: 5.9%
Unemployed: 2.5%
Mean travel time to work (commute): 24.9 minutes
For population 15 years and over in 08554:
Never married: 42.4%
Now married: 41.6%
Separated: 2.1%
Widowed: 6.2%
Divorced: 7.7%
Zip code 08554 compared to state average:
Median house value below state average.
Unemployed percentage below state average.
Black race population percentage below state average.
Hispanic race population percentage below state average.
Foreign-born population percentage below state average.
Renting percentage significantly below state average.
Length of stay since moving in significantly above state average.
House age above state average.
Percentage of population with a bachelor's degree or higher below state average.
Estimated median house/condo value in 2022: $201,307
08554:
$201,307
New Jersey:
$428,900
According to our research of New Jersey and other state lists, there were 2 registered sex offenders living in 08554 zip code as of May 28, 2024. The ratio of all residents to sex offenders in zip code 08554 is 1,985 to 1. The ratio of registered sex offenders to all residents in this zip code is near the state average.
Median resident age:
This zip code:
38.6 years
New Jersey median age:
40.4 years
Average household size:
This zip code:
2.7 people
New Jersey:
2.6 people
Averages for the 2020 tax year for zip code 08554, filed in 2021:
Average Adjusted Gross Income (AGI) in 2020: $60,223 (Individual Income Tax Returns)
Here:
$60,223
State:
$95,247
Salary/wage: $53,237 (reported on 86.1% of returns)
Here:
$53,237
State:
$80,635
(% of AGI for various income ranges: 1191.8% for AGIs below $25k, 3737.8% for AGIs $25k-50k, 6455.4% for AGIs $50k-75k, 9725.0% for AGIs $75k-100k, 15710.0% for AGIs $100k-200k)
Taxable interest for individuals: $515 (reported on 24.7% of returns)
This zip code:
$515
New Jersey:
$2,414
(% of AGI for various income ranges: 7.2% for AGIs below $25k, 7.6% for AGIs $25k-50k, 18.2% for AGIs $50k-75k, 27.9% for AGIs $75k-100k, 51.1% for AGIs $100k-200k)
Ordinary dividends: $1,893 (reported on 14.4% of returns)
Here:
$1,893
State:
$8,057
(% of AGI for various income ranges: 20.8% for AGIs below $25k, 5.9% for AGIs $25k-50k, 22.5% for AGIs $50k-75k, 54.3% for AGIs $75k-100k, 149.5% for AGIs $100k-200k)
Net capital gain/loss in AGI: +$3,755 (reported on 11.3% of returns)
Here:
+$3,755
State:
+$25,022
(% of AGI for various income ranges: 3.5% for AGIs below $25k, 2.0% for AGIs $25k-50k, 36.1% for AGIs $50k-75k, 65.7% for AGIs $75k-100k, 126.3% for AGIs $100k-200k)
Profit/loss from business: +$9,105 (reported on 11.3% of returns)
Here:
+$9,105
State:
+$18,035
(% of AGI for various income ranges: 11.0% for AGIs below $25k, 37.6% for AGIs $25k-50k, 110.4% for AGIs $50k-75k, 230.0% for AGIs $75k-100k, 617.9% for AGIs $100k-200k)
Taxable individual retirement arrangement distribution: $16,654 (reported on 6.7% of returns)
08554:
$16,654
New Jersey:
$21,558
(% of AGI for various income ranges: 51.7% for AGIs below $25k, 76.3% for AGIs $25k-50k, 81.1% for AGIs $50k-75k, 206.4% for AGIs $75k-100k, 594.2% for AGIs $100k-200k)
Total itemized deductions: $22,035 (reported on 8.8% of returns)
Here:
$22,035
State:
$32,863
(% of AGI for various income ranges: 165.4% for AGIs $25k-50k, 414.6% for AGIs $50k-75k, 559.3% for AGIs $75k-100k, 591.6% for AGIs $100k-200k)
Charity contributions: $4,275 (reported on 6.2% of returns)
Here:
$4,275
State:
$7,880
(% of AGI for various income ranges: 24.5% for AGIs below $25k, 38.6% for AGIs $50k-75k, 90.0% for AGIs $75k-100k, 95.3% for AGIs $100k-200k)
Taxes paid: $8,112 (reported on 8.8% of returns)
08554:
$8,112
State:
$9,183
(% of AGI for various income ranges: 54.1% for AGIs $25k-50k, 145.7% for AGIs $50k-75k, 225.0% for AGIs $75k-100k, 228.4% for AGIs $100k-200k)
Earned income credit: $2,041 (reported on 13.9% of returns)
Here:
$2,041
State:
$2,148
(% of AGI for various income ranges: 66.5% for AGIs below $25k, 69.5% for AGIs $25k-50k)
Percentage of individuals using paid preparers for their 2020 taxes: 94.8%
Here:
95%
State:
92%
(% for various income ranges: 94.2% for AGIs below $25k, 96.2% for AGIs $25k-50k, 94.6% for AGIs $50k-75k, 90.9% for AGIs $75k-100k, 96.4% for AGIs $100k-200k, 100.0% for AGIs over 200k)
Averages for the 2012 tax year for zip code 08554, filed in 2013:
Average Adjusted Gross Income (AGI) in 2012: $54,500 (Individual Income Tax Returns)
Here:
$54,500
State:
$79,688
Salary/wage: $50,161 (reported on 87.1% of returns)
Here:
$50,161
State:
$68,122
(% of AGI for various income ranges: 70.8% for AGIs below $25k, 83.0% for AGIs $25k-50k, 80.7% for AGIs $50k-75k, 76.9% for AGIs $75k-100k, 82.2% for AGIs $100k-200k)
Taxable interest for individuals: $748 (reported on 32.8% of returns)
This zip code:
$748
New Jersey:
$2,193
(% of AGI for various income ranges: 1.0% for AGIs below $25k, 0.3% for AGIs $25k-50k, 0.4% for AGIs $50k-75k, 0.6% for AGIs $75k-100k, 0.3% for AGIs $100k-200k)
Ordinary dividends: $1,291 (reported on 17.2% of returns)
Here:
$1,291
State:
$6,828
(% of AGI for various income ranges: 0.8% for AGIs below $25k, 0.2% for AGIs $25k-50k, 0.3% for AGIs $50k-75k, 0.6% for AGIs $75k-100k, 0.4% for AGIs $100k-200k)
Net capital gain/loss in AGI: +$433 (reported on 9.7% of returns)
Here:
+$433
State:
+$15,358
(% of AGI for various income ranges: 0.3% for AGIs $100k-200k)
Profit/loss from business: +$8,328 (reported on 9.7% of returns)
Here:
+$8,328
State:
+$19,577
(% of AGI for various income ranges: 4.9% for AGIs below $25k, 2.3% for AGIs $25k-50k, 1.2% for AGIs $50k-75k, 0.9% for AGIs $75k-100k, 0.9% for AGIs $100k-200k)
Taxable individual retirement arrangement distribution: $11,440 (reported on 8.1% of returns)
08554:
$11,440
New Jersey:
$18,214
(% of AGI for various income ranges: 2.3% for AGIs below $25k, 1.3% for AGIs $25k-50k, 2.1% for AGIs $50k-75k, 4.4% for AGIs $75k-100k)
Total itemized deductions: $18,833 (23% of AGI, reported on 42.5% of returns)
Here:
$18,833
State:
$30,827
Here:
23.1% of AGI
State:
21.2% of AGI
(% of AGI for various income ranges: 12.1% for AGIs below $25k, 14.4% for AGIs $25k-50k, 15.1% for AGIs $50k-75k, 14.8% for AGIs $75k-100k, 15.0% for AGIs $100k-200k)
Charity contributions: $1,932 (reported on 33.3% of returns)
Here:
$1,932
State:
$3,451
(% of AGI for various income ranges: 0.4% for AGIs below $25k, 1.2% for AGIs $25k-50k, 1.3% for AGIs $50k-75k, 1.3% for AGIs $75k-100k, 1.2% for AGIs $100k-200k)
Taxes paid: $7,685 (reported on 42.5% of returns)
08554:
$7,685
State:
$15,801
(% of AGI for various income ranges: 3.1% for AGIs below $25k, 4.2% for AGIs $25k-50k, 6.0% for AGIs $50k-75k, 5.8% for AGIs $75k-100k, 7.5% for AGIs $100k-200k)
Earned income credit: $2,215 (reported on 14.5% of returns)
Here:
$2,215
State:
$2,182
(% of AGI for various income ranges: 5.5% for AGIs below $25k, 1.2% for AGIs $25k-50k)
Percentage of individuals using paid preparers for their 2012 taxes: 55.9%
Here:
56%
State:
65%
(% for various income ranges: 50.0% for AGIs below $25k, 53.2% for AGIs $25k-50k, 61.8% for AGIs $50k-75k, 56.5% for AGIs $75k-100k, 66.7% for AGIs $100k-200k)
Averages for the 2004 tax year for zip code 08554, filed in 2005:
Average Adjusted Gross Income (AGI) in 2004: $43,929 (Individual Income Tax Returns)
Here:
$43,929
State:
$64,921
Salary/wage: $42,615 (reported on 88.4% of returns)
Here:
$42,615
State:
$57,755
(% of AGI for various income ranges: 91.8% for AGIs below $10k, 74.8% for AGIs $10k-25k, 85.9% for AGIs $25k-50k, 84.5% for AGIs $50k-75k, 89.8% for AGIs $75k-100k, 87.1% for AGIs over 100k)
Taxable interest for individuals: $729 (reported on 45.0% of returns)
This zip code:
$729
New Jersey:
$2,068
(% of AGI for various income ranges: 5.1% for AGIs below $10k, 1.5% for AGIs $10k-25k, 1.0% for AGIs $25k-50k, 0.8% for AGIs $50k-75k, 0.3% for AGIs $75k-100k, 0.3% for AGIs over 100k)
Taxable dividends: $1,038 (reported on 20.6% of returns)
Here:
$1,038
State:
$3,959
(% of AGI for various income ranges: 1.9% for AGIs below $10k, 1.1% for AGIs $10k-25k, 0.5% for AGIs $25k-50k, 0.6% for AGIs $50k-75k, 0.3% for AGIs $75k-100k, 0.3% for AGIs over 100k)
Net capital gain/loss: +$2,450 (reported on 11.8% of returns)
Here:
+$2,450
State:
+$13,591
(% of AGI for various income ranges: -1.3% for AGIs below $10k, 0.3% for AGIs $10k-25k, 0.3% for AGIs $25k-50k, -0.1% for AGIs $50k-75k, 0.7% for AGIs $75k-100k, 2.1% for AGIs over 100k)
Profit/loss from business: +$8,606 (reported on 8.3% of returns)
Here:
+$8,606
State:
+$17,520
(% of AGI for various income ranges: 3.7% for AGIs below $10k, 2.6% for AGIs $10k-25k, 1.6% for AGIs $25k-50k, 1.5% for AGIs $50k-75k, 2.1% for AGIs $75k-100k, 0.9% for AGIs over 100k)
IRA payment deduction: $2,464 (reported on 1.4% of returns)
08554:
$2,464
New Jersey:
$3,270
Total itemized deductions: $14,947 (22% of AGI, reported on 41.9% of returns)
Here:
$14,947
State:
$23,924
Here:
22.5% of AGI
State:
21.1% of AGI
(% of AGI for various income ranges: 18.7% for AGIs below $10k, 10.9% for AGIs $10k-25k, 13.9% for AGIs $25k-50k, 14.9% for AGIs $50k-75k, 14.7% for AGIs $75k-100k, 14.6% for AGIs over 100k)
Charity contributions deductions: $1,796 (3% of AGI, reported on 37.5% of returns)
Here:
$1,796
State:
$3,242
Here:
2.6% of AGI
State:
2.7% of AGI
(% of AGI for various income ranges: 1.0% for AGIs below $10k, 0.6% for AGIs $10k-25k, 1.4% for AGIs $25k-50k, 1.7% for AGIs $50k-75k, 1.8% for AGIs $75k-100k, 1.7% for AGIs over 100k)
Total tax: $5,318 (reported on 80.1% of returns)
08554:
$5,318
State:
$12,321
(% of AGI for various income ranges: 1.8% for AGIs below $10k, 4.2% for AGIs $10k-25k, 7.5% for AGIs $25k-50k, 9.5% for AGIs $50k-75k, 10.4% for AGIs $75k-100k, 14.0% for AGIs over 100k)
Earned income credit: $1,624 (reported on 10.4% of returns)
Here:
$1,624
State:
$1,711
Percentage of individuals using paid preparers for their 2004 taxes: 56.8%
Here:
57%
State:
65%
(% for various income ranges: 46.6% for AGIs below $10k, 54.0% for AGIs $10k-25k, 57.3% for AGIs $25k-50k, 63.4% for AGIs $50k-75k, 62.5% for AGIs $75k-100k, 61.6% for AGIs over 100k)
Likely homosexual households (counted as self-reported same-sex unmarried-partner households)
Lesbian couples: 0.0% of all households
Gay men: 0.6% of all households
Household received Food Stamps/SNAP in the past 12 months: 125 Household did not receive Food Stamps/SNAP in the past 12 months: 1,439
Women who had a birth in the past 12 months: 21 (8 now married, 13 unmarried) Women who did not have a birth in the past 12 months: 954 (402 now married, 551 unmarried)
Housing units in zip code 08554 with a mortgage: 989 (80 second mortgage, 47 both second mortgage and home equity loan) Median monthly owner costs for units with a mortgage: $1,442 Median monthly owner costs for units without a mortgage: $680
Residents with income below the poverty level in 2022:
This zip code:
9.1%
Whole state:
9.7%
Residents with income below 50% of the poverty level in 2022:
This zip code:
7.1%
Whole state:
5.2%
Median number of rooms in houses and condos:
Here:
6.4
State:
6.8
Median number of rooms in apartments:
Here:
4.3
State:
3.9
Notable locations in this zip code not listed on our city pages
In group quarters: 4 (-1 institutionalized population)
Size of family households: 360 2-persons, 179 3-persons, 255 4-persons, 65 5-persons, 73 6-persons, 44 7-or-more-persons
Size of nonfamily households: 471 1-person, 116 2-persons, 6 3-persons
495 married couples with children.
495 single-parent households (9 men, 486 women).
85.1% of residents of 08554 zip code speak English at home.
2.9% of residents speak Spanish at home (72% well, 28% not well).
10.0% of residents speak other Indo-European language at home (51% very well, 36% well, 8% not well, 5% not at all).
0.4% of residents speak Asian or Pacific Island language at home (100% well).
1.0% of residents speak other language at home (57% very well, 25% well, 18% not well).
Foreign born population: 437 (10.4%) (88.0% of them are naturalized citizens)
This zip code:
10.4%
Whole state:
23.5%
84%Afghanistan
8%El Salvador
8%Cabo Verde
3%Malaysia
2%Poland
2%Dominica
11%Italian
10%Hungarian
9%Irish
7%English
6%Polish
2%German
2%Czechoslovakian
Year of entry for the foreign-born population
2062010 or later
2272000 to 2009
101990 to 1999
20Before 1990
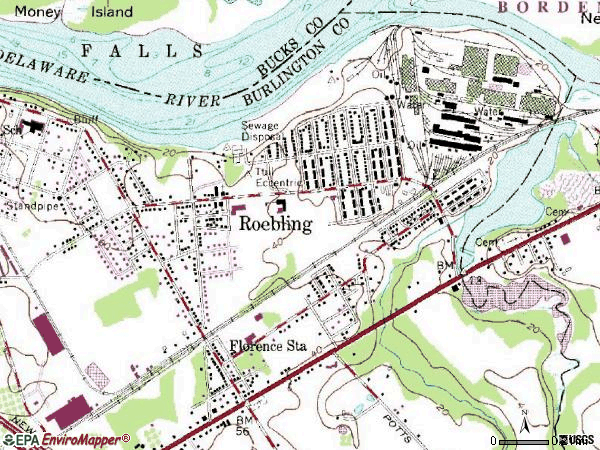
Facilities with environmental interests located in this zip code:
HOLY ASSUMPTION CHURCH & SCHOOL (1238 HORNBERGER AVENUE in ROEBLING, NJ)
COMPLIANCE ACTIVITY (Tracking inspections of insecticide, fungicide, and rodenticide, and toxic substances) STATE MASTER (New Jersey environmental info) - NJEMS-032321, STATE CLEANUP SITE, NJEMS-032322, NJEMS-45990, AIR PROGRAM Alternative names: HOLY ASSUMPTION SCHOOL
NUMBER 5 ROEBLING (1330 HORNBERGER AVE. in ROEBLING, NJ)
(National Center for Education Statistics) - STATE ID-070 Organizations: FLORENCE TWP (SCHOOL DISTRICT)
B & P AUTO REPAIR (1640 HORNBERGER AVE in ROEBLING, NJ)
(Resource Conservation and Recovery Act (tracking hazardous waste))
72.2%Utility gas
15.1%Fuel oil, kerosene, etc.
10.5%Electricity
1.7%Bottled, tank, or LP gas
0.6%Other fuel
Population in 1990: 3,826.
Place of birth for U.S.-born residents:
This state: 2,710
Northeast: 541
Midwest: 20
South: 433
West: 21
73% of the 08554 zip code residents lived in the same house 5 years ago. Out of people who lived in different houses, 64% lived in this county. Out of people who lived in different counties, 50% lived in New Jersey.
87% of the 08554 zip code residents lived in the same house 1 year ago. Out of people who lived in different houses, 54% moved from this county. Out of people who lived in different houses, 24% moved from different county within same state. Out of people who lived in different houses, 13% moved from different state. Out of people who lived in different houses, 4% moved from abroad.
Private vs. public school enrollment:
Students in private schools in grades 1 to 8 (elementary and middle school): 56
Here:
11.2%
New Jersey:
12.3%
Students in private schools in grades 9 to 12 (high school): 83
Here:
28.8%
New Jersey:
13.1%
Students in private undergraduate colleges:
Here:
0.0%
New Jersey:
33.2%
Occupation by median earnings in the past 12 months ($)
121,239Life, physical, and social science occupations
100,707Computer and mathematical occupations
86,073Health diagnosing and treating practitioners and other technical occupations
78,112Management occupations
70,150Business and financial operations occupations
68,236Transportation occupations
Top industries in this zip code by the number of employees in 2005:
Educational Services: Elementary and Secondary Schools (20-49 employees: 1 establishment)
Mining: Other Crushed and Broken Stone Mining and Quarrying (20-49: 1)
Finance and Insurance: Savings Institutions (10-19: 1, 5-9: 2)
Information: Libraries and Archives (10-19: 1)
Finance and Insurance: Commercial Banking (5-9: 1)
Accommodation and Food Services: Full-Service Restaurants (5-9: 1)
Administrative and Support and Waste Management and Remediation Services: Landscaping Services (1-4: 3)
Home Mortgage Disclosure Act Aggregated Statistics For Year 2009 (Based on 2 partial tracts)
A) FHA, FSA/RHS & VA Home Purchase Loans
B) Conventional Home Purchase Loans
C) Refinancings
D) Home Improvement Loans
F) Non-occupant Loans on < 5 Family Dwellings (A B C & D)
Number
Average Value
Number
Average Value
Number
Average Value
Number
Average Value
Number
Average Value
LOANS ORIGINATED
36
$153,409
24
$140,247
98
$162,576
15
$58,228
3
$73,773
APPLICATIONS APPROVED, NOT ACCEPTED
1
$256,970
1
$225,780
12
$156,586
0
$0
0
$0
APPLICATIONS DENIED
7
$142,386
0
$0
34
$178,554
7
$39,681
3
$64,863
APPLICATIONS WITHDRAWN
1
$218,350
0
$0
18
$192,112
3
$69,320
0
$0
FILES CLOSED FOR INCOMPLETENESS
0
$0
0
$0
6
$150,025
0
$0
0
$0
Aggregated Statistics For Year 2008 (Based on 2 partial tracts)
A) FHA, FSA/RHS & VA Home Purchase Loans
B) Conventional Home Purchase Loans
C) Refinancings
D) Home Improvement Loans
F) Non-occupant Loans on < 5 Family Dwellings (A B C & D)
Number
Average Value
Number
Average Value
Number
Average Value
Number
Average Value
Number
Average Value
LOANS ORIGINATED
28
$170,980
21
$165,658
98
$155,937
9
$54,134
4
$147,055
APPLICATIONS APPROVED, NOT ACCEPTED
0
$0
1
$222,810
10
$149,134
3
$49,017
1
$297,080
APPLICATIONS DENIED
6
$133,687
12
$122,050
51
$157,977
13
$19,538
3
$128,240
APPLICATIONS WITHDRAWN
6
$200,528
6
$198,053
21
$194,517
3
$130,717
0
$0
FILES CLOSED FOR INCOMPLETENESS
0
$0
1
$213,900
12
$143,465
1
$22,280
0
$0
Aggregated Statistics For Year 2007 (Based on 2 partial tracts)
A) FHA, FSA/RHS & VA Home Purchase Loans
B) Conventional Home Purchase Loans
C) Refinancings
D) Home Improvement Loans
F) Non-occupant Loans on < 5 Family Dwellings (A B C & D)
Number
Average Value
Number
Average Value
Number
Average Value
Number
Average Value
Number
Average Value
LOANS ORIGINATED
18
$172,059
52
$162,451
110
$136,765
25
$58,762
21
$133,969
APPLICATIONS APPROVED, NOT ACCEPTED
0
$0
3
$144,580
27
$147,550
0
$0
3
$143,093
APPLICATIONS DENIED
1
$286,680
25
$204,985
83
$170,391
22
$61,036
12
$148,168
APPLICATIONS WITHDRAWN
3
$148,540
9
$160,423
45
$149,728
7
$63,023
3
$155,967
FILES CLOSED FOR INCOMPLETENESS
0
$0
3
$265,390
12
$225,038
1
$222,810
1
$395,120
Aggregated Statistics For Year 2006 (Based on 2 partial tracts)
A) FHA, FSA/RHS & VA Home Purchase Loans
B) Conventional Home Purchase Loans
C) Refinancings
D) Home Improvement Loans
F) Non-occupant Loans on < 5 Family Dwellings (A B C & D)
G) Loans On Manufactured Home Dwelling (A B C & D)
Number
Average Value
Number
Average Value
Number
Average Value
Number
Average Value
Number
Average Value
Number
Average Value
LOANS ORIGINATED
9
$153,657
61
$133,783
187
$148,476
37
$43,960
9
$117,181
1
$133,690
APPLICATIONS APPROVED, NOT ACCEPTED
0
$0
4
$123,660
30
$114,970
4
$42,705
3
$126,260
0
$0
APPLICATIONS DENIED
0
$0
4
$118,832
62
$151,822
27
$46,928
7
$149,601
0
$0
APPLICATIONS WITHDRAWN
0
$0
12
$104,349
71
$143,373
3
$16,340
6
$122,050
1
$93,580
FILES CLOSED FOR INCOMPLETENESS
0
$0
1
$225,780
10
$191,320
1
$222,810
0
$0
0
$0
Aggregated Statistics For Year 2005 (Based on 2 partial tracts)
A) FHA, FSA/RHS & VA Home Purchase Loans
B) Conventional Home Purchase Loans
C) Refinancings
D) Home Improvement Loans
F) Non-occupant Loans on < 5 Family Dwellings (A B C & D)
Number
Average Value
Number
Average Value
Number
Average Value
Number
Average Value
Number
Average Value
LOANS ORIGINATED
19
$169,336
114
$129,139
174
$136,717
33
$74,855
21
$98,531
APPLICATIONS APPROVED, NOT ACCEPTED
0
$0
7
$102,704
24
$131,644
3
$30,697
0
$0
APPLICATIONS DENIED
0
$0
9
$163,394
105
$144,409
46
$75,529
12
$233,951
APPLICATIONS WITHDRAWN
1
$288,170
19
$168,319
108
$124,939
27
$133,631
1
$234,690
FILES CLOSED FOR INCOMPLETENESS
1
$288,170
4
$154,852
9
$139,958
3
$14,853
0
$0
Aggregated Statistics For Year 2004 (Based on 2 partial tracts)
A) FHA, FSA/RHS & VA Home Purchase Loans
B) Conventional Home Purchase Loans
C) Refinancings
D) Home Improvement Loans
F) Non-occupant Loans on < 5 Family Dwellings (A B C & D)
Number
Average Value
Number
Average Value
Number
Average Value
Number
Average Value
Number
Average Value
LOANS ORIGINATED
16
$137,956
104
$113,776
159
$119,635
40
$55,108
25
$100,056
APPLICATIONS APPROVED, NOT ACCEPTED
0
$0
15
$115,960
19
$145,100
3
$13,370
0
$0
APPLICATIONS DENIED
1
$112,890
10
$106,058
67
$116,837
25
$42,423
3
$81,697
APPLICATIONS WITHDRAWN
0
$0
16
$128,487
65
$120,363
6
$27,232
4
$101,008
FILES CLOSED FOR INCOMPLETENESS
0
$0
1
$145,570
1
$142,600
0
$0
0
$0
Aggregated Statistics For Year 2003 (Based on 2 partial tracts)
A) FHA, FSA/RHS & VA Home Purchase Loans
B) Conventional Home Purchase Loans
C) Refinancings
D) Home Improvement Loans
F) Non-occupant Loans on < 5 Family Dwellings (A B C & D)
Number
Average Value
Number
Average Value
Number
Average Value
Number
Average Value
Number
Average Value
LOANS ORIGINATED
18
$88,381
67
$109,099
257
$107,527
10
$27,034
25
$74,686
APPLICATIONS APPROVED, NOT ACCEPTED
3
$128,733
4
$82,068
37
$136,336
4
$33,050
1
$90,610
APPLICATIONS DENIED
0
$0
7
$91,883
83
$98,734
16
$23,302
3
$73,773
APPLICATIONS WITHDRAWN
0
$0
4
$106,578
91
$107,438
1
$234,690
3
$44,067
FILES CLOSED FOR INCOMPLETENESS
1
$111,400
0
$0
25
$165,890
0
$0
0
$0
Aggregated Statistics For Year 2002 (Based on 2 partial tracts)
A) FHA, FSA/RHS & VA Home Purchase Loans
B) Conventional Home Purchase Loans
C) Refinancings
D) Home Improvement Loans
F) Non-occupant Loans on < 5 Family Dwellings (A B C & D)
Number
Average Value
Number
Average Value
Number
Average Value
Number
Average Value
Number
Average Value
LOANS ORIGINATED
19
$81,775
55
$111,810
140
$105,230
24
$28,718
7
$48,806
APPLICATIONS APPROVED, NOT ACCEPTED
3
$74,270
4
$181,220
21
$62,104
10
$12,329
0
$0
APPLICATIONS DENIED
1
$158,940
13
$88,667
64
$70,464
31
$20,604
6
$50,998
APPLICATIONS WITHDRAWN
0
$0
9
$108,764
36
$118,048
4
$25,995
0
$0
FILES CLOSED FOR INCOMPLETENESS
0
$0
4
$86,525
12
$119,698
1
$37,130
0
$0
Aggregated Statistics For Year 2001 (Based on 2 partial tracts)
A) FHA, FSA/RHS & VA Home Purchase Loans
B) Conventional Home Purchase Loans
C) Refinancings
D) Home Improvement Loans
F) Non-occupant Loans on < 5 Family Dwellings (A B C & D)
Number
Average Value
Number
Average Value
Number
Average Value
Number
Average Value
Number
Average Value
LOANS ORIGINATED
42
$93,403
51
$93,347
97
$104,330
16
$15,782
13
$49,361
APPLICATIONS APPROVED, NOT ACCEPTED
0
$0
0
$0
10
$84,222
6
$19,558
0
$0
APPLICATIONS DENIED
3
$110,413
12
$53,722
51
$50,504
15
$15,943
3
$59,417
APPLICATIONS WITHDRAWN
6
$80,212
9
$68,659
30
$84,470
4
$25,252
0
$0
FILES CLOSED FOR INCOMPLETENESS
0
$0
0
$0
6
$83,925
0
$0
0
$0
Aggregated Statistics For Year 2000 (Based on 2 partial tracts)
A) FHA, FSA/RHS & VA Home Purchase Loans
B) Conventional Home Purchase Loans
C) Refinancings
D) Home Improvement Loans
F) Non-occupant Loans on < 5 Family Dwellings (A B C & D)
Number
Average Value
Number
Average Value
Number
Average Value
Number
Average Value
Number
Average Value
LOANS ORIGINATED
40
$82,477
67
$103,202
33
$64,637
31
$22,904
16
$54,217
APPLICATIONS APPROVED, NOT ACCEPTED
0
$0
3
$150,027
6
$69,072
3
$22,280
1
$203,500
APPLICATIONS DENIED
1
$127,740
7
$77,453
27
$39,831
19
$18,450
1
$49,020
APPLICATIONS WITHDRAWN
4
$80,582
7
$99,521
27
$81,202
4
$36,762
3
$48,027
FILES CLOSED FOR INCOMPLETENESS
0
$0
0
$0
3
$55,453
0
$0
0
$0
Aggregated Statistics For Year 1999 (Based on 1 partial tract)
A) FHA, FSA/RHS & VA Home Purchase Loans
B) Conventional Home Purchase Loans
C) Refinancings
D) Home Improvement Loans
F) Non-occupant Loans on < 5 Family Dwellings (A B C & D)
Detailed PMIC statistics for the following Tracts:7013.02
2002 - 2018 National Fire Incident Reporting System (NFIRS) incidents
According to the data from the years 2002 - 2018 the average number of fire incidents per year is 9. The highest number of fire incidents - 26 took place in 2005, and the least - 1 in 2017. The data has a constant trend.
When looking into fire subcategories, the most reports belonged to: Structure Fires (59.9%), and Outside Fires (27.0%).
Fire incident types reported to NFIRS in Zip Code 08554


 Nearest zip codes: 08518, 08505, 08016, 19054, 19055, 08611.


 According to the data from the years 2002 - 2018 the average number of fire incidents per year is 9. The highest number of fire incidents - 26 took place in 2005, and the least - 1 in 2017. The data has a constant trend.
 When looking into fire subcategories, the most reports belonged to: Structure Fires (59.9%), and Outside Fires (27.0%).