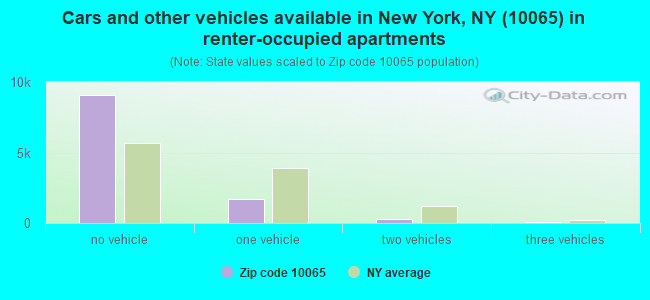
Houses and condos: 22,459 Renter-occupied apartments: 11,169
% of renters here:
68%
State:
46%
March 2022 cost of living index in zip code 10065: 132.4 (high, U.S. average is 100)
Land area: 0.4 sq. mi. Water area: 0.0 sq. mi.
Population density: 78,613 people per square mile
(very high).
OSM Map
Google Map
MSN Map
OSM Map
General Map
Google Map
MSN Map
OSM Map
Google Map
MSN Map
OSM Map
Google Map
MSN Map
Please wait while loading the map...
Real estate property taxes paid for housing units in 2022:
This zip code:
0.6% ($9,805)
New York:
1.5% ($6,180)
Median real estate property taxes paid for housing units with mortgages in 2022: $9,858 (0.6%) Median real estate property taxes paid for housing units with no mortgage in 2022: $9,755 (0.6%)
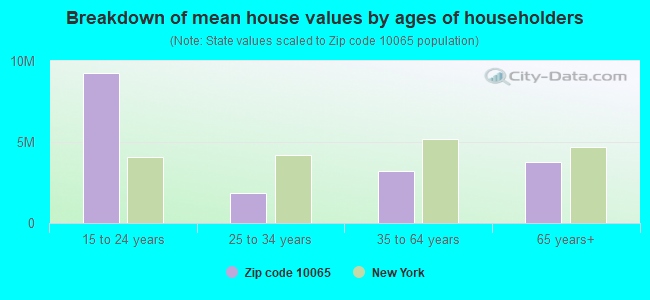
Estimated median house/condo value in 2022: $1,586,797
10065:
$1,586,797
New York:
$400,400
According to our research of New York and other state lists, there was 1 registered sex offender living in 10065 zip code as of May 21, 2024. The ratio of all residents to sex offenders in zip code 10065 is 30,431 to 1. The ratio of registered sex offenders to all residents in this zip code is much lower than the state average.
Median resident age:
This zip code:
38.7 years
New York median age:
40.0 years
Average household size:
This zip code:
1.8 people
New York:
2.5 people
Averages for the 2020 tax year for zip code 10065, filed in 2021:
Average Adjusted Gross Income (AGI) in 2020: $511,061 (Individual Income Tax Returns)
Here:
$511,061
State:
$90,930
Salary/wage: $253,488 (reported on 73.2% of returns)
Here:
$253,488
State:
$72,104
(% of AGI for various income ranges: 1094.3% for AGIs below $25k, 3855.1% for AGIs $25k-50k, 7398.2% for AGIs $50k-75k, 10801.6% for AGIs $75k-100k, 21032.4% for AGIs $100k-200k, 248972.9% for AGIs over 200k)
Taxable interest for individuals: $22,923 (reported on 60.2% of returns)
This zip code:
$22,923
New York:
$3,075
(% of AGI for various income ranges: 96.2% for AGIs below $25k, 141.0% for AGIs $25k-50k, 154.6% for AGIs $50k-75k, 229.2% for AGIs $75k-100k, 548.6% for AGIs $100k-200k, 21395.5% for AGIs over 200k)
Ordinary dividends: $66,354 (reported on 57.2% of returns)
Here:
$66,354
State:
$11,095
(% of AGI for various income ranges: 289.5% for AGIs below $25k, 337.4% for AGIs $25k-50k, 467.4% for AGIs $50k-75k, 755.0% for AGIs $75k-100k, 1704.1% for AGIs $100k-200k, 58383.0% for AGIs over 200k)
Net capital gain/loss in AGI: +$381,154 (reported on 54.2% of returns)
Here:
+$381,154
State:
+$44,925
(% of AGI for various income ranges: 112.9% for AGIs below $25k, 309.2% for AGIs $25k-50k, 349.8% for AGIs $50k-75k, 574.9% for AGIs $75k-100k, 1590.4% for AGIs $100k-200k, 339411.7% for AGIs over 200k)
Profit/loss from business: +$54,567 (reported on 20.1% of returns)
Here:
+$54,567
State:
+$14,940
(% of AGI for various income ranges: 309.7% for AGIs below $25k, 443.8% for AGIs $25k-50k, 367.1% for AGIs $50k-75k, 617.9% for AGIs $75k-100k, 1164.3% for AGIs $100k-200k, 14388.3% for AGIs over 200k)
Taxable individual retirement arrangement distribution: $43,471 (reported on 11.5% of returns)
10065:
$43,471
New York:
$19,609
(% of AGI for various income ranges: 134.3% for AGIs below $25k, 179.7% for AGIs $25k-50k, 256.1% for AGIs $50k-75k, 540.3% for AGIs $75k-100k, 1104.9% for AGIs $100k-200k, 5336.7% for AGIs over 200k)
Self-employed (Keogh) retirement plans: $42,737 (reported on 4.1% of returns)
10065:
$42,737
New York:
$32,497
(% of AGI for various income ranges: 30.5% for AGIs below $25k, 33.4% for AGIs $50k-75k, 78.6% for AGIs $75k-100k, 164.8% for AGIs $100k-200k, 2512.8% for AGIs over 200k)
Total itemized deductions: $154,199 (reported on 27.4% of returns)
Here:
$154,199
State:
$39,326
(% of AGI for various income ranges: 475.0% for AGIs below $25k, 533.5% for AGIs $25k-50k, 499.5% for AGIs $50k-75k, 1200.6% for AGIs $75k-100k, 1979.4% for AGIs $100k-200k, 64117.7% for AGIs over 200k)
Charity contributions: $82,880 (reported on 24.1% of returns)
Here:
$82,880
State:
$15,420
(% of AGI for various income ranges: 27.7% for AGIs below $25k, 58.0% for AGIs $25k-50k, 49.2% for AGIs $50k-75k, 172.3% for AGIs $75k-100k, 347.8% for AGIs $100k-200k, 32355.5% for AGIs over 200k)
Taxes paid: $9,968 (reported on 27.3% of returns)
10065:
$9,968
State:
$9,183
(% of AGI for various income ranges: 130.4% for AGIs below $25k, 147.7% for AGIs $25k-50k, 153.8% for AGIs $50k-75k, 298.1% for AGIs $75k-100k, 578.7% for AGIs $100k-200k, 2778.6% for AGIs over 200k)
Earned income credit: $900 (reported on 2.7% of returns)
Here:
$900
State:
$2,138
(% of AGI for various income ranges: 27.5% for AGIs below $25k, 9.6% for AGIs $25k-50k)
Percentage of individuals using paid preparers for their 2020 taxes: 95.1%
Here:
95%
State:
95%
(% for various income ranges: 91.0% for AGIs below $25k, 94.7% for AGIs $25k-50k, 95.0% for AGIs $50k-75k, 94.0% for AGIs $75k-100k, 96.3% for AGIs $100k-200k, 96.9% for AGIs over 200k)
Averages for the 2012 tax year for zip code 10065, filed in 2013:
Average Adjusted Gross Income (AGI) in 2012: $593,608 (Individual Income Tax Returns)
Here:
$593,608
State:
$77,088
Salary/wage: $244,640 (reported on 75.1% of returns)
Here:
$244,640
State:
$60,593
(% of AGI for various income ranges: 53.7% for AGIs below $25k, 73.4% for AGIs $25k-50k, 76.4% for AGIs $50k-75k, 71.6% for AGIs $75k-100k, 70.2% for AGIs $100k-200k, 27.1% for AGIs over 200k)
Taxable interest for individuals: $29,956 (reported on 65.2% of returns)
This zip code:
$29,956
New York:
$3,125
(% of AGI for various income ranges: 4.2% for AGIs below $25k, 1.9% for AGIs $25k-50k, 1.6% for AGIs $50k-75k, 1.6% for AGIs $75k-100k, 2.0% for AGIs $100k-200k, 3.4% for AGIs over 200k)
Ordinary dividends: $93,362 (reported on 53.4% of returns)
Here:
$93,362
State:
$10,299
(% of AGI for various income ranges: 12.3% for AGIs below $25k, 5.1% for AGIs $25k-50k, 4.8% for AGIs $50k-75k, 5.2% for AGIs $75k-100k, 5.5% for AGIs $100k-200k, 8.7% for AGIs over 200k)
Net capital gain/loss in AGI: +$435,703 (reported on 49.7% of returns)
Here:
+$435,703
State:
+$42,474
(% of AGI for various income ranges: 1.7% for AGIs $25k-50k, 1.5% for AGIs $50k-75k, 1.8% for AGIs $75k-100k, 2.6% for AGIs $100k-200k, 39.8% for AGIs over 200k)
Profit/loss from business: +$69,996 (reported on 20.3% of returns)
Here:
+$69,996
State:
+$16,168
(% of AGI for various income ranges: 18.3% for AGIs below $25k, 6.5% for AGIs $25k-50k, 4.7% for AGIs $50k-75k, 4.4% for AGIs $75k-100k, 5.3% for AGIs $100k-200k, 2.1% for AGIs over 200k)
Taxable individual retirement arrangement distribution: $44,929 (reported on 14.3% of returns)
10065:
$44,929
New York:
$17,621
(% of AGI for various income ranges: 5.9% for AGIs below $25k, 2.8% for AGIs $25k-50k, 2.8% for AGIs $50k-75k, 3.4% for AGIs $75k-100k, 4.1% for AGIs $100k-200k, 0.8% for AGIs over 200k)
Self-employment retirement plans: $36,624 (reported on 4.2% of returns)
10065:
$36,624
New York:
$27,330
(% of AGI for various income ranges: 1.1% for AGIs $25k-50k, 0.4% for AGIs $75k-100k, 0.6% for AGIs $100k-200k, 0.2% for AGIs over 200k)
Total itemized deductions: $167,532 (19% of AGI, reported on 64.9% of returns)
Here:
$167,532
State:
$34,985
Here:
18.8% of AGI
State:
21.3% of AGI
(% of AGI for various income ranges: 30.2% for AGIs below $25k, 14.7% for AGIs $25k-50k, 14.9% for AGIs $50k-75k, 17.4% for AGIs $75k-100k, 19.3% for AGIs $100k-200k, 18.3% for AGIs over 200k)
Charity contributions: $51,485 (reported on 54.5% of returns)
Here:
$51,485
State:
$5,572
(% of AGI for various income ranges: 1.7% for AGIs below $25k, 1.2% for AGIs $25k-50k, 1.5% for AGIs $50k-75k, 1.8% for AGIs $75k-100k, 2.0% for AGIs $100k-200k, 5.0% for AGIs over 200k)
Taxes paid: $99,669 (reported on 64.7% of returns)
10065:
$99,669
State:
$18,656
(% of AGI for various income ranges: 12.4% for AGIs below $25k, 5.2% for AGIs $25k-50k, 7.2% for AGIs $50k-75k, 10.0% for AGIs $75k-100k, 11.3% for AGIs $100k-200k, 11.0% for AGIs over 200k)
Earned income credit: $926 (reported on 2.7% of returns)
Here:
$926
State:
$2,230
(% of AGI for various income ranges: 1.2% for AGIs below $25k)
Percentage of individuals using paid preparers for their 2012 taxes: 71.1%
Here:
71%
State:
66%
(% for various income ranges: 67.3% for AGIs below $25k, 56.7% for AGIs $25k-50k, 63.4% for AGIs $50k-75k, 66.9% for AGIs $75k-100k, 74.8% for AGIs $100k-200k, 85.2% for AGIs over 200k)
Likely homosexual households (counted as self-reported same-sex unmarried-partner households)
Lesbian couples: 0.1% of all households
Gay men: 0.5% of all households
Household received Food Stamps/SNAP in the past 12 months: 316 Household did not receive Food Stamps/SNAP in the past 12 months: 15,878
Women who had a birth in the past 12 months: 559 (530 now married, 21 unmarried) Women who did not have a birth in the past 12 months: 7,719 (2,442 now married, 5,294 unmarried)
Housing units in zip code 10065 with a mortgage: 2,113 (34 second mortgage, 35 both second mortgage and home equity loan) Median monthly owner costs for units with a mortgage: $3,860 Median monthly owner costs for units without a mortgage: $1,487
Residents with income below the poverty level in 2022:
This zip code:
7.4%
Whole state:
14.3%
Residents with income below 50% of the poverty level in 2022:
This zip code:
2.8%
Whole state:
6.8%
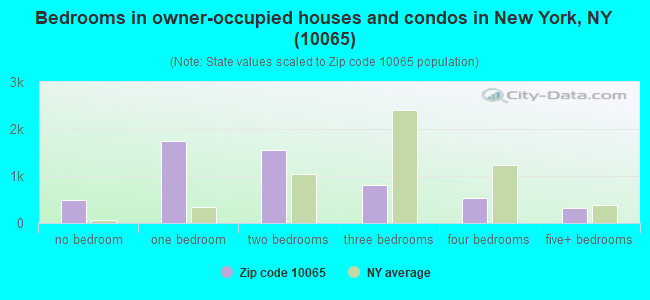
Median number of rooms in houses and condos:
Here:
4.0
State:
6.3
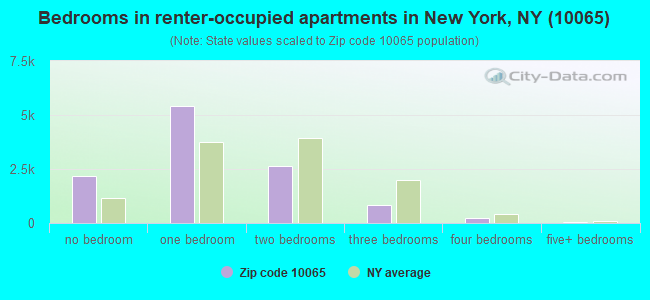
Median number of rooms in apartments:
Here:
3.1
State:
3.8
Notable locations in this zip code not listed on our city pages
Notable locations in zip code 10065: Clearview's First and 62nd Cinema (A), Beekman Theatre (B), Swedish Consulate and Permanent Mission To the United Nations (C), Grolier Club (D), New India House (E), Colony Club (F), Howard Building (G), Kettering Research Laboratory (H), Nathan Cummings Center (I), Phipps House (J), Rockefeller Research Laboratories (K), Schwartz Research Building (L), Sloan House (M), Abby Aldrich Rockefeller Hall (N), Benjamin and Irma G Weiss Research Building (O), Caspary Auditorium (P), Caspary Hall (Q), Detlev W Bronk Laboratory (R), Flexner Hall (S), Founders Hall (T). Display/hide their locations on the map
Churches in zip code 10065 include: First Magyar Reformed Church of the City of New York (A), Saint John Nepomucene Roman Catholic Church (B), Bethany Memorial Church (C), Saint Catherine of Siena Roman Catholic Church (D), Our Lady of Peace Roman Catholic Church (E), Our Lady of Perpetual Help Church (F), Trinity Baptist Church (G), Park East Synagogue (H), Church of Saint Vincent Ferrer (I). Display/hide their locations on the map
4,123 married couples with children.
662 single-parent households (376 men, 286 women).
71.2% of residents of 10065 zip code speak English at home.
6.7% of residents speak Spanish at home (81% very well, 17% well, 2% not well).
11.0% of residents speak other Indo-European language at home (85% very well, 9% well, 5% not well).
8.7% of residents speak Asian or Pacific Island language at home (73% very well, 17% well, 11% not well).
2.8% of residents speak other language at home (76% very well, 18% well, 2% not well, 4% not at all).
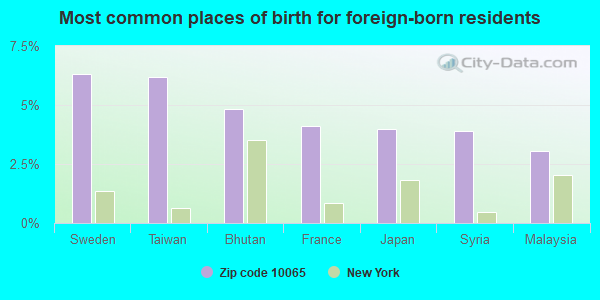
Foreign born population: 8,368 (27.6%) (53.3% of them are naturalized citizens)
This zip code:
27.6%
Whole state:
22.7%
6%Sweden
6%Taiwan
5%Bhutan
4%France
4%Japan
4%Syria
3%Malaysia
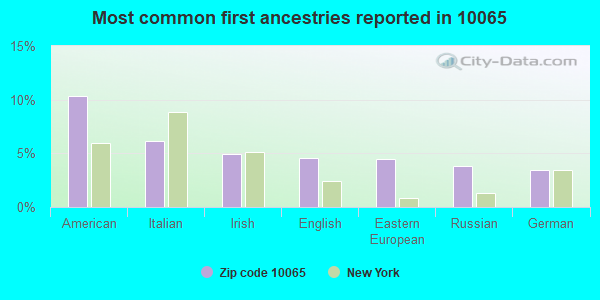
10%American
6%Italian
5%Irish
5%English
4%Eastern European
4%Russian
3%German
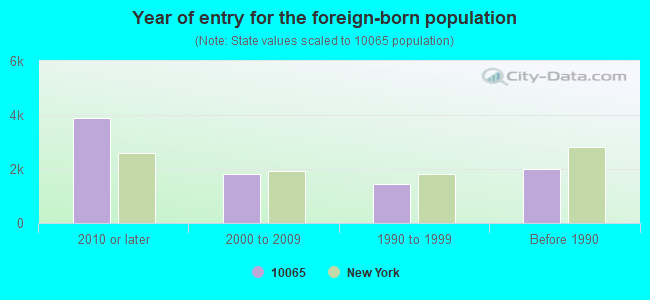
Year of entry for the foreign-born population
3,8822010 or later
1,7982000 to 2009
1,4381990 to 1999
2,015Before 1990
Housing units lacking complete plumbing facilities: 0.5% Housing units lacking complete kitchen facilities: 0.3%
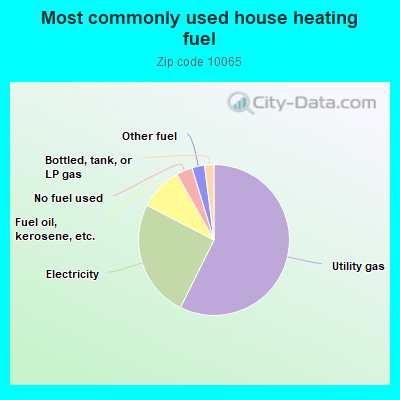
57.4%Utility gas
25.3%Electricity
9.2%Fuel oil, kerosene, etc.
3.5%No fuel used
2.7%Other fuel
2.0%Bottled, tank, or LP gas
Place of birth for U.S.-born residents:
This state: 13,227
Northeast: 3,356
Midwest: 1,487
South: 2,110
West: 1,418
81% of the 10065 zip code residents lived in the same house 1 year ago. Out of people who lived in different houses, 38% moved from this county. Out of people who lived in different houses, 12% moved from different county within same state. Out of people who lived in different houses, 25% moved from different state. Out of people who lived in different houses, 29% moved from abroad.
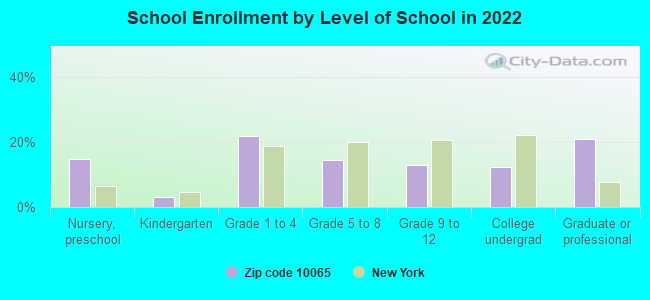
Private vs. public school enrollment:
Students in private schools in grades 1 to 8 (elementary and middle school): 1,011
Here:
52.2%
New York:
15.6%
Students in private schools in grades 9 to 12 (high school): 409
Here:
59.9%
New York:
15.0%
Students in private undergraduate colleges: 441
Here:
66.5%
New York:
39.2%
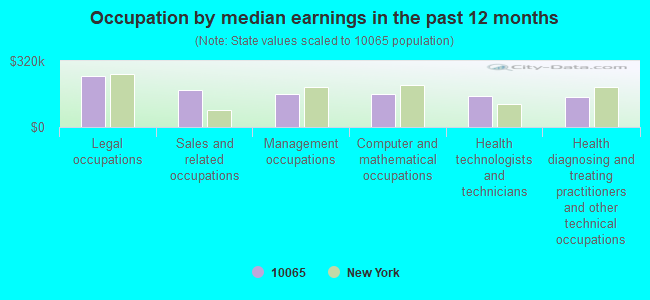
Occupation by median earnings in the past 12 months ($)
247,483Legal occupations
177,135Sales and related occupations
161,531Management occupations
161,303Computer and mathematical occupations
149,431Health technologists and technicians
143,149Health diagnosing and treating practitioners and other technical occupations
Fatal accident statistics in 2013:
Fatal accident count: 2
Vehicles involved in fatal accidents: 2
Fatal accidents caused by drunken drivers: 0
Fatalities: 2
Persons involved in fatal accidents: 2
Pedestrians involved in fatal accidents: 2
Fatal accident statistics in 2011:
Fatal accident count: 1
Vehicles involved in fatal accidents: 1
Fatal accidents caused by drunken drivers: 0
Fatalities: 1
Persons involved in fatal accidents: 1
Pedestrians involved in fatal accidents: 1
Most common first names in zip code 10065 among deceased individuals
Name
Count
Lived (average)
John
8
81.3 years
Frances
8
88.9 years
William
8
85.1 years
Dorothy
6
93.0 years
Mary
6
88.0 years
Helen
5
93.0 years
Alice
5
79.8 years
Robert
5
76.0 years
Richard
5
85.6 years
James
5
79.0 years
Most common last names in zip code 10065 among deceased individuals
Last name
Count
Lived (average)
Cohen
4
78.8 years
Katz
4
81.0 years
Shapiro
4
88.7 years
Bernstein
3
89.4 years
Smith
3
80.0 years
Caltabiano
2
86.9 years
Harris
2
83.5 years
Jones
2
88.0 years
Baker
2
88.0 years
Franken
2
80.5 years
Businesses in zip code 10065
Name
Count
Name
Count
AT&T
2
LensCrafters
1
Banana Republic
1
Loews
1
Best Cellars
1
New Balance
1
Cache
1
Nike
1
Chipotle
1
Pottery Barn Kids
1
Coldwater Creek
1
RadioShack
2
Ethan Allen
1
Rite Aid
1
FedEx
4
Sprint Nextel
1
H&R Block
1
UPS
1
Johnny Rockets
1
Walgreens
1
Discuss New York, New York (NY) on our hugely popular New York forum.