Estimated zip code population in 2022: 6,159 Zip code population in 2010: 5,199 Zip code population in 2000: 1,403
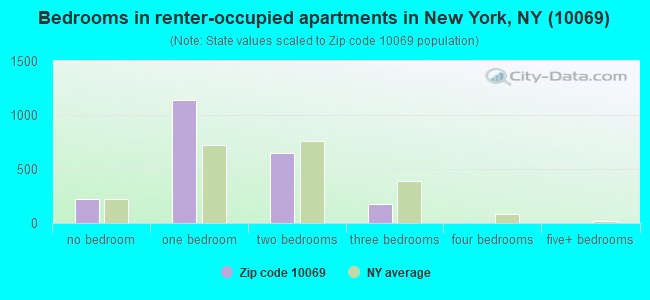
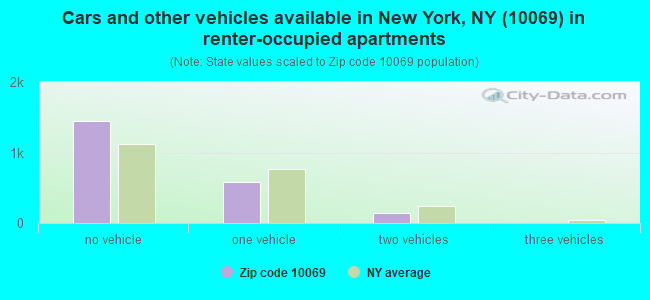
Houses and condos: 3,892 Renter-occupied apartments: 2,175
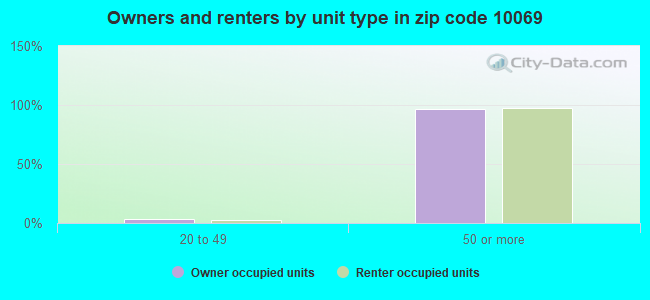
% of renters here:
68%
State:
46%
March 2022 cost of living index in zip code 10069: 157.7 (very high, U.S. average is 100)
Land area: 0.1 sq. mi. Water area: 0.0 sq. mi.
Population density: 59,124 people per square mile
(very high).
OSM Map
General Map
Google Map
MSN Map
OSM Map
General Map
Google Map
MSN Map
OSM Map
General Map
Google Map
MSN Map
OSM Map
General Map
Google Map
MSN Map
Please wait while loading the map...
Real estate property taxes paid for housing units in 2022:
This zip code:
0.5% ($9,805)
New York:
1.5% ($6,180)
Median real estate property taxes paid for housing units with mortgages in 2022: $9,858 (0.5%) Median real estate property taxes paid for housing units with no mortgage in 2022: $9,755 (0.9%)
Business Search- 14 Million verified businesses
Males: 3,600
(58.4%)
Females: 2,560
(41.6%)
For population 25 years and over in 10069:
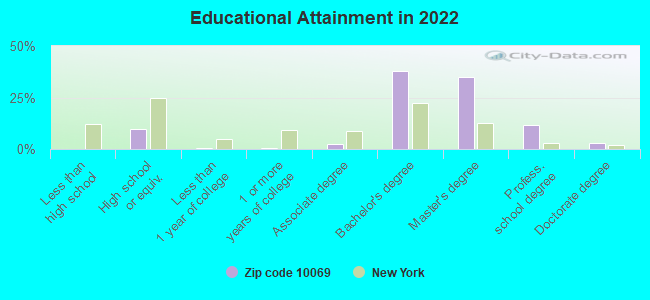
High school or higher: 102.2%
Bachelor's degree or higher: 89.2%
Graduate or professional degree: 50.7%
Unemployed: 12.7%
Mean travel time to work (commute): 30.7 minutes
For population 15 years and over in 10069:
Never married: 20.7%
Now married: 60.8%
Separated: 0.9%
Widowed: 0.0%
Divorced: 17.6%
Zip code 10069 compared to state average:
Median household income significantly above state average.
Median house value significantly above state average.
Unemployed percentage above state average.
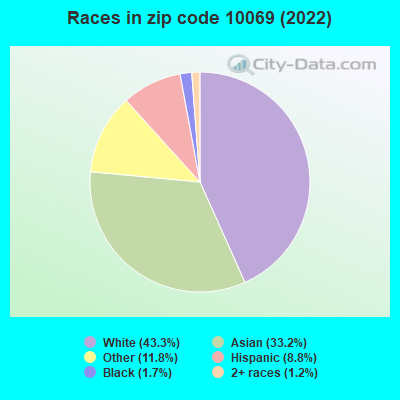
Black race population percentage significantly below state average.
Hispanic race population percentage below state average.
Foreign-born population percentage above state average.
Length of stay since moving in significantly below state average.
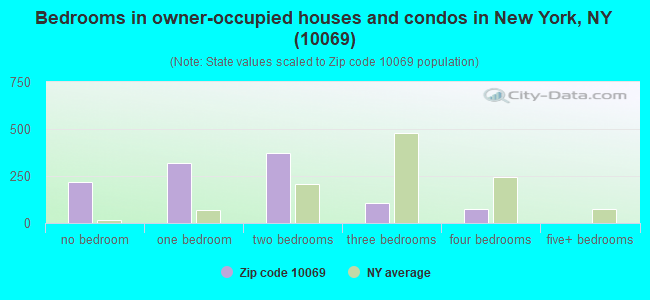
Number of rooms per house significantly below state average.
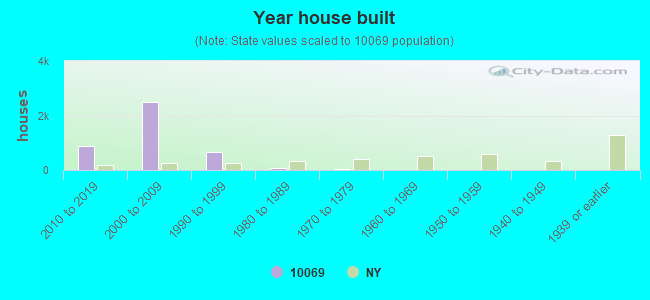
House age significantly below state average.
Percentage of population with a bachelor's degree or higher significantly above state average.
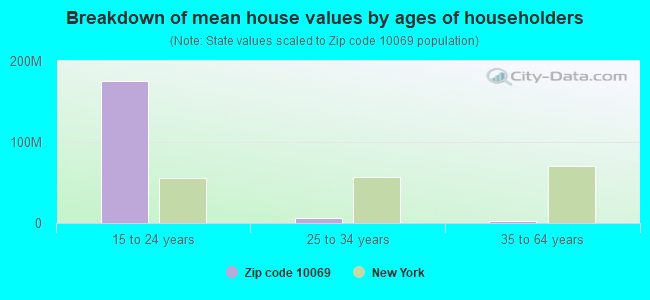
Estimated median house/condo value in 2022: $1,894,212
10069:
$1,894,212
New York:
$400,400
According to our research of New York and other state lists, there was 1 registered sex offender living in 10069 zip code as of May 21, 2024. The ratio of all residents to sex offenders in zip code 10069 is 5,306 to 1. The ratio of registered sex offenders to all residents in this zip code is much lower than the state average.
Median resident age:
This zip code:
40.7 years
New York median age:
40.0 years
Average household size:
This zip code:
1.9 people
New York:
2.5 people
Averages for the 2020 tax year for zip code 10069, filed in 2021:
Average Adjusted Gross Income (AGI) in 2020: $524,012 (Individual Income Tax Returns)
Here:
$524,012
State:
$90,930
Salary/wage: $319,109 (reported on 82.2% of returns)
Here:
$319,109
State:
$72,104
(% of AGI for various income ranges: 1284.5% for AGIs below $25k, 3868.5% for AGIs $25k-50k, 7036.8% for AGIs $50k-75k, 10575.6% for AGIs $75k-100k, 22430.3% for AGIs $100k-200k, 259138.6% for AGIs over 200k)
Taxable interest for individuals: $19,875 (reported on 62.0% of returns)
This zip code:
$19,875
New York:
$3,075
(% of AGI for various income ranges: 74.5% for AGIs below $25k, 60.0% for AGIs $25k-50k, 114.7% for AGIs $50k-75k, 204.4% for AGIs $75k-100k, 263.2% for AGIs $100k-200k, 13515.0% for AGIs over 200k)
Ordinary dividends: $28,146 (reported on 57.0% of returns)
Here:
$28,146
State:
$11,095
(% of AGI for various income ranges: 160.0% for AGIs below $25k, 250.5% for AGIs $25k-50k, 438.4% for AGIs $50k-75k, 470.0% for AGIs $75k-100k, 882.9% for AGIs $100k-200k, 16463.9% for AGIs over 200k)
Net capital gain/loss in AGI: +$246,916 (reported on 55.1% of returns)
Here:
+$246,916
State:
+$44,925
(% of AGI for various income ranges: 164.5% for AGIs below $25k, 422.0% for AGIs $25k-50k, 367.4% for AGIs $50k-75k, 695.0% for AGIs $75k-100k, 1152.6% for AGIs $100k-200k, 153621.4% for AGIs over 200k)
Profit/loss from business: +$63,229 (reported on 20.6% of returns)
Here:
+$63,229
State:
+$14,940
(% of AGI for various income ranges: 336.0% for AGIs below $25k, 387.5% for AGIs $25k-50k, 374.7% for AGIs $50k-75k, 838.1% for AGIs $75k-100k, 1163.2% for AGIs $100k-200k, 12241.4% for AGIs over 200k)
Taxable individual retirement arrangement distribution: $38,471 (reported on 6.5% of returns)
10069:
$38,471
New York:
$19,609
(% of AGI for various income ranges: 79.0% for AGIs below $25k, 176.0% for AGIs $25k-50k, 255.6% for AGIs $75k-100k, 590.9% for AGIs $100k-200k, 1839.6% for AGIs over 200k)
Self-employed (Keogh) retirement plans: $49,340 (reported on 4.7% of returns)
10069:
$49,340
New York:
$32,497
(% of AGI for various income ranges: 177.4% for AGIs $50k-75k, 2522.9% for AGIs over 200k)
Total itemized deductions: $56,641 (reported on 24.3% of returns)
Here:
$56,641
State:
$39,326
(% of AGI for various income ranges: 316.5% for AGIs below $25k, 329.5% for AGIs $25k-50k, 551.1% for AGIs $50k-75k, 702.5% for AGIs $75k-100k, 1146.5% for AGIs $100k-200k, 13149.6% for AGIs over 200k)
Charity contributions: $24,799 (reported on 21.5% of returns)
Here:
$24,799
State:
$15,420
(% of AGI for various income ranges: 18.0% for AGIs below $25k, 52.6% for AGIs $50k-75k, 65.0% for AGIs $75k-100k, 231.2% for AGIs $100k-200k, 5744.6% for AGIs over 200k)
Taxes paid: $9,804 (reported on 24.3% of returns)
10069:
$9,804
State:
$9,183
(% of AGI for various income ranges: 56.0% for AGIs below $25k, 87.0% for AGIs $25k-50k, 136.3% for AGIs $50k-75k, 183.8% for AGIs $75k-100k, 335.6% for AGIs $100k-200k, 2023.9% for AGIs over 200k)
Earned income credit: $1,362 (reported on 4.0% of returns)
Here:
$1,362
State:
$2,138
(% of AGI for various income ranges: 54.5% for AGIs below $25k, 34.0% for AGIs $25k-50k)
Percentage of individuals using paid preparers for their 2020 taxes: 96.0%
Here:
96%
State:
95%
(% for various income ranges: 95.2% for AGIs below $25k, 96.7% for AGIs $25k-50k, 96.2% for AGIs $50k-75k, 96.2% for AGIs $75k-100k, 95.5% for AGIs $100k-200k, 96.2% for AGIs over 200k)
Averages for the 2012 tax year for zip code 10069, filed in 2013:
Average Adjusted Gross Income (AGI) in 2012: $479,115 (Individual Income Tax Returns)
Here:
$479,115
State:
$77,088
Salary/wage: $352,204 (reported on 83.8% of returns)
Here:
$352,204
State:
$60,593
(% of AGI for various income ranges: 56.2% for AGIs below $25k, 72.6% for AGIs $25k-50k, 82.8% for AGIs $50k-75k, 88.7% for AGIs $75k-100k, 82.8% for AGIs $100k-200k, 59.4% for AGIs over 200k)
Taxable interest for individuals: $15,951 (reported on 68.0% of returns)
This zip code:
$15,951
New York:
$3,125
(% of AGI for various income ranges: 8.1% for AGIs below $25k, 2.2% for AGIs $25k-50k, 1.4% for AGIs $50k-75k, 0.7% for AGIs $75k-100k, 1.0% for AGIs $100k-200k, 2.4% for AGIs over 200k)
Ordinary dividends: $30,442 (reported on 56.4% of returns)
Here:
$30,442
State:
$10,299
(% of AGI for various income ranges: 17.5% for AGIs below $25k, 4.2% for AGIs $25k-50k, 2.3% for AGIs $50k-75k, 2.9% for AGIs $75k-100k, 2.0% for AGIs $100k-200k, 3.7% for AGIs over 200k)
Net capital gain/loss in AGI: +$161,258 (reported on 51.9% of returns)
Here:
+$161,258
State:
+$42,474
(% of AGI for various income ranges: 1.0% for AGIs $25k-50k, 0.2% for AGIs $75k-100k, 1.6% for AGIs $100k-200k, 19.2% for AGIs over 200k)
Profit/loss from business: +$57,704 (reported on 20.7% of returns)
Here:
+$57,704
State:
+$16,168
(% of AGI for various income ranges: 19.4% for AGIs below $25k, 11.9% for AGIs $25k-50k, 6.6% for AGIs $50k-75k, 5.8% for AGIs $75k-100k, 5.7% for AGIs $100k-200k, 2.0% for AGIs over 200k)
Taxable individual retirement arrangement distribution: $43,821 (reported on 7.1% of returns)
10069:
$43,821
New York:
$17,621
(% of AGI for various income ranges: 8.0% for AGIs below $25k, 2.2% for AGIs $50k-75k, 1.5% for AGIs $100k-200k, 0.6% for AGIs over 200k)
Self-employment retirement plans: $43,393 (reported on 5.6% of returns)
10069:
$43,393
New York:
$27,330
Total itemized deductions: $97,184 (16% of AGI, reported on 75.2% of returns)
Here:
$97,184
State:
$34,985
Here:
15.6% of AGI
State:
21.3% of AGI
(% of AGI for various income ranges: 38.6% for AGIs below $25k, 20.3% for AGIs $25k-50k, 18.0% for AGIs $50k-75k, 15.5% for AGIs $75k-100k, 17.6% for AGIs $100k-200k, 14.9% for AGIs over 200k)
Charity contributions: $10,056 (reported on 62.0% of returns)
Here:
$10,056
State:
$5,572
(% of AGI for various income ranges: 1.8% for AGIs below $25k, 1.1% for AGIs $25k-50k, 1.3% for AGIs $50k-75k, 1.3% for AGIs $75k-100k, 1.5% for AGIs $100k-200k, 1.3% for AGIs over 200k)
Taxes paid: $73,192 (reported on 75.2% of returns)
10069:
$73,192
State:
$18,656
(% of AGI for various income ranges: 9.9% for AGIs below $25k, 8.1% for AGIs $25k-50k, 6.7% for AGIs $50k-75k, 8.3% for AGIs $75k-100k, 11.2% for AGIs $100k-200k, 11.6% for AGIs over 200k)
Earned income credit: $1,071 (reported on 2.6% of returns)
Here:
$1,071
State:
$2,230
(% of AGI for various income ranges: 2.0% for AGIs below $25k)
Percentage of individuals using paid preparers for their 2012 taxes: 71.1%
Here:
71%
State:
66%
(% for various income ranges: 69.4% for AGIs below $25k, 63.6% for AGIs $25k-50k, 63.6% for AGIs $50k-75k, 61.9% for AGIs $75k-100k, 65.5% for AGIs $100k-200k, 79.1% for AGIs over 200k)
Averages for the 2004 tax year for zip code 10069, filed in 2005:
Average Adjusted Gross Income (AGI) in 2004: $270,687 (Individual Income Tax Returns)
Here:
$270,687
State:
$59,519
Salary/wage: $229,411 (reported on 87.5% of returns)
Here:
$229,411
State:
$50,673
(% of AGI for various income ranges: 199.6% for AGIs below $10k, 77.2% for AGIs $10k-25k, 87.0% for AGIs $25k-50k, 87.6% for AGIs $50k-75k, 86.4% for AGIs $75k-100k, 73.2% for AGIs over 100k)
Taxable interest for individuals: $3,789 (reported on 80.1% of returns)
This zip code:
$3,789
New York:
$2,377
(% of AGI for various income ranges: 26.1% for AGIs below $10k, 4.7% for AGIs $10k-25k, 2.1% for AGIs $25k-50k, 1.2% for AGIs $50k-75k, 1.6% for AGIs $75k-100k, 1.1% for AGIs over 100k)
Taxable dividends: $8,160 (reported on 57.7% of returns)
Here:
$8,160
State:
$5,394
(% of AGI for various income ranges: 43.2% for AGIs below $10k, 5.2% for AGIs $10k-25k, 2.1% for AGIs $25k-50k, 2.2% for AGIs $50k-75k, 2.3% for AGIs $75k-100k, 1.7% for AGIs over 100k)
Net capital gain/loss: +$40,397 (reported on 53.0% of returns)
Here:
+$40,397
State:
+$23,581
(% of AGI for various income ranges: -20.5% for AGIs below $10k, -0.9% for AGIs $10k-25k, 1.7% for AGIs $25k-50k, 1.7% for AGIs $50k-75k, -0.3% for AGIs $75k-100k, 8.5% for AGIs over 100k)
Profit/loss from business: +$36,792 (reported on 16.8% of returns)
Here:
+$36,792
State:
+$13,809
(% of AGI for various income ranges: -29.9% for AGIs below $10k, 14.3% for AGIs $10k-25k, 3.9% for AGIs $25k-50k, 3.0% for AGIs $50k-75k, 3.7% for AGIs $75k-100k, 2.2% for AGIs over 100k)
IRA payment deduction: $3,532 (reported on 3.7% of returns)
10069:
$3,532
New York:
$3,115
Self-employed pension: $27,882 (reported on 4.0% of returns)
Here:
$27,882
New York:
$19,016
Total itemized deductions: $59,864 (17% of AGI, reported on 72.5% of returns)
Here:
$59,864
State:
$25,864
Here:
16.7% of AGI
State:
21.9% of AGI
(% of AGI for various income ranges: 82.6% for AGIs below $10k, 18.8% for AGIs $10k-25k, 13.1% for AGIs $25k-50k, 17.7% for AGIs $50k-75k, 21.8% for AGIs $75k-100k, 15.9% for AGIs over 100k)
Charity contributions deductions: $6,558 (2% of AGI, reported on 62.3% of returns)
Here:
$6,558
State:
$4,439
Here:
1.7% of AGI
State:
3.6% of AGI
(% of AGI for various income ranges: 1.1% for AGIs $10k-25k, 1.4% for AGIs $25k-50k, 1.9% for AGIs $50k-75k, 2.1% for AGIs $75k-100k, 1.5% for AGIs over 100k)
Total tax: $69,669 (reported on 91.9% of returns)
10069:
$69,669
State:
$11,730
(% of AGI for various income ranges: 10.2% for AGIs below $10k, 6.9% for AGIs $10k-25k, 9.5% for AGIs $25k-50k, 12.7% for AGIs $50k-75k, 14.6% for AGIs $75k-100k, 24.5% for AGIs over 100k)
Earned income credit: $615 (reported on 2.3% of returns)
Here:
$615
State:
$1,757
Percentage of individuals using paid preparers for their 2004 taxes: 69.0%
Here:
69%
State:
67%
(% for various income ranges: 66.2% for AGIs below $10k, 67.5% for AGIs $10k-25k, 57.1% for AGIs $25k-50k, 65.7% for AGIs $50k-75k, 63.0% for AGIs $75k-100k, 74.1% for AGIs over 100k)
Likely homosexual households (counted as self-reported same-sex unmarried-partner households)
Lesbian couples: 0.0% of all households
Gay men: 0.7% of all households
Household received Food Stamps/SNAP in the past 12 months: 352 Household did not receive Food Stamps/SNAP in the past 12 months: 2,840
Women who had a birth in the past 12 months: 28 (28 now married, 0 unmarried) Women who did not have a birth in the past 12 months: 1,212 (714 now married, 484 unmarried)
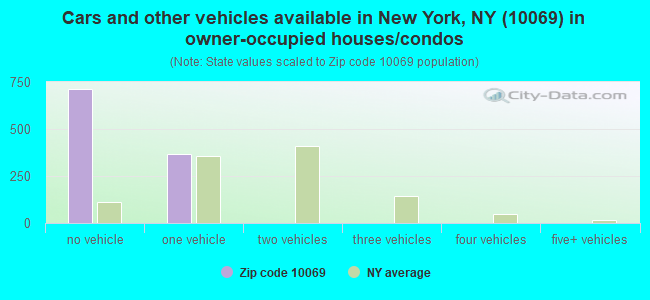
Housing units in zip code 10069 with a mortgage: 646 Median monthly owner costs for units with a mortgage: $3,860 Median monthly owner costs for units without a mortgage: $1,316
Residents with income below the poverty level in 2022:
This zip code:
27.1%
Whole state:
14.3%
Residents with income below 50% of the poverty level in 2022:
This zip code:
0.4%
Whole state:
6.8%
Median number of rooms in houses and condos:
Here:
2.8
State:
6.3
Median number of rooms in apartments:
Here:
3.5
State:
3.8
Notable locations in this zip code not listed on our city pages
Size of family households: 693 2-persons, 615 3-persons, 180 4-persons, 19 5-persons
Size of nonfamily households: 1,702 1-person, 16 2-persons
762 married couples with children.
735 single-parent households (74 men, 661 women).
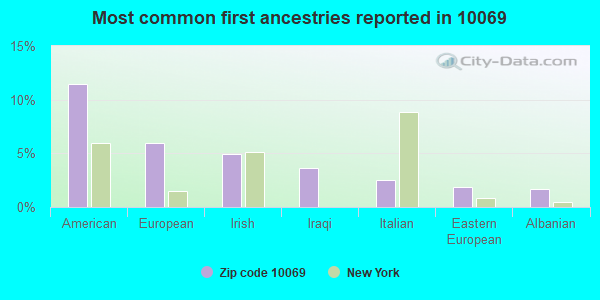
64.2% of residents of 10069 zip code speak English at home.
7.8% of residents speak Spanish at home (33% very well, 41% well, 26% not well).
6.8% of residents speak other Indo-European language at home (95% very well, 5% well).
16.9% of residents speak Asian or Pacific Island language at home (34% very well, 44% well, 2% not well, 19% not at all).
3.4% of residents speak other language at home (100% very well).
Foreign born population: 2,175 (35.3%) (66.3% of them are naturalized citizens)
Housing units lacking complete plumbing facilities: 1.0% Housing units lacking complete kitchen facilities: 3.1%
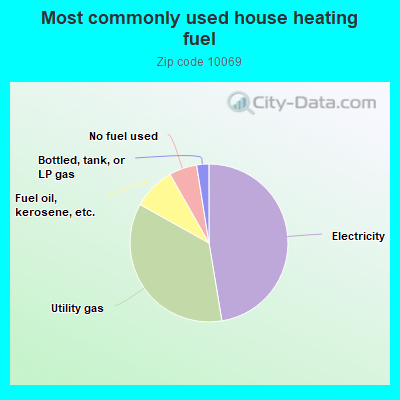
47.4%Electricity
35.7%Utility gas
8.7%Fuel oil, kerosene, etc.
5.7%No fuel used
2.5%Bottled, tank, or LP gas
Place of birth for U.S.-born residents:
This state: 2,571
Northeast: 450
Midwest: 498
South: 369
West: 87
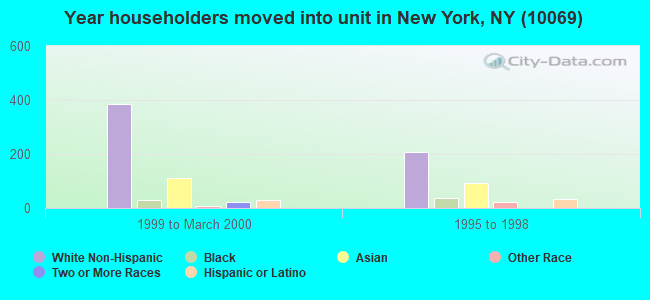
0% of the 10069 zip code residents lived in the same house 5 years ago. Out of people who lived in different houses, 44% lived in this county. Out of people who lived in different counties, 50% lived in New York.
77% of the 10069 zip code residents lived in the same house 1 year ago. Out of people who lived in different houses, 64% moved from this county. Out of people who lived in different houses, 5% moved from different county within same state. Out of people who lived in different houses, 21% moved from different state. Out of people who lived in different houses, 11% moved from abroad.
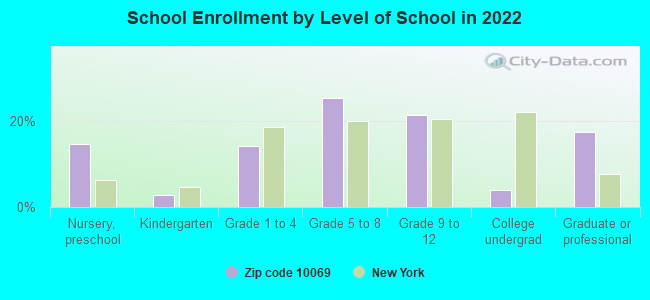
Private vs. public school enrollment:
Students in private schools in grades 1 to 8 (elementary and middle school): 418
Here:
82.3%
New York:
15.6%
Students in private schools in grades 9 to 12 (high school): 23
Here:
8.8%
New York:
15.0%
Students in private undergraduate colleges: 17
Here:
35.4%
New York:
39.2%
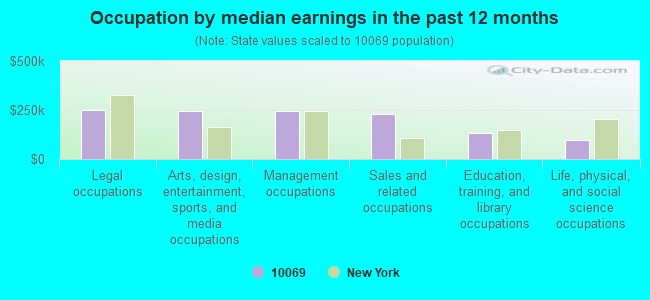
Occupation by median earnings in the past 12 months ($)
247,483Legal occupations
244,754Arts, design, entertainment, sports, and media occupations
243,431Management occupations
231,515Sales and related occupations
132,748Education, training, and library occupations
97,513Life, physical, and social science occupations
Top industries in this zip code by the number of employees in 2005:
Real Estate and Rental and Leasing: Lessors of Residential Buildings and Dwellings (20-49 employees: 4 establishments, 1-4 employees: 4 establishments)
Arts, Entertainment, and Recreation: Fitness and Recreational Sports Centers (20-49: 2)
Management of Companies and Enterprises: Offices of Other Holding Companies (20-49: 1)
Real Estate and Rental and Leasing: Other Activities Related to Real Estate (10-19: 1, 1-4: 1)
Other Services (except Public Administration): Religious Organizations (10-19: 1)
Finance and Insurance: Investment Advice (10-19: 1)


 Nearest zip codes: 10023, 10019, 10036, 10103, 10112, 10018.