Estimated zip code population in 2022: 158
Houses and condos: 151
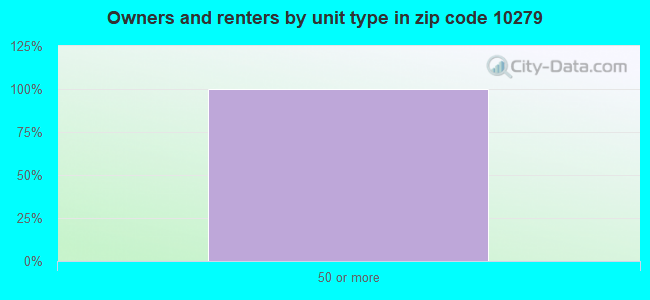
Renter-occupied apartments: 77
| % of renters here: | 100% |
| State: | 46% |
125.8
(high, U.S. average is 100)
Land area: 0.0
sq. mi.
Water area: 0.0
sq. mi.
| Population density: 37,873 people per square mile | | (very high). |
- OSM Map
- General Map
- Google Map
- MSN Map
- OSM Map
- General Map
- Google Map
- MSN Map
- OSM Map
- General Map
- Google Map
- MSN Map
- OSM Map
- General Map
- Google Map
- MSN Map
Please wait while loading the map...
Real estate property taxes paid for housing units in 2022:
| This zip code: | 0.8% ($6,088) |
| New York: | 1.5% ($6,180) |
Business Search - 14 Million verified businesses
| Males: 77 |  (49.1%) (49.1%) |
| Females: 80 |  (50.9%) (50.9%) |
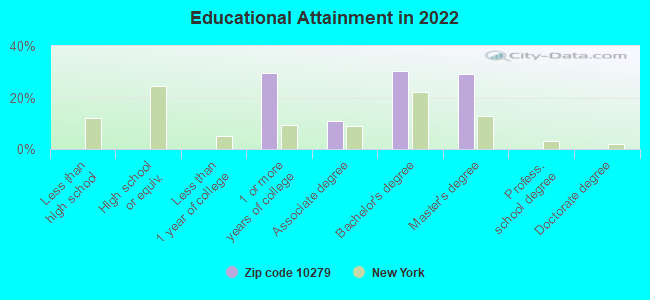
For population 25 years and over in 10279:
- High school or higher: 99.1%
- Bachelor's degree or higher: 59.0%
- Graduate or professional degree: 28.8%
For population 15 years and over in 10279:
- Never married: 0.0%
- Now married: 40.3%
- Separated: 0.0%
- Widowed: 0.0%
- Divorced: 59.7%
Zip code 10279 compared to state average:
- Median household income significantly above state average.
- Median house value significantly below state average.
- Unemployed percentage significantly below state average.
- Black race population percentage significantly below state average.
- Hispanic race population percentage significantly below state average.
- Median age significantly above state average.
- Renting percentage above state average.
- Number of rooms per house below state average.
- House age significantly below state average.
- Number of college students significantly below state average.
- Percentage of population with a bachelor's degree or higher above state average.
Data:
100%
urban population.
Median resident age:| This zip code: | 49.2 years |
| New York median age: | 40.0 years |
Average household size:| This zip code: | 2.1 people |
| New York: | 2.5 people |
Averages for the 2004 tax year for zip code 10279, filed in 2005:
Average Adjusted Gross Income (AGI) in 2004: $122,909 (Individual Income Tax Returns)
| Here: | $122,909 |
| State: | $59,519 |
Estimated median household income in 2022: | This zip code: | $244,383 |
| New York: | $79,557 |
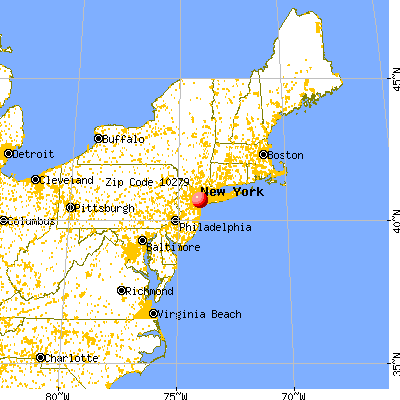
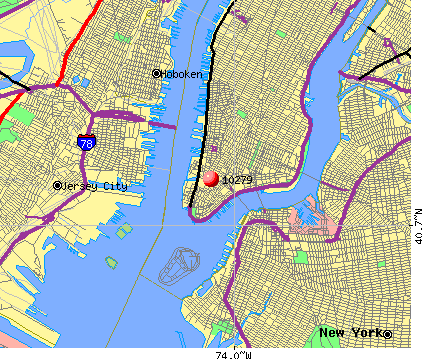
![New York, NY (10279) map]() Nearest zip codes: 10007
Nearest zip codes: 10007,
10271,
10006,
10278,
10005,
10038.
New York Zip Code Map
Percentage of family households:| This zip code: | 38.0% |
| New York: | 41.3% |
Percentage of households with unmarried partners:| This zip code: | 0.0% |
| New York: | 42.3% |
No gay or lesbian households reported
Household received Food Stamps/SNAP in the past 12 months: 0
Household did not receive Food Stamps/SNAP in the past 12 months: 75
Women who did not have a birth in the past 12 months: 65 (15 now married, 50 unmarried)
Median number of rooms in apartments:

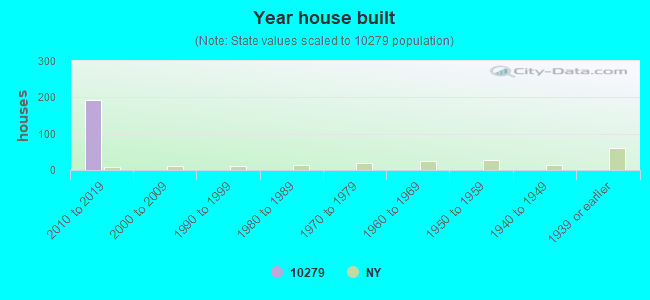
- Year house built (houses)
- 02020 or later
- 1932010 to 2019
- 02000 to 2009
- 01990 to 1999
- 01980 to 1989
- 01970 to 1979
- 01960 to 1969
- 01950 to 1959
- 01940 to 1949
- 01939 or earlier
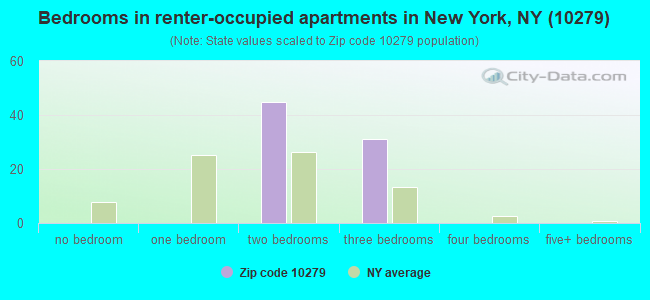
- Bedrooms in renter-occupied apartments in New York, NY (10279)
- 0no bedroom
- 01 bedroom
- 452 bedrooms
- 313 bedrooms
- 04 bedrooms
- 05+ bedrooms
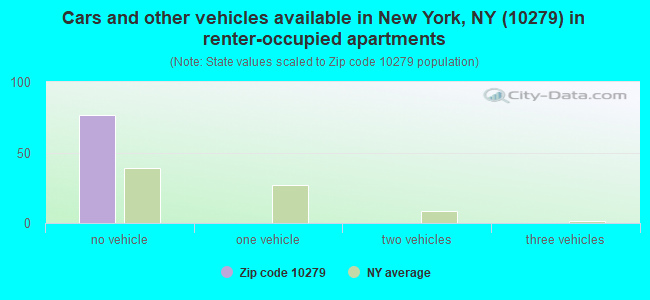
- Cars and other vehicles available in New York, NY (10279) in renter-occupied apartments
- 76no vehicle
- 01 vehicle
- 02 vehicles
- 03 vehicles
- 04 vehicles
- 05+ vehicles
Rent paid by renters in 2022 in zip code 10279
![Rent paid by renters in 2022 in zip code 10279]()
- 17$1,500 to $1,999
- 62$3,500 or more
Median gross rent in 2022: $3,482.
Median price asked for vacant for-sale houses and condos in 2022: $1,532,600.
Mean price in 2022:
Detached houses: $888,942| Here: | $888,942 |
| State: | $476,719 |
Townhouses or other attached units: $905,612| Here: | $905,612 |
| State: | $699,270 |
In 2-unit structures: $921,787| Here: | $921,787 |
| State: | $713,077 |
In 3-to-4-unit structures: $1,024,741| Here: | $1,024,741 |
| State: | $764,568 |
In 5-or-more-unit structures: $1,061,560| Here: | $1,061,560 |
| State: | $912,009 |
Mobile homes: $264,539| Here: | $264,539 |
| State: | $88,925 |
Occupied boats, RVs, vans, etc.: $811,842| Here: | $811,842 |
| State: | $480,795 |
Housing units in structures:
Means of transportation to work in zip code 10279
![Means of transportation to work in zip code 10279]()
- 27.8%40Streetcar or trolley car
- 10.4%15Walked
- 71.5%103Worked at home
Travel time to work (commute) in zip code 10279
![Travel time to work (commute) in zip code 10279]()
- 1510 to 14 minutes
- 4320 to 24 minutes
Percentage of zip code residents living and working in this county: 102.1%
Household type by relationship:
Households: 158
- Male householders: 62 (0 living alone), Female householders: 14 (0 living alone)
35 spouses (35 opposite-sex spouses), 0 unmarried partners, (0 opposite-sex unmarried partners), 0 children (0 natural, 0 adopted, 0 stepchildren), 0 grandchildren, 0 brothers or sisters, 0 parents, 0 foster children, 0 other relatives, 43 non-relatives
Size of family households: 30 2-persons
Size of nonfamily households: 49 2-persons
98.7% of residents of 10279 zip code speak English at home.
Foreign born population: 31 (20.0%)
(0.0%
of them are naturalized citizens)

- 115%South African
- 33%Greek
- Year of entry for the foreign-born population
- 372010 or later
- 02000 to 2009
- 01990 to 1999
- 0Before 1990
There are
1 Medical Specialists in Zip Code 10279.
Place of birth for U.S.-born residents:
- This state: 44
- Northeast: 31
- West: 54
79% of the 10279 zip code residents lived in the same house 1 year ago.
Out of people who lived in different houses, 106% moved from abroad.
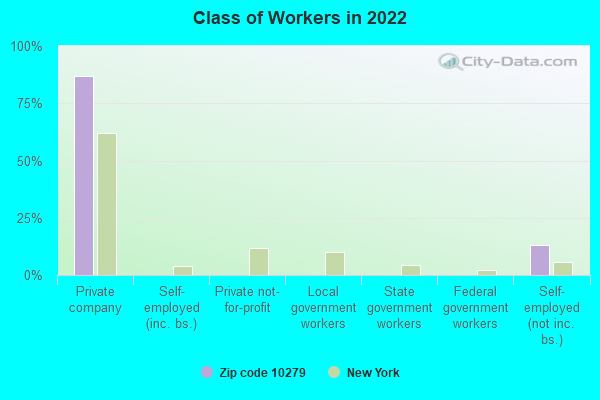
Top industries in this zip code by the number of employees in 2005:
- Management of Companies and Enterprises: Corporate, Subsidiary, and Regional Managing Offices (100-249 employees: 1 establishment, 20-49 employees: 5 establishments, 10-19 employees: 4 establishments, 5-9 employees: 13 establishments, 1-4 employees: 10 establishments)
- Professional, Scientific, and Technical Services: Offices of Lawyers (20-49: 2, 10-19: 3, 5-9: 10, 1-4: 36)
- Health Care and Social Assistance: Vocational Rehabilitation Services (100-249: 1)
- Accommodation and Food Services: Full-Service Restaurants (50-99: 1, 1-4: 1)
- Other Services (except Public Administration): Labor Unions and Similar Labor Organizations (20-49: 1, 1-4: 1)
- Administrative and Support and Waste Management and Remediation Services: Document Preparation Services (20-49: 1)
- Professional, Scientific, and Technical Services: Advertising Agencies (20-49: 1)
- Real Estate and Rental and Leasing: Lessors of Nonresidential Buildings (except Miniwarehouses) (5-9: 2, 1-4: 2)
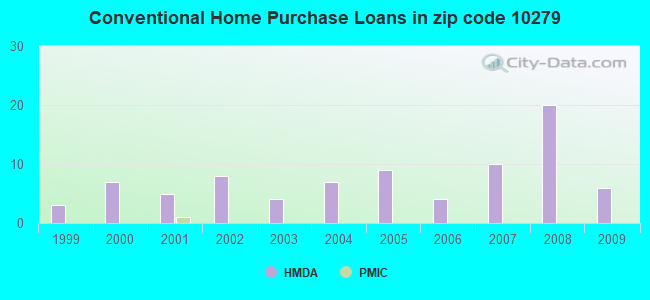
Home Mortgage Disclosure Act Aggregated Statistics For Year 2009
(Based on 2 partial tracts)
|
| B) Conventional
Home Purchase Loans | C) Refinancings
| F) Non-occupant Loans on
< 5 Family Dwellings (A B C & D) |
|---|
| Number | Average Value | Number | Average Value | Number | Average Value |
|---|
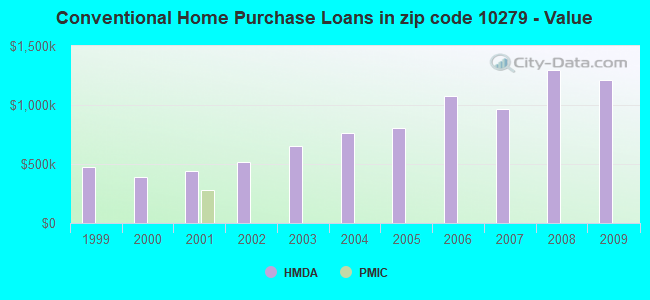
| LOANS ORIGINATED | 6 | $1,211,880 | 5 | $889,450 | 1 | $1,282,810 |
| APPLICATIONS APPROVED, NOT ACCEPTED | 1 | $2,158,620 | 2 | $463,980 | 0 | $0 |
| APPLICATIONS DENIED | 3 | $1,650,410 | 3 | $1,463,500 | 1 | $807,520 |
| APPLICATIONS WITHDRAWN | 1 | $2,158,430 | 3 | $566,457 | 1 | $390,020 |
| FILES CLOSED FOR INCOMPLETENESS | 0 | $0 | 1 | $833,320 | 0 | $0 |
Aggregated Statistics For Year 2008
(Based on 2 partial tracts)
|
| B) Conventional
Home Purchase Loans | C) Refinancings
| F) Non-occupant Loans on
< 5 Family Dwellings (A B C & D) |
|---|
| Number | Average Value | Number | Average Value | Number | Average Value |
|---|
| LOANS ORIGINATED | 20 | $1,294,079 | 2 | $763,300 | 4 | $1,055,272 |
| APPLICATIONS APPROVED, NOT ACCEPTED | 6 | $1,244,710 | 1 | $936,310 | 1 | $612,230 |
| APPLICATIONS DENIED | 10 | $1,522,130 | 1 | $1,238,910 | 2 | $951,975 |
| APPLICATIONS WITHDRAWN | 6 | $1,555,830 | 1 | $419,940 | 1 | $764,000 |
| FILES CLOSED FOR INCOMPLETENESS | 1 | $1,782,950 | 0 | $0 | 0 | $0 |
Aggregated Statistics For Year 2007
(Based on 2 partial tracts)
|
| B) Conventional
Home Purchase Loans | C) Refinancings
| F) Non-occupant Loans on
< 5 Family Dwellings (A B C & D) |
|---|
| Number | Average Value | Number | Average Value | Number | Average Value |
|---|
| LOANS ORIGINATED | 10 | $964,348 | 3 | $492,543 | 2 | $783,840 |
| APPLICATIONS APPROVED, NOT ACCEPTED | 7 | $1,081,487 | 1 | $394,800 | 1 | $701,340 |
| APPLICATIONS DENIED | 5 | $1,151,320 | 1 | $729,860 | 1 | $551,830 |
| APPLICATIONS WITHDRAWN | 2 | $1,251,575 | 1 | $461,030 | 1 | $362,160 |
| FILES CLOSED FOR INCOMPLETENESS | 1 | $644,410 | 0 | $0 | 0 | $0 |
Aggregated Statistics For Year 2006
(Based on 2 partial tracts)
|
| B) Conventional
Home Purchase Loans | C) Refinancings
| F) Non-occupant Loans on
< 5 Family Dwellings (A B C & D) |
|---|
| Number | Average Value | Number | Average Value | Number | Average Value |
|---|
| LOANS ORIGINATED | 4 | $1,078,230 | 2 | $771,645 | 1 | $360,570 |
| APPLICATIONS APPROVED, NOT ACCEPTED | 1 | $870,280 | 1 | $405,310 | 0 | $0 |
| APPLICATIONS DENIED | 2 | $849,405 | 2 | $268,125 | 0 | $0 |
| APPLICATIONS WITHDRAWN | 1 | $636,810 | 1 | $942,970 | 0 | $0 |
| FILES CLOSED FOR INCOMPLETENESS | 0 | $0 | 0 | $0 | 0 | $0 |
Aggregated Statistics For Year 2005
(Based on 2 partial tracts)
|
| B) Conventional
Home Purchase Loans | C) Refinancings
| F) Non-occupant Loans on
< 5 Family Dwellings (A B C & D) |
|---|
| Number | Average Value | Number | Average Value | Number | Average Value |
|---|
| LOANS ORIGINATED | 9 | $807,024 | 3 | $689,587 | 1 | $401,840 |
| APPLICATIONS APPROVED, NOT ACCEPTED | 1 | $1,061,720 | 1 | $337,120 | 0 | $0 |
| APPLICATIONS DENIED | 1 | $965,110 | 1 | $626,870 | 0 | $0 |
| APPLICATIONS WITHDRAWN | 1 | $766,350 | 1 | $237,780 | 0 | $0 |
| FILES CLOSED FOR INCOMPLETENESS | 1 | $504,080 | 0 | $0 | 0 | $0 |
Aggregated Statistics For Year 2004
(Based on 2 partial tracts)
|
| B) Conventional
Home Purchase Loans | C) Refinancings
| F) Non-occupant Loans on
< 5 Family Dwellings (A B C & D) |
|---|
| Number | Average Value | Number | Average Value | Number | Average Value |
|---|
| LOANS ORIGINATED | 7 | $761,803 | 4 | $504,645 | 1 | $416,000 |
| APPLICATIONS APPROVED, NOT ACCEPTED | 1 | $659,230 | 1 | $398,740 | 0 | $0 |
| APPLICATIONS DENIED | 2 | $762,405 | 1 | $497,420 | 0 | $0 |
| APPLICATIONS WITHDRAWN | 1 | $704,910 | 0 | $0 | 0 | $0 |
| FILES CLOSED FOR INCOMPLETENESS | 0 | $0 | 0 | $0 | 0 | $0 |
Aggregated Statistics For Year 2003
(Based on 2 partial tracts)
|
| B) Conventional
Home Purchase Loans | C) Refinancings
| F) Non-occupant Loans on
< 5 Family Dwellings (A B C & D) |
|---|
| Number | Average Value | Number | Average Value | Number | Average Value |
|---|
| LOANS ORIGINATED | 4 | $651,840 | 12 | $437,257 | 1 | $450,150 |
| APPLICATIONS APPROVED, NOT ACCEPTED | 1 | $911,450 | 2 | $330,080 | 0 | $0 |
| APPLICATIONS DENIED | 1 | $621,800 | 2 | $511,630 | 0 | $0 |
| APPLICATIONS WITHDRAWN | 1 | $352,880 | 1 | $482,230 | 0 | $0 |
| FILES CLOSED FOR INCOMPLETENESS | 0 | $0 | 1 | $303,630 | 0 | $0 |
Aggregated Statistics For Year 2002
(Based on 2 partial tracts)
|
| B) Conventional
Home Purchase Loans | C) Refinancings
| F) Non-occupant Loans on
< 5 Family Dwellings (A B C & D) |
|---|
| Number | Average Value | Number | Average Value | Number | Average Value |
|---|
| LOANS ORIGINATED | 8 | $515,244 | 7 | $362,201 | 1 | $307,100 |
| APPLICATIONS APPROVED, NOT ACCEPTED | 2 | $524,340 | 1 | $661,380 | 0 | $0 |
| APPLICATIONS DENIED | 2 | $491,280 | 2 | $655,145 | 0 | $0 |
| APPLICATIONS WITHDRAWN | 1 | $594,600 | 0 | $0 | 0 | $0 |
| FILES CLOSED FOR INCOMPLETENESS | 1 | $332,330 | 0 | $0 | 0 | $0 |
Aggregated Statistics For Year 2001
(Based on 2 partial tracts)
|
| B) Conventional
Home Purchase Loans | C) Refinancings
|
|---|
| Number | Average Value | Number | Average Value |
|---|
| LOANS ORIGINATED | 5 | $442,604 | 4 | $399,845 |
| APPLICATIONS APPROVED, NOT ACCEPTED | 1 | $574,900 | 1 | $240,780 |
| APPLICATIONS DENIED | 1 | $451,830 | 1 | $585,870 |
| APPLICATIONS WITHDRAWN | 0 | $0 | 1 | $98,400 |
| FILES CLOSED FOR INCOMPLETENESS | 0 | $0 | 0 | $0 |
Aggregated Statistics For Year 2000
(Based on 2 partial tracts)
|
| B) Conventional
Home Purchase Loans | C) Refinancings
| E) Loans on Dwellings For 5+ Families
|
|---|
| Number | Average Value | Number | Average Value | Number | Average Value |
|---|
| LOANS ORIGINATED | 7 | $393,290 | 1 | $378,580 | 1 | $1,413,100 |
| APPLICATIONS APPROVED, NOT ACCEPTED | 1 | $422,760 | 0 | $0 | 0 | $0 |
| APPLICATIONS DENIED | 2 | $734,265 | 0 | $0 | 0 | $0 |
| APPLICATIONS WITHDRAWN | 1 | $349,590 | 0 | $0 | 0 | $0 |
| FILES CLOSED FOR INCOMPLETENESS | 0 | $0 | 0 | $0 | 0 | $0 |
Aggregated Statistics For Year 1999
(Based on 1 partial tract)
|
| B) Conventional
Home Purchase Loans | C) Refinancings
|
|---|
| Number | Average Value | Number | Average Value |
|---|
| LOANS ORIGINATED | 3 | $471,670 | 1 | $380,800 |
| APPLICATIONS APPROVED, NOT ACCEPTED | 0 | $0 | 0 | $0 |
| APPLICATIONS DENIED | 0 | $0 | 1 | $95,770 |
| APPLICATIONS WITHDRAWN | 0 | $0 | 0 | $0 |
| FILES CLOSED FOR INCOMPLETENESS | 0 | $0 | 0 | $0 |
Private Mortgage Insurance Companies Aggregated Statistics For Year 2001
(Based on 2 partial tracts)
|
| A) Conventional
Home Purchase Loans |
|---|
| Number | Average Value |
|---|
| LOANS ORIGINATED | 1 | $276,520 |
| APPLICATIONS APPROVED, NOT ACCEPTED | 1 | $225,120 |
| APPLICATIONS DENIED | 0 | $0 |
| APPLICATIONS WITHDRAWN | 0 | $0 |
| FILES CLOSED FOR INCOMPLETENESS | 0 | $0 |
Businesses in zip code 10279


 Nearest zip codes: 10007, 10271, 10006, 10278, 10005, 10038.