Estimated zip code population in 2022: 7,270 Zip code population in 2010: 7,322 Zip code population in 2000: 7,464
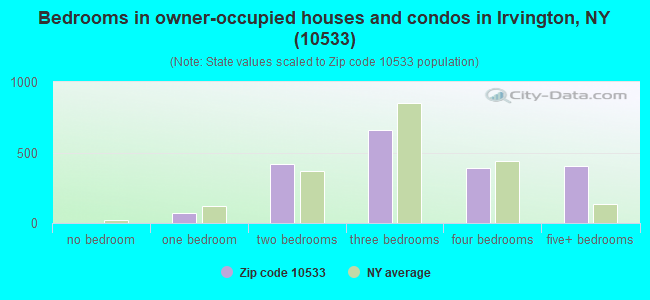
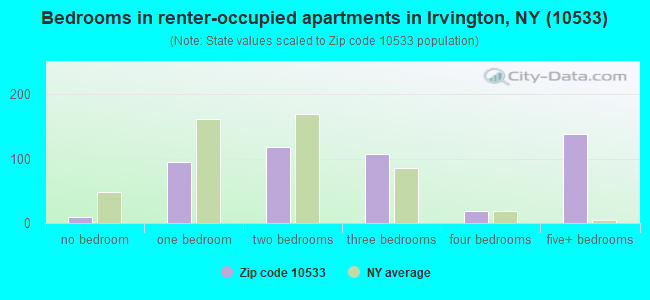
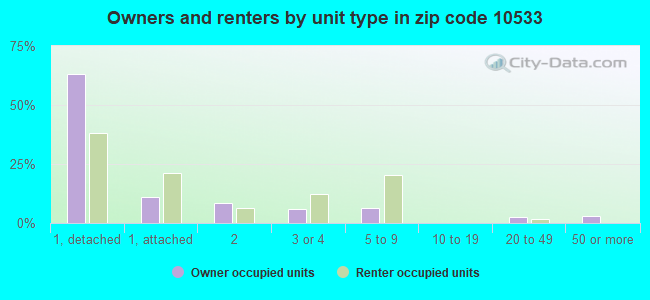
Houses and condos: 2,884 Renter-occupied apartments: 509
% of renters here:
21%
State:
46%
March 2022 cost of living index in zip code 10533: 149.9 (very high, U.S. average is 100)
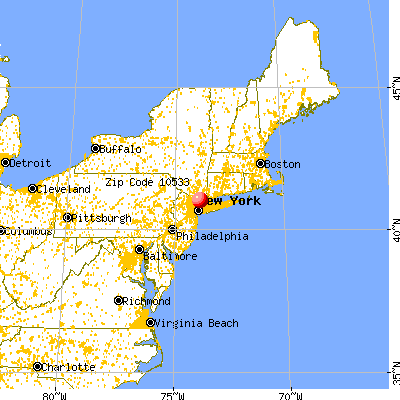
Land area: 3.6 sq. mi. Water area: 0.1 sq. mi.
Population density: 2,045 people per square mile
(low).
OSM Map
General Map
Google Map
MSN Map
OSM Map
General Map
Google Map
MSN Map
OSM Map
General Map
Google Map
MSN Map
OSM Map
General Map
Google Map
MSN Map
Please wait while loading the map...
Real estate property taxes paid for housing units in 2022:
This zip code:
1.0% ($9,805)
New York:
1.5% ($6,180)
Median real estate property taxes paid for housing units with mortgages in 2022: $9,858 (1.1%) Median real estate property taxes paid for housing units with no mortgage in 2022: $9,755 (1.0%)
Business Search- 14 Million verified businesses
Males: 3,643
(50.1%)
Females: 3,627
(49.9%)
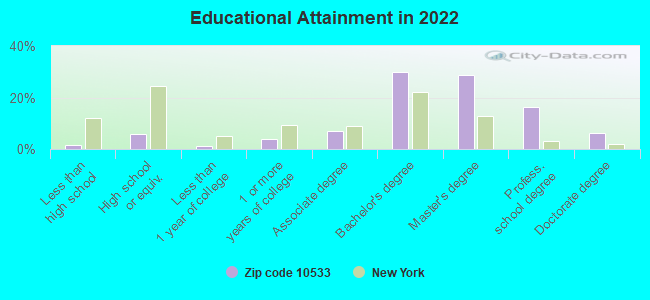
For population 25 years and over in 10533:
High school or higher: 100.1%
Bachelor's degree or higher: 82.0%
Graduate or professional degree: 51.8%
Unemployed: 2.3%
Mean travel time to work (commute): 39.6 minutes
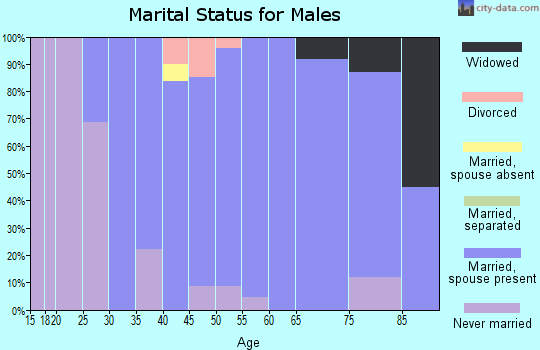
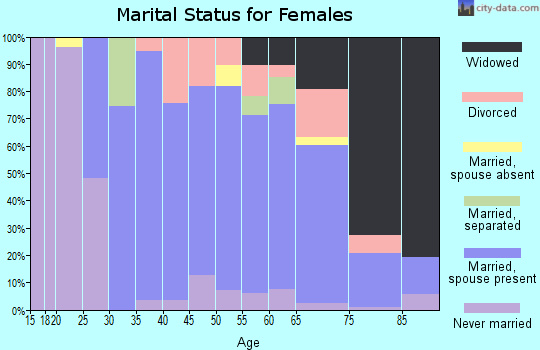
For population 15 years and over in 10533:
Never married: 21.2%
Now married: 71.0%
Separated: 1.8%
Widowed: 1.1%
Divorced: 5.0%
Zip code 10533 compared to state average:
Median household income significantly above state average.
Median house value significantly above state average.
Unemployed percentage below state average.
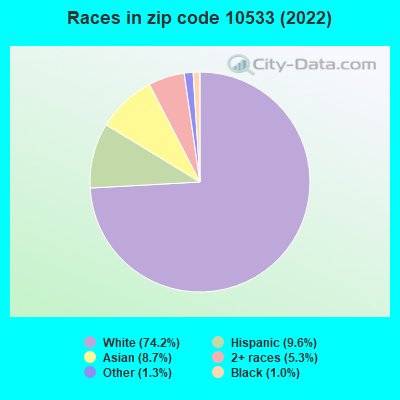
Black race population percentage significantly below state average.
Hispanic race population percentage below state average.
Renting percentage below state average.
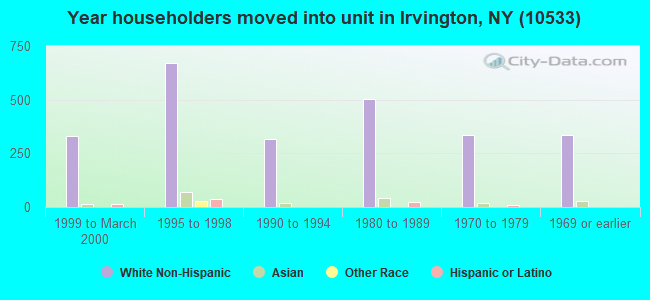
Length of stay since moving in significantly below state average.
Number of rooms per house above state average.
Number of college students below state average.
Percentage of population with a bachelor's degree or higher above state average.
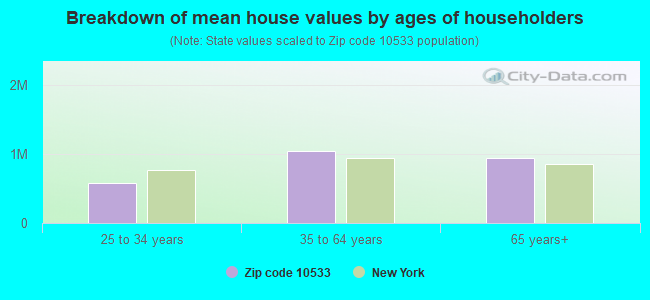
Estimated median house/condo value in 2022: $941,529
10533:
$941,529
New York:
$400,400
According to our research of New York and other state lists, there was 1 registered sex offender living in 10533 zip code as of May 21, 2024. The ratio of all residents to sex offenders in zip code 10533 is 7,698 to 1. The ratio of registered sex offenders to all residents in this zip code is much lower than the state average.
Median resident age:
This zip code:
41.8 years
New York median age:
40.0 years
Average household size:
This zip code:
2.9 people
New York:
2.5 people
Averages for the 2020 tax year for zip code 10533, filed in 2021:
Average Adjusted Gross Income (AGI) in 2020: $333,268 (Individual Income Tax Returns)
Here:
$333,268
State:
$90,930
Salary/wage: $249,949 (reported on 77.8% of returns)
Here:
$249,949
State:
$72,104
(% of AGI for various income ranges: 1142.2% for AGIs below $25k, 3603.9% for AGIs $25k-50k, 7048.3% for AGIs $50k-75k, 9771.6% for AGIs $75k-100k, 20902.7% for AGIs $100k-200k, 197307.4% for AGIs over 200k)
Taxable interest for individuals: $5,164 (reported on 62.3% of returns)
This zip code:
$5,164
New York:
$3,075
(% of AGI for various income ranges: 45.0% for AGIs below $25k, 126.1% for AGIs $25k-50k, 102.2% for AGIs $50k-75k, 233.7% for AGIs $75k-100k, 333.6% for AGIs $100k-200k, 3166.8% for AGIs over 200k)
Ordinary dividends: $23,734 (reported on 57.0% of returns)
Here:
$23,734
State:
$11,095
(% of AGI for various income ranges: 207.2% for AGIs below $25k, 252.6% for AGIs $25k-50k, 334.8% for AGIs $50k-75k, 474.7% for AGIs $75k-100k, 1354.2% for AGIs $100k-200k, 13925.2% for AGIs over 200k)
Net capital gain/loss in AGI: +$100,114 (reported on 52.7% of returns)
Here:
+$100,114
State:
+$44,925
(% of AGI for various income ranges: 173.4% for AGIs below $25k, 248.7% for AGIs $25k-50k, 166.1% for AGIs $50k-75k, 363.7% for AGIs $75k-100k, 1040.3% for AGIs $100k-200k, 61803.5% for AGIs over 200k)
Profit/loss from business: +$49,036 (reported on 22.7% of returns)
Here:
+$49,036
State:
+$14,940
(% of AGI for various income ranges: 234.1% for AGIs below $25k, 368.3% for AGIs $25k-50k, 396.5% for AGIs $50k-75k, 749.5% for AGIs $75k-100k, 1548.8% for AGIs $100k-200k, 10528.4% for AGIs over 200k)
Taxable individual retirement arrangement distribution: $33,609 (reported on 11.8% of returns)
10533:
$33,609
New York:
$19,609
(% of AGI for various income ranges: 89.7% for AGIs below $25k, 179.1% for AGIs $25k-50k, 296.5% for AGIs $50k-75k, 490.5% for AGIs $75k-100k, 1055.5% for AGIs $100k-200k, 2900.6% for AGIs over 200k)
Self-employed (Keogh) retirement plans: $42,000 (reported on 6.1% of returns)
10533:
$42,000
New York:
$32,497
(% of AGI for various income ranges: 232.1% for AGIs $100k-200k, 2869.0% for AGIs over 200k)
Total itemized deductions: $46,747 (reported on 31.0% of returns)
Here:
$46,747
State:
$39,326
(% of AGI for various income ranges: 260.9% for AGIs below $25k, 337.0% for AGIs $25k-50k, 616.5% for AGIs $50k-75k, 1063.7% for AGIs $75k-100k, 2253.3% for AGIs $100k-200k, 13464.8% for AGIs over 200k)
Charity contributions: $17,106 (reported on 27.8% of returns)
Here:
$17,106
State:
$15,420
(% of AGI for various income ranges: 45.2% for AGIs $25k-50k, 90.0% for AGIs $50k-75k, 144.2% for AGIs $75k-100k, 268.5% for AGIs $100k-200k, 5264.2% for AGIs over 200k)
Taxes paid: $9,874 (reported on 31.0% of returns)
10533:
$9,874
State:
$9,183
(% of AGI for various income ranges: 70.6% for AGIs below $25k, 120.9% for AGIs $25k-50k, 173.5% for AGIs $50k-75k, 326.3% for AGIs $75k-100k, 698.2% for AGIs $100k-200k, 2460.3% for AGIs over 200k)
Earned income credit: $1,442 (reported on 3.2% of returns)
Here:
$1,442
State:
$2,138
(% of AGI for various income ranges: 33.1% for AGIs below $25k, 29.1% for AGIs $25k-50k)
Percentage of individuals using paid preparers for their 2020 taxes: 94.9%
Here:
95%
State:
95%
(% for various income ranges: 94.2% for AGIs below $25k, 94.7% for AGIs $25k-50k, 94.6% for AGIs $50k-75k, 94.1% for AGIs $75k-100k, 93.3% for AGIs $100k-200k, 96.7% for AGIs over 200k)
Averages for the 2012 tax year for zip code 10533, filed in 2013:
Average Adjusted Gross Income (AGI) in 2012: $243,068 (Individual Income Tax Returns)
Here:
$243,068
State:
$77,088
Salary/wage: $183,866 (reported on 77.0% of returns)
Here:
$183,866
State:
$60,593
(% of AGI for various income ranges: 63.0% for AGIs below $25k, 68.1% for AGIs $25k-50k, 68.5% for AGIs $50k-75k, 68.5% for AGIs $75k-100k, 68.2% for AGIs $100k-200k, 55.8% for AGIs over 200k)
Taxable interest for individuals: $4,870 (reported on 64.4% of returns)
This zip code:
$4,870
New York:
$3,125
(% of AGI for various income ranges: 3.4% for AGIs below $25k, 2.6% for AGIs $25k-50k, 1.6% for AGIs $50k-75k, 1.0% for AGIs $75k-100k, 1.2% for AGIs $100k-200k, 1.3% for AGIs over 200k)
Ordinary dividends: $19,179 (reported on 53.3% of returns)
Here:
$19,179
State:
$10,299
(% of AGI for various income ranges: 10.1% for AGIs below $25k, 4.3% for AGIs $25k-50k, 3.8% for AGIs $50k-75k, 4.2% for AGIs $75k-100k, 3.6% for AGIs $100k-200k, 4.2% for AGIs over 200k)
Net capital gain/loss in AGI: +$36,718 (reported on 47.2% of returns)
Here:
+$36,718
State:
+$42,474
(% of AGI for various income ranges: 2.4% for AGIs below $25k, 1.2% for AGIs $25k-50k, 1.2% for AGIs $50k-75k, 1.0% for AGIs $75k-100k, 1.3% for AGIs $100k-200k, 8.6% for AGIs over 200k)
Profit/loss from business: +$43,537 (reported on 22.2% of returns)
Here:
+$43,537
State:
+$16,168
(% of AGI for various income ranges: 8.9% for AGIs below $25k, 6.5% for AGIs $25k-50k, 3.9% for AGIs $50k-75k, 2.8% for AGIs $75k-100k, 6.0% for AGIs $100k-200k, 3.6% for AGIs over 200k)
Taxable individual retirement arrangement distribution: $37,330 (reported on 15.8% of returns)
10533:
$37,330
New York:
$17,621
(% of AGI for various income ranges: 4.8% for AGIs below $25k, 4.3% for AGIs $25k-50k, 4.4% for AGIs $50k-75k, 4.0% for AGIs $75k-100k, 4.2% for AGIs $100k-200k, 2.0% for AGIs over 200k)
Self-employment retirement plans: $36,481 (reported on 5.5% of returns)
10533:
$36,481
New York:
$27,330
Total itemized deductions: $67,337 (18% of AGI, reported on 62.3% of returns)
Here:
$67,337
State:
$34,985
Here:
18.1% of AGI
State:
21.3% of AGI
(% of AGI for various income ranges: 24.8% for AGIs below $25k, 22.6% for AGIs $25k-50k, 20.9% for AGIs $50k-75k, 20.9% for AGIs $75k-100k, 24.5% for AGIs $100k-200k, 15.7% for AGIs over 200k)
Charity contributions: $6,744 (reported on 57.0% of returns)
Here:
$6,744
State:
$5,572
(% of AGI for various income ranges: 1.1% for AGIs below $25k, 1.6% for AGIs $25k-50k, 1.9% for AGIs $50k-75k, 2.0% for AGIs $75k-100k, 1.9% for AGIs $100k-200k, 1.5% for AGIs over 200k)
Taxes paid: $45,198 (reported on 62.0% of returns)
10533:
$45,198
State:
$18,656
(% of AGI for various income ranges: 8.4% for AGIs below $25k, 10.6% for AGIs $25k-50k, 9.3% for AGIs $50k-75k, 11.3% for AGIs $75k-100k, 13.3% for AGIs $100k-200k, 11.4% for AGIs over 200k)
Earned income credit: $1,813 (reported on 4.0% of returns)
Here:
$1,813
State:
$2,230
(% of AGI for various income ranges: 2.4% for AGIs below $25k, 0.4% for AGIs $25k-50k)
Percentage of individuals using paid preparers for their 2012 taxes: 72.0%
Here:
72%
State:
66%
(% for various income ranges: 66.3% for AGIs below $25k, 71.4% for AGIs $25k-50k, 71.4% for AGIs $50k-75k, 67.6% for AGIs $75k-100k, 73.3% for AGIs $100k-200k, 79.1% for AGIs over 200k)
Averages for the 2004 tax year for zip code 10533, filed in 2005:
Average Adjusted Gross Income (AGI) in 2004: $167,799 (Individual Income Tax Returns)
Here:
$167,799
State:
$59,519
Salary/wage: $141,098 (reported on 73.3% of returns)
Here:
$141,098
State:
$50,673
(% of AGI for various income ranges: 52.8% for AGIs $10k-25k, 67.9% for AGIs $25k-50k, 69.9% for AGIs $50k-75k, 69.8% for AGIs $75k-100k, 59.7% for AGIs over 100k)
Taxable interest for individuals: $3,550 (reported on 75.9% of returns)
This zip code:
$3,550
New York:
$2,377
(% of AGI for various income ranges: 4.0% for AGIs $10k-25k, 3.2% for AGIs $25k-50k, 2.2% for AGIs $50k-75k, 1.7% for AGIs $75k-100k, 1.4% for AGIs over 100k)
Taxable dividends: $8,234 (reported on 60.8% of returns)
Here:
$8,234
State:
$5,394
(% of AGI for various income ranges: 7.7% for AGIs $10k-25k, 4.1% for AGIs $25k-50k, 3.4% for AGIs $50k-75k, 2.6% for AGIs $75k-100k, 2.8% for AGIs over 100k)
Net capital gain/loss: +$26,783 (reported on 53.0% of returns)
Here:
+$26,783
State:
+$23,581
(% of AGI for various income ranges: 2.1% for AGIs $10k-25k, 1.2% for AGIs $25k-50k, 1.2% for AGIs $50k-75k, 1.4% for AGIs $75k-100k, 9.5% for AGIs over 100k)
Profit/loss from business: +$39,203 (reported on 22.5% of returns)
Here:
+$39,203
State:
+$13,809
(% of AGI for various income ranges: 8.8% for AGIs $10k-25k, 6.2% for AGIs $25k-50k, 4.0% for AGIs $50k-75k, 7.0% for AGIs $75k-100k, 5.1% for AGIs over 100k)
IRA payment deduction: $3,565 (reported on 3.6% of returns)
10533:
$3,565
New York:
$3,115
(% of AGI for various income ranges: 0.5% for AGIs $25k-50k, 0.2% for AGIs $50k-75k, 0.3% for AGIs $75k-100k, 0.0% for AGIs over 100k)
Self-employed pension: $26,326 (reported on 6.5% of returns)
Here:
$26,326
New York:
$19,016
Total itemized deductions: $48,293 (18% of AGI, reported on 58.9% of returns)
Here:
$48,293
State:
$25,864
Here:
17.8% of AGI
State:
21.9% of AGI
(% of AGI for various income ranges: 24.5% for AGIs $10k-25k, 25.0% for AGIs $25k-50k, 21.9% for AGIs $50k-75k, 22.5% for AGIs $75k-100k, 15.8% for AGIs over 100k)
Charity contributions deductions: $7,140 (3% of AGI, reported on 55.5% of returns)
Here:
$7,140
State:
$4,439
Here:
2.5% of AGI
State:
3.6% of AGI
(% of AGI for various income ranges: 1.6% for AGIs $10k-25k, 2.6% for AGIs $25k-50k, 2.3% for AGIs $50k-75k, 2.4% for AGIs $75k-100k, 2.3% for AGIs over 100k)
Total tax: $45,206 (reported on 82.5% of returns)
10533:
$45,206
State:
$11,730
(% of AGI for various income ranges: 5.0% for AGIs $10k-25k, 7.5% for AGIs $25k-50k, 10.3% for AGIs $50k-75k, 11.3% for AGIs $75k-100k, 23.9% for AGIs over 100k)
Earned income credit: $1,257 (reported on 2.9% of returns)
Here:
$1,257
State:
$1,757
Percentage of individuals using paid preparers for their 2004 taxes: 73.5%
Here:
74%
State:
67%
(% for various income ranges: 73.2% for AGIs below $10k, 68.4% for AGIs $10k-25k, 69.6% for AGIs $25k-50k, 74.1% for AGIs $50k-75k, 71.4% for AGIs $75k-100k, 77.0% for AGIs over 100k)
Household received Food Stamps/SNAP in the past 12 months: 12 Household did not receive Food Stamps/SNAP in the past 12 months: 2,411
Women who had a birth in the past 12 months: 47 (47 now married, 0 unmarried) Women who did not have a birth in the past 12 months: 1,541 (871 now married, 654 unmarried)
Housing units in zip code 10533 with a mortgage: 1,238 (149 second mortgage, 122 both second mortgage and home equity loan) Houses without a mortgage: 23
Median monthly owner costs for units with a mortgage: $3,860 Median monthly owner costs for units without a mortgage: $1,487
Residents with income below the poverty level in 2022:
This zip code:
1.7%
Whole state:
14.3%
Residents with income below 50% of the poverty level in 2022:
This zip code:
0.5%
Whole state:
6.8%
Median number of rooms in houses and condos:
Here:
7.1
State:
6.3
Median number of rooms in apartments:
Here:
5.1
State:
3.8
Notable locations in this zip code not listed on our city pages
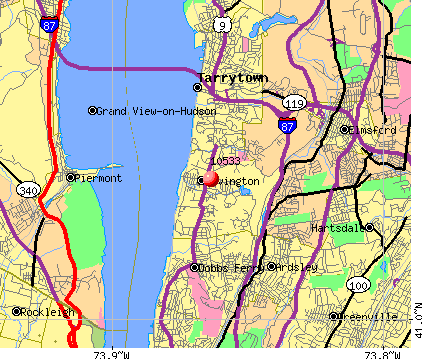
Notable locations in zip code 10533: Ardsley Country Club (A), Ardsley Station (B), Irvington Station (C), Irvington Village Hall (D), Frances T M Mahoney Hall (E), Verrazzano Hall (F), Irvington Public Library (G), Irvington Fire Department (H). Display/hide their locations on the map
In group quarters: 39 (-1 institutionalized population)
Size of family households: 646 2-persons, 518 3-persons, 530 4-persons, 161 5-persons, 200 6-persons, 15 7-or-more-persons
Size of nonfamily households: 292 1-person, 58 2-persons
1,919 married couples with children.
202 single-parent households (32 men, 170 women).
79.9% of residents of 10533 zip code speak English at home.
5.6% of residents speak Spanish at home (100% very well).
10.1% of residents speak other Indo-European language at home (88% very well, 9% well, 4% not well).
3.6% of residents speak Asian or Pacific Island language at home (47% very well, 47% well, 6% not at all).
0.1% of residents speak other language at home (100% very well).
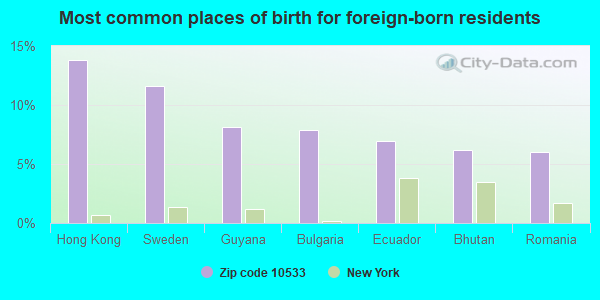
Foreign born population: 1,360 (18.7%) (70.1% of them are naturalized citizens)
This zip code:
18.7%
Whole state:
22.7%
14%Hong Kong
12%Sweden
8%Guyana
8%Bulgaria
7%Ecuador
6%Bhutan
6%Romania
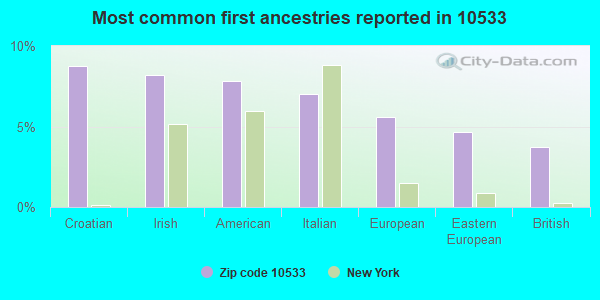
9%Croatian
8%Irish
8%American
7%Italian
6%European
5%Eastern European
4%British
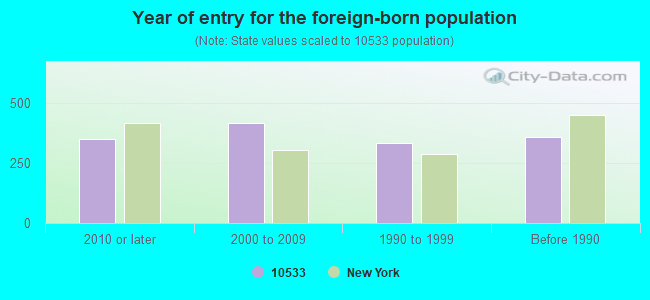
Year of entry for the foreign-born population
3512010 or later
4182000 to 2009
3351990 to 1999
357Before 1990
Facilities with environmental interests located in this zip code:
ABBOTT HOUSE (100 N BROADWAY in IRVINGTON, NY)
(Integrated Compliance Information System) - ICIS-HQ-1985-0026, FORMAL ENFORCEMENT ACTION COMPLIANCE ACTIVITY (Tracking inspections of insecticide, fungicide, and rodenticide, and toxic substances) Large Quantity Generators, more that 1000 kg of hazardous waste/month (Resource Conservation and Recovery Act (tracking hazardous waste)) - notification Business SIC classification: ELEMENTARY AND SECONDARY SCHOOLS Alternative names: ABBOTT UNION FREE SCHOOL DIST, ABBOTT UNION FREE SD
ABBOTT SCHOOL ( in IRVINGTON, NY)
(National Center for Education Statistics) - STATE ID-660413020002 Organizations: ABBOTT UFSD (SCHOOL DISTRICT)
IRVINGTON HS ( in IRVINGTON, NY)
(National Center for Education Statistics) - STATE ID-660402020001 Organizations: IRVINGTON UFSD (SCHOOL DISTRICT)
IMMACULATE CONCEPTION (16 NORTH BROADWAY in IRVINGTON, NY)
(Integrated Compliance Information System) - ICIS-02-1988-0692, FORMAL ENFORCEMENT ACTION Business SIC classification: ELEMENTARY AND SECONDARY SCHOOLS; RELIGIOUS ORGANIZATIONS
IRVINGTON UFSD - HIGH SCHOOL (40 N BROADWAY in IRVINGTON, NY)
COMPLIANCE ACTIVITY (Tracking inspections of insecticide, fungicide, and rodenticide, and toxic substances) (Resource Conservation and Recovery Act (tracking hazardous waste)) Alternative names: IRVINGTON UNION FREE SCHOOL DIST
IRVINGTON UFSD - MIDDLE SCHOOL (101 MAIN ST in IRVINGTON, NY)
ENFORCEMENT/COMPLIANCE ACTIVITY (Integrated Compliance Information System) COMPLIANCE ACTIVITY (Tracking inspections of insecticide, fungicide, and rodenticide, and toxic substances) (Resource Conservation and Recovery Act (tracking hazardous waste)) Alternative names: IRVINGTON MS, MAIN ST SCHOOL, MAIN STREET SCHOOL
IRVINGTON RUGS & CLEANERS INC (53 MAIN ST in IRVINGTON, NY)
(Resource Conservation and Recovery Act (tracking hazardous waste)) Small Quantity Generators, between 100 kg and 1000 kg of hazardous waste/month (Resource Conservation and Recovery Act (tracking hazardous waste)) Alternative names: IRVINGTON CLEANERS
IRVINGTON TOWN OF IRVINGTON TOWN HALL (85 MAIN ST in IRVINGTON, NY)
(Resource Conservation and Recovery Act (tracking hazardous waste))
CON ED - 24 ALTA VISTA CIRCLE (24 ALTA VISTA CIR in IRVINGTON, NY)
HAZARDOUS WASTE BIENNIAL REPORTER (Resource Conservation and Recovery Act (tracking hazardous waste)) (Resource Conservation and Recovery Act (tracking hazardous waste))
ADVANCE TRANSIT CO INC (29 BRIDGE ST in IRVINGTON, NY)
(Resource Conservation and Recovery Act (tracking hazardous waste))
ALPS MECHANICAL INC (18 N ECKAR ST in IRVINGTON, NY)
(Resource Conservation and Recovery Act (tracking hazardous waste))
IRVINGTON UFSD (6 DOWS LANE in IRVINGTON, NY)
(Resource Conservation and Recovery Act (tracking hazardous waste))
COLUMBIA UNIVERSITY NEVIS LABORATORIES (136 SOUTH BROADWAY in IRVINGTON, NY)
Small Quantity Generators, between 100 kg and 1000 kg of hazardous waste/month (Resource Conservation and Recovery Act (tracking hazardous waste))
Housing units lacking complete plumbing facilities: 0.5% Housing units lacking complete kitchen facilities: 0.5%
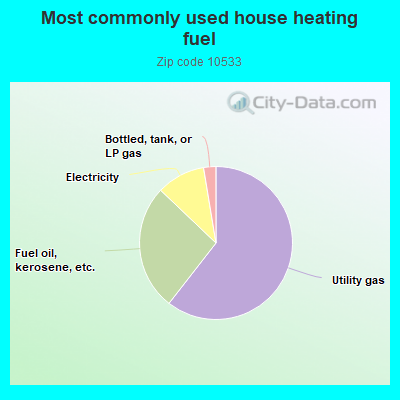
60.6%Utility gas
26.6%Fuel oil, kerosene, etc.
10.3%Electricity
2.6%Bottled, tank, or LP gas
Population in 1990: 7,498.
Place of birth for U.S.-born residents:
This state: 4,055
Northeast: 996
Midwest: 161
South: 256
West: 344
64% of the 10533 zip code residents lived in the same house 5 years ago. Out of people who lived in different houses, 61% lived in this county. Out of people who lived in different counties, 50% lived in New York.
89% of the 10533 zip code residents lived in the same house 1 year ago. Out of people who lived in different houses, 56% moved from this county. Out of people who lived in different houses, 8% moved from different county within same state. Out of people who lived in different houses, 31% moved from different state. Out of people who lived in different houses, 5% moved from abroad.
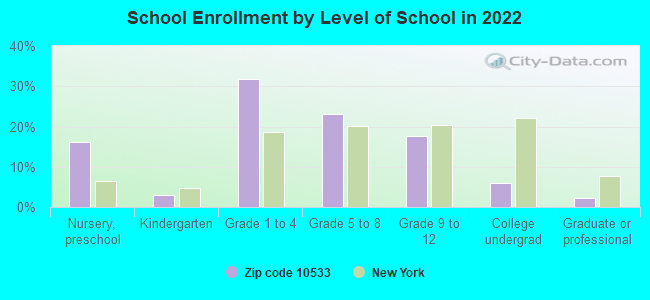
Private vs. public school enrollment:
Students in private schools in grades 1 to 8 (elementary and middle school): 87
Here:
6.9%
New York:
15.6%
Students in private schools in grades 9 to 12 (high school): 50
Here:
12.5%
New York:
15.0%
Students in private undergraduate colleges: 90
Here:
64.9%
New York:
39.2%
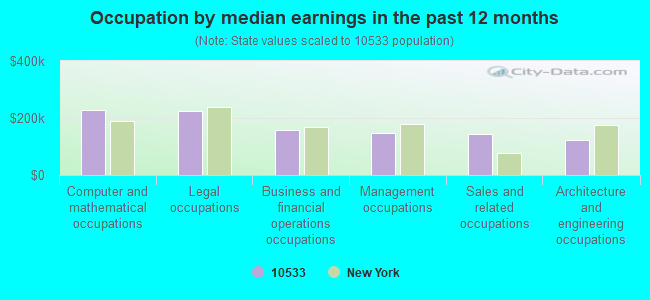
Occupation by median earnings in the past 12 months ($)
228,763Computer and mathematical occupations
224,154Legal occupations
158,255Business and financial operations occupations
148,776Management occupations
145,278Sales and related occupations
123,746Architecture and engineering occupations
Companies with federal contracts located in this zip code:
OPTIMA COMMUNICATIONS SYSTEMS (50 SOUTH BUCKHOUT STREET in IRVINGTON, NY; small business) : $14,906 in 4 contractsfrom 2002 to 2005
$5,810 with Army for Headsets, Handsets, Microphones and Speakers. Signed on 2004-07-19. Completion date: 2004-08-13.
$5,711 with Army for Fiber Optic Cables. Taking place in CT. Signed on 2002-08-08. Completion date: 2002-06-28.
$2,665 with Navy for Telephone and Telegraph Equipment. Signed on 2003-04-11. Completion date: 2003-05-12.
$720 with Navy for Miscellaneous Electric Power and Distribution Equipment. Signed on 2005-09-10. Completion date: 2005-09-14.
Top industries in this zip code by the number of employees in 2005:
Wholesale Trade: Women's, Children's, and Infants' Clothing and Accessories Merchant Wholesalers (250-499 employees: 1 establishment)
Health Care and Social Assistance: Other Residential Care Facilities (100-249: 1)
Finance and Insurance: Third Party Administration of Insurance and Pension Funds (20-49: 2, 5-9: 1, 1-4: 1)
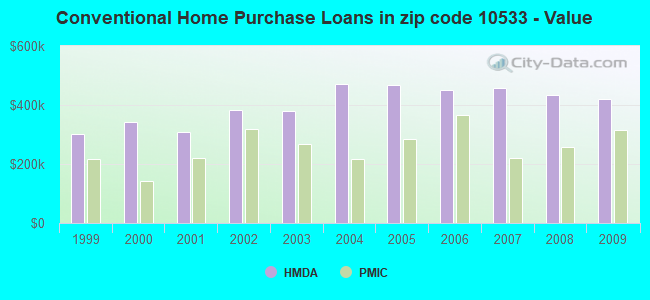
Detailed PMIC statistics for the following Tracts:0111.01
, 0113.00
2002 - 2018 National Fire Incident Reporting System (NFIRS) incidents
According to the data from the years 2002 - 2018 the average number of fires per year is 16. The highest number of fire incidents - 30 took place in 2006, and the least - 5 in 2011. The data has a declining trend.
When looking into fire subcategories, the most reports belonged to: Structure Fires (63.6%), and Outside Fires (23.6%).
Fire incident types reported to NFIRS in Zip Code 10533


 Nearest zip codes: 10503, 10522, 10502, 10523, 10607, 10530.


 According to the data from the years 2002 - 2018 the average number of fires per year is 16. The highest number of fire incidents - 30 took place in 2006, and the least - 5 in 2011. The data has a declining trend.
 When looking into fire subcategories, the most reports belonged to: Structure Fires (63.6%), and Outside Fires (23.6%).