Estimated zip code population in 2022: 10,358
Zip code population in 2010: 10,170
Zip code population in 2000: 10,102
Houses and condos: 3,833
Renter-occupied apartments: 1,867
% of renters here:
50%State:
46%
March 2022 cost of living index in zip code 10553: 147.7
(very high, U.S. average is 100)
Land area: 0.7
sq. mi.
Water area: 0.0
sq. mi.
Population density: 14,982 people per square mile (very high).
OSM Map
General Map
Google Map
MSN Map
OSM Map
General Map
Google Map
MSN Map
OSM Map
General Map
Google Map
MSN Map
OSM Map
General Map
Google Map
MSN Map
Please wait while loading the map...
Real estate property taxes paid for housing units in 2022:
This zip code:
2.1% ($9,805)New York:
1.5% ($6,180)
Median real estate property taxes paid for housing units with mortgages in 2022: $9,858 (1.9%)
Median real estate property taxes paid for housing units with no mortgage in 2022: $9,755 (2.4%)
Profiles of local businesses
Business Search - 14 Million verified businesses
Males: 4,510 Females: 5,848
For population 25 years and over in 10553:
High school or higher: 81.8%Bachelor's degree or higher: 42.8%Graduate or professional degree: 14.6%Unemployed: 3.8%Mean travel time to work (commute): 36.4 minutes
For population 15 years and over in 10553:
Never married: 44.8%Now married: 33.9%Separated: 4.2%Widowed: 5.0%Divorced: 12.1%
Zip code 10553 compared to state average:
Black race population percentage significantly above state average. Median age above state average. Foreign-born population percentage above state average. Length of stay since moving in significantly above state average. 7,380 71.3% Black 1,360 13.1% Hispanic or Latino 1,067 10.3% White 281 2.7% Some other race 227 2.2% Two or more races 42 0.4% Asian
Data:
Median household income ($)
Median household income (% change since 2000)
Household income diversity
Ratio of average income to average house value (%)
Ratio of average income to average rent
Median household income ($) - White
Median household income ($) - Black or African American
Median household income ($) - Asian
Median household income ($) - Hispanic or Latino
Median household income ($) - American Indian and Alaska Native
Median household income ($) - Multirace
Median household income ($) - Other Race
Median household income for houses/condos with a mortgage ($)
Median household income for apartments without a mortgage ($)
Races - White alone (%)
Races - White alone (% change since 2000)
Races - Black alone (%)
Races - Black alone (% change since 2000)
Races - American Indian alone (%)
Races - American Indian alone (% change since 2000)
Races - Asian alone (%)
Races - Asian alone (% change since 2000)
Races - Hispanic (%)
Races - Hispanic (% change since 2000)
Races - Native Hawaiian and Other Pacific Islander alone (%)
Races - Native Hawaiian and Other Pacific Islander alone (% change since 2000)
Races - Two or more races (%)
Races - Two or more races (% change since 2000)
Races - Other race alone (%)
Races - Other race alone (% change since 2000)
Racial diversity
Unemployment (%)
Unemployment (% change since 2000)
Unemployment (%) - White
Unemployment (%) - Black or African American
Unemployment (%) - Asian
Unemployment (%) - Hispanic or Latino
Unemployment (%) - American Indian and Alaska Native
Unemployment (%) - Multirace
Unemployment (%) - Other Race
Population density (people per square mile)
Population - Males (%)
Population - Females (%)
Population - Males (%) - White
Population - Males (%) - Black or African American
Population - Males (%) - Asian
Population - Males (%) - Hispanic or Latino
Population - Males (%) - American Indian and Alaska Native
Population - Males (%) - Multirace
Population - Males (%) - Other Race
Population - Females (%) - White
Population - Females (%) - Black or African American
Population - Females (%) - Asian
Population - Females (%) - Hispanic or Latino
Population - Females (%) - American Indian and Alaska Native
Population - Females (%) - Multirace
Population - Females (%) - Other Race
Coronavirus confirmed cases (May 21, 2024)
Deaths caused by coronavirus (May 21, 2024)
Coronavirus confirmed cases (per 100k population) (May 21, 2024)
Deaths caused by coronavirus (per 100k population) (May 21, 2024)
Daily increase in number of cases (May 21, 2024)
Weekly increase in number of cases (May 21, 2024)
Cases doubled (in days) (May 21, 2024)
Hospitalized patients (Apr 18, 2022)
Negative test results (Apr 18, 2022)
Total test results (Apr 18, 2022)
COVID Vaccine doses distributed (per 100k population) (Sep 19, 2023)
COVID Vaccine doses administered (per 100k population) (Sep 19, 2023)
COVID Vaccine doses distributed (Sep 19, 2023)
COVID Vaccine doses administered (Sep 19, 2023)
Likely homosexual households (%)
Likely homosexual households (% change since 2000)
Likely homosexual households - Lesbian couples (%)
Likely homosexual households - Lesbian couples (% change since 2000)
Likely homosexual households - Gay men (%)
Likely homosexual households - Gay men (% change since 2000)
Cost of living index
Median gross rent ($)
Median contract rent ($)
Median monthly housing costs ($)
Median house or condo value ($)
Median house or condo value ($ change since 2000)
Mean house or condo value by units in structure - 1, detached ($)
Mean house or condo value by units in structure - 1, attached ($)
Mean house or condo value by units in structure - 2 ($)
Mean house or condo value by units in structure by units in structure - 3 or 4 ($)
Mean house or condo value by units in structure - 5 or more ($)
Mean house or condo value by units in structure - Boat, RV, van, etc. ($)
Mean house or condo value by units in structure - Mobile home ($)
Median house or condo value ($) - White
Median house or condo value ($) - Black or African American
Median house or condo value ($) - Asian
Median house or condo value ($) - Hispanic or Latino
Median house or condo value ($) - American Indian and Alaska Native
Median house or condo value ($) - Multirace
Median house or condo value ($) - Other Race
Median resident age
Resident age diversity
Median resident age - Males
Median resident age - Females
Median resident age - White
Median resident age - Black or African American
Median resident age - Asian
Median resident age - Hispanic or Latino
Median resident age - American Indian and Alaska Native
Median resident age - Multirace
Median resident age - Other Race
Median resident age - Males - White
Median resident age - Males - Black or African American
Median resident age - Males - Asian
Median resident age - Males - Hispanic or Latino
Median resident age - Males - American Indian and Alaska Native
Median resident age - Males - Multirace
Median resident age - Males - Other Race
Median resident age - Females - White
Median resident age - Females - Black or African American
Median resident age - Females - Asian
Median resident age - Females - Hispanic or Latino
Median resident age - Females - American Indian and Alaska Native
Median resident age - Females - Multirace
Median resident age - Females - Other Race
Commute - mean travel time to work (minutes)
Travel time to work - Less than 5 minutes (%)
Travel time to work - Less than 5 minutes (% change since 2000)
Travel time to work - 5 to 9 minutes (%)
Travel time to work - 5 to 9 minutes (% change since 2000)
Travel time to work - 10 to 19 minutes (%)
Travel time to work - 10 to 19 minutes (% change since 2000)
Travel time to work - 20 to 29 minutes (%)
Travel time to work - 20 to 29 minutes (% change since 2000)
Travel time to work - 30 to 39 minutes (%)
Travel time to work - 30 to 39 minutes (% change since 2000)
Travel time to work - 40 to 59 minutes (%)
Travel time to work - 40 to 59 minutes (% change since 2000)
Travel time to work - 60 to 89 minutes (%)
Travel time to work - 60 to 89 minutes (% change since 2000)
Travel time to work - 90 or more minutes (%)
Travel time to work - 90 or more minutes (% change since 2000)
Marital status - Never married (%)
Marital status - Now married (%)
Marital status - Separated (%)
Marital status - Widowed (%)
Marital status - Divorced (%)
Median family income ($)
Median family income (% change since 2000)
Median non-family income ($)
Median non-family income (% change since 2000)
Median per capita income ($)
Median per capita income (% change since 2000)
Median family income ($) - White
Median family income ($) - Black or African American
Median family income ($) - Asian
Median family income ($) - Hispanic or Latino
Median family income ($) - American Indian and Alaska Native
Median family income ($) - Multirace
Median family income ($) - Other Race
Median year house/condo built
Median year apartment built
Year house built - Built 2005 or later (%)
Year house built - Built 2000 to 2004 (%)
Year house built - Built 1990 to 1999 (%)
Year house built - Built 1980 to 1989 (%)
Year house built - Built 1970 to 1979 (%)
Year house built - Built 1960 to 1969 (%)
Year house built - Built 1950 to 1959 (%)
Year house built - Built 1940 to 1949 (%)
Year house built - Built 1939 or earlier (%)
Average household size
Household density (households per square mile)
Average household size - White
Average household size - Black or African American
Average household size - Asian
Average household size - Hispanic or Latino
Average household size - American Indian and Alaska Native
Average household size - Multirace
Average household size - Other Race
Occupied housing units (%)
Vacant housing units (%)
Owner occupied housing units (%)
Renter occupied housing units (%)
Vacancy status - For rent (%)
Vacancy status - For sale only (%)
Vacancy status - Rented or sold, not occupied (%)
Vacancy status - For seasonal, recreational, or occasional use (%)
Vacancy status - For migrant workers (%)
Vacancy status - Other vacant (%)
Residents with income below the poverty level (%)
Residents with income below 50% of the poverty level (%)
Children below poverty level (%)
Poor families by family type - Married-couple family (%)
Poor families by family type - Male, no wife present (%)
Poor families by family type - Female, no husband present (%)
Poverty status for native-born residents (%)
Poverty status for foreign-born residents (%)
Poverty among high school graduates not in families (%)
Poverty among people who did not graduate high school not in families (%)
Residents with income below the poverty level (%) - White
Residents with income below the poverty level (%) - Black or African American
Residents with income below the poverty level (%) - Asian
Residents with income below the poverty level (%) - Hispanic or Latino
Residents with income below the poverty level (%) - American Indian and Alaska Native
Residents with income below the poverty level (%) - Multirace
Residents with income below the poverty level (%) - Other Race
Air pollution - Air Quality Index (AQI)
Air pollution - CO
Air pollution - NO2
Air pollution - SO2
Air pollution - Ozone
Air pollution - PM10
Air pollution - PM25
Air pollution - Pb
Crime - Murders per 100,000 population
Crime - Rapes per 100,000 population
Crime - Robberies per 100,000 population
Crime - Assaults per 100,000 population
Crime - Burglaries per 100,000 population
Crime - Thefts per 100,000 population
Crime - Auto thefts per 100,000 population
Crime - Arson per 100,000 population
Crime - City-data.com crime index
Crime - Violent crime index
Crime - Property crime index
Crime - Murders per 100,000 population (5 year average)
Crime - Rapes per 100,000 population (5 year average)
Crime - Robberies per 100,000 population (5 year average)
Crime - Assaults per 100,000 population (5 year average)
Crime - Burglaries per 100,000 population (5 year average)
Crime - Thefts per 100,000 population (5 year average)
Crime - Auto thefts per 100,000 population (5 year average)
Crime - Arson per 100,000 population (5 year average)
Crime - City-data.com crime index (5 year average)
Crime - Violent crime index (5 year average)
Crime - Property crime index (5 year average)
1996 Presidential Elections Results (%) - Democratic Party (Clinton)
1996 Presidential Elections Results (%) - Republican Party (Dole)
1996 Presidential Elections Results (%) - Other
2000 Presidential Elections Results (%) - Democratic Party (Gore)
2000 Presidential Elections Results (%) - Republican Party (Bush)
2000 Presidential Elections Results (%) - Other
2004 Presidential Elections Results (%) - Democratic Party (Kerry)
2004 Presidential Elections Results (%) - Republican Party (Bush)
2004 Presidential Elections Results (%) - Other
2008 Presidential Elections Results (%) - Democratic Party (Obama)
2008 Presidential Elections Results (%) - Republican Party (McCain)
2008 Presidential Elections Results (%) - Other
2012 Presidential Elections Results (%) - Democratic Party (Obama)
2012 Presidential Elections Results (%) - Republican Party (Romney)
2012 Presidential Elections Results (%) - Other
2016 Presidential Elections Results (%) - Democratic Party (Clinton)
2016 Presidential Elections Results (%) - Republican Party (Trump)
2016 Presidential Elections Results (%) - Other
2020 Presidential Elections Results (%) - Democratic Party (Biden)
2020 Presidential Elections Results (%) - Republican Party (Trump)
2020 Presidential Elections Results (%) - Other
Ancestries Reported - Arab (%)
Ancestries Reported - Czech (%)
Ancestries Reported - Danish (%)
Ancestries Reported - Dutch (%)
Ancestries Reported - English (%)
Ancestries Reported - French (%)
Ancestries Reported - French Canadian (%)
Ancestries Reported - German (%)
Ancestries Reported - Greek (%)
Ancestries Reported - Hungarian (%)
Ancestries Reported - Irish (%)
Ancestries Reported - Italian (%)
Ancestries Reported - Lithuanian (%)
Ancestries Reported - Norwegian (%)
Ancestries Reported - Polish (%)
Ancestries Reported - Portuguese (%)
Ancestries Reported - Russian (%)
Ancestries Reported - Scotch-Irish (%)
Ancestries Reported - Scottish (%)
Ancestries Reported - Slovak (%)
Ancestries Reported - Subsaharan African (%)
Ancestries Reported - Swedish (%)
Ancestries Reported - Swiss (%)
Ancestries Reported - Ukrainian (%)
Ancestries Reported - United States (%)
Ancestries Reported - Welsh (%)
Ancestries Reported - West Indian (%)
Ancestries Reported - Other (%)
Educational Attainment - No schooling completed (%)
Educational Attainment - Less than high school (%)
Educational Attainment - High school or equivalent (%)
Educational Attainment - Less than 1 year of college (%)
Educational Attainment - 1 or more years of college (%)
Educational Attainment - Associate degree (%)
Educational Attainment - Bachelor's degree (%)
Educational Attainment - Master's degree (%)
Educational Attainment - Professional school degree (%)
Educational Attainment - Doctorate degree (%)
School Enrollment - Nursery, preschool (%)
School Enrollment - Kindergarten (%)
School Enrollment - Grade 1 to 4 (%)
School Enrollment - Grade 5 to 8 (%)
School Enrollment - Grade 9 to 12 (%)
School Enrollment - College undergrad (%)
School Enrollment - Graduate or professional (%)
School Enrollment - Not enrolled in school (%)
School enrollment - Public schools (%)
School enrollment - Private schools (%)
School enrollment - Not enrolled (%)
Median number of rooms in houses and condos
Median number of rooms in apartments
Housing units lacking complete plumbing facilities (%)
Housing units lacking complete kitchen facilities (%)
Density of houses
Urban houses (%)
Rural houses (%)
Households with people 60 years and over (%)
Households with people 65 years and over (%)
Households with people 75 years and over (%)
Households with one or more nonrelatives (%)
Households with no nonrelatives (%)
Population in households (%)
Family households (%)
Nonfamily households (%)
Population in families (%)
Family households with own children (%)
Median number of bedrooms in owner occupied houses
Mean number of bedrooms in owner occupied houses
Median number of bedrooms in renter occupied houses
Mean number of bedrooms in renter occupied houses
Median number of vehichles in owner occupied houses
Mean number of vehichles in owner occupied houses
Median number of vehichles in renter occupied houses
Mean number of vehichles in renter occupied houses
Mortgage status - with mortgage (%)
Mortgage status - with second mortgage (%)
Mortgage status - with home equity loan (%)
Mortgage status - with both second mortgage and home equity loan (%)
Mortgage status - without a mortgage (%)
Average family size
Average family size - White
Average family size - Black or African American
Average family size - Asian
Average family size - Hispanic or Latino
Average family size - American Indian and Alaska Native
Average family size - Multirace
Average family size - Other Race
Geographical mobility - Same house 1 year ago (%)
Geographical mobility - Moved within same county (%)
Geographical mobility - Moved from different county within same state (%)
Geographical mobility - Moved from different state (%)
Geographical mobility - Moved from abroad (%)
Place of birth - Born in state of residence (%)
Place of birth - Born in other state (%)
Place of birth - Native, outside of US (%)
Place of birth - Foreign born (%)
Housing units in structures - 1, detached (%)
Housing units in structures - 1, attached (%)
Housing units in structures - 2 (%)
Housing units in structures - 3 or 4 (%)
Housing units in structures - 5 to 9 (%)
Housing units in structures - 10 to 19 (%)
Housing units in structures - 20 to 49 (%)
Housing units in structures - 50 or more (%)
Housing units in structures - Mobile home (%)
Housing units in structures - Boat, RV, van, etc. (%)
House/condo owner moved in on average (years ago)
Renter moved in on average (years ago)
Year householder moved into unit - Moved in 1999 to March 2000 (%)
Year householder moved into unit - Moved in 1995 to 1998 (%)
Year householder moved into unit - Moved in 1990 to 1994 (%)
Year householder moved into unit - Moved in 1980 to 1989 (%)
Year householder moved into unit - Moved in 1970 to 1979 (%)
Year householder moved into unit - Moved in 1969 or earlier (%)
Means of transportation to work - Drove car alone (%)
Means of transportation to work - Carpooled (%)
Means of transportation to work - Public transportation (%)
Means of transportation to work - Bus or trolley bus (%)
Means of transportation to work - Streetcar or trolley car (%)
Means of transportation to work - Subway or elevated (%)
Means of transportation to work - Railroad (%)
Means of transportation to work - Ferryboat (%)
Means of transportation to work - Taxicab (%)
Means of transportation to work - Motorcycle (%)
Means of transportation to work - Bicycle (%)
Means of transportation to work - Walked (%)
Means of transportation to work - Other means (%)
Working at home (%)
Industry diversity
Most Common Industries - Agriculture, forestry, fishing and hunting, and mining (%)
Most Common Industries - Agriculture, forestry, fishing and hunting (%)
Most Common Industries - Mining, quarrying, and oil and gas extraction (%)
Most Common Industries - Construction (%)
Most Common Industries - Manufacturing (%)
Most Common Industries - Wholesale trade (%)
Most Common Industries - Retail trade (%)
Most Common Industries - Transportation and warehousing, and utilities (%)
Most Common Industries - Transportation and warehousing (%)
Most Common Industries - Utilities (%)
Most Common Industries - Information (%)
Most Common Industries - Finance and insurance, and real estate and rental and leasing (%)
Most Common Industries - Finance and insurance (%)
Most Common Industries - Real estate and rental and leasing (%)
Most Common Industries - Professional, scientific, and management, and administrative and waste management services (%)
Most Common Industries - Professional, scientific, and technical services (%)
Most Common Industries - Management of companies and enterprises (%)
Most Common Industries - Administrative and support and waste management services (%)
Most Common Industries - Educational services, and health care and social assistance (%)
Most Common Industries - Educational services (%)
Most Common Industries - Health care and social assistance (%)
Most Common Industries - Arts, entertainment, and recreation, and accommodation and food services (%)
Most Common Industries - Arts, entertainment, and recreation (%)
Most Common Industries - Accommodation and food services (%)
Most Common Industries - Other services, except public administration (%)
Most Common Industries - Public administration (%)
Occupation diversity
Most Common Occupations - Management, business, science, and arts occupations (%)
Most Common Occupations - Management, business, and financial occupations (%)
Most Common Occupations - Management occupations (%)
Most Common Occupations - Business and financial operations occupations (%)
Most Common Occupations - Computer, engineering, and science occupations (%)
Most Common Occupations - Computer and mathematical occupations (%)
Most Common Occupations - Architecture and engineering occupations (%)
Most Common Occupations - Life, physical, and social science occupations (%)
Most Common Occupations - Education, legal, community service, arts, and media occupations (%)
Most Common Occupations - Community and social service occupations (%)
Most Common Occupations - Legal occupations (%)
Most Common Occupations - Education, training, and library occupations (%)
Most Common Occupations - Arts, design, entertainment, sports, and media occupations (%)
Most Common Occupations - Healthcare practitioners and technical occupations (%)
Most Common Occupations - Health diagnosing and treating practitioners and other technical occupations (%)
Most Common Occupations - Health technologists and technicians (%)
Most Common Occupations - Service occupations (%)
Most Common Occupations - Healthcare support occupations (%)
Most Common Occupations - Protective service occupations (%)
Most Common Occupations - Fire fighting and prevention, and other protective service workers including supervisors (%)
Most Common Occupations - Law enforcement workers including supervisors (%)
Most Common Occupations - Food preparation and serving related occupations (%)
Most Common Occupations - Building and grounds cleaning and maintenance occupations (%)
Most Common Occupations - Personal care and service occupations (%)
Most Common Occupations - Sales and office occupations (%)
Most Common Occupations - Sales and related occupations (%)
Most Common Occupations - Office and administrative support occupations (%)
Most Common Occupations - Natural resources, construction, and maintenance occupations (%)
Most Common Occupations - Farming, fishing, and forestry occupations (%)
Most Common Occupations - Construction and extraction occupations (%)
Most Common Occupations - Installation, maintenance, and repair occupations (%)
Most Common Occupations - Production, transportation, and material moving occupations (%)
Most Common Occupations - Production occupations (%)
Most Common Occupations - Transportation occupations (%)
Most Common Occupations - Material moving occupations (%)
People in Group quarters - Institutionalized population (%)
People in Group quarters - Correctional institutions (%)
People in Group quarters - Federal prisons and detention centers (%)
People in Group quarters - Halfway houses (%)
People in Group quarters - Local jails and other confinement facilities (including police lockups) (%)
People in Group quarters - Military disciplinary barracks (%)
People in Group quarters - State prisons (%)
People in Group quarters - Other types of correctional institutions (%)
People in Group quarters - Nursing homes (%)
People in Group quarters - Hospitals/wards, hospices, and schools for the handicapped (%)
People in Group quarters - Hospitals/wards and hospices for chronically ill (%)
People in Group quarters - Hospices or homes for chronically ill (%)
People in Group quarters - Military hospitals or wards for chronically ill (%)
People in Group quarters - Other hospitals or wards for chronically ill (%)
People in Group quarters - Hospitals or wards for drug/alcohol abuse (%)
People in Group quarters - Mental (Psychiatric) hospitals or wards (%)
People in Group quarters - Schools, hospitals, or wards for the mentally retarded (%)
People in Group quarters - Schools, hospitals, or wards for the physically handicapped (%)
People in Group quarters - Institutions for the deaf (%)
People in Group quarters - Institutions for the blind (%)
People in Group quarters - Orthopedic wards and institutions for the physically handicapped (%)
People in Group quarters - Wards in general hospitals for patients who have no usual home elsewhere (%)
People in Group quarters - Wards in military hospitals for patients who have no usual home elsewhere (%)
People in Group quarters - Juvenile institutions (%)
People in Group quarters - Long-term care (%)
People in Group quarters - Homes for abused, dependent, and neglected children (%)
People in Group quarters - Residential treatment centers for emotionally disturbed children (%)
People in Group quarters - Training schools for juvenile delinquents (%)
People in Group quarters - Short-term care, detention or diagnostic centers for delinquent children (%)
People in Group quarters - Type of juvenile institution unknown (%)
People in Group quarters - Noninstitutionalized population (%)
People in Group quarters - College dormitories (includes college quarters off campus) (%)
People in Group quarters - Military quarters (%)
People in Group quarters - On base (%)
People in Group quarters - Barracks, unaccompanied personnel housing (UPH), (Enlisted/Officer), ;and similar group living quarters for military personnel (%)
People in Group quarters - Transient quarters for temporary residents (%)
People in Group quarters - Military ships (%)
People in Group quarters - Group homes (%)
People in Group quarters - Homes or halfway houses for drug/alcohol abuse (%)
People in Group quarters - Homes for the mentally ill (%)
People in Group quarters - Homes for the mentally retarded (%)
People in Group quarters - Homes for the physically handicapped (%)
People in Group quarters - Other group homes (%)
People in Group quarters - Religious group quarters (%)
People in Group quarters - Dormitories (%)
People in Group quarters - Agriculture workers' dormitories on farms (%)
People in Group quarters - Job Corps and vocational training facilities (%)
People in Group quarters - Other workers' dormitories (%)
People in Group quarters - Crews of maritime vessels (%)
People in Group quarters - Other nonhousehold living situations (%)
People in Group quarters - Other noninstitutional group quarters (%)
Residents speaking English at home (%)
Residents speaking English at home - Born in the United States (%)
Residents speaking English at home - Native, born elsewhere (%)
Residents speaking English at home - Foreign born (%)
Residents speaking Spanish at home (%)
Residents speaking Spanish at home - Born in the United States (%)
Residents speaking Spanish at home - Native, born elsewhere (%)
Residents speaking Spanish at home - Foreign born (%)
Residents speaking other language at home (%)
Residents speaking other language at home - Born in the United States (%)
Residents speaking other language at home - Native, born elsewhere (%)
Residents speaking other language at home - Foreign born (%)
Class of Workers - Employee of private company (%)
Class of Workers - Self-employed in own incorporated business (%)
Class of Workers - Private not-for-profit wage and salary workers (%)
Class of Workers - Local government workers (%)
Class of Workers - State government workers (%)
Class of Workers - Federal government workers (%)
Class of Workers - Self-employed workers in own not incorporated business and Unpaid family workers (%)
House heating fuel used in houses and condos - Utility gas (%)
House heating fuel used in houses and condos - Bottled, tank, or LP gas (%)
House heating fuel used in houses and condos - Electricity (%)
House heating fuel used in houses and condos - Fuel oil, kerosene, etc. (%)
House heating fuel used in houses and condos - Coal or coke (%)
House heating fuel used in houses and condos - Wood (%)
House heating fuel used in houses and condos - Solar energy (%)
House heating fuel used in houses and condos - Other fuel (%)
House heating fuel used in houses and condos - No fuel used (%)
House heating fuel used in apartments - Utility gas (%)
House heating fuel used in apartments - Bottled, tank, or LP gas (%)
House heating fuel used in apartments - Electricity (%)
House heating fuel used in apartments - Fuel oil, kerosene, etc. (%)
House heating fuel used in apartments - Coal or coke (%)
House heating fuel used in apartments - Wood (%)
House heating fuel used in apartments - Solar energy (%)
House heating fuel used in apartments - Other fuel (%)
House heating fuel used in apartments - No fuel used (%)
Armed forces status - In Armed Forces (%)
Armed forces status - Civilian (%)
Armed forces status - Civilian - Veteran (%)
Armed forces status - Civilian - Nonveteran (%)
Fatal accidents locations in years 2005-2021
Fatal accidents locations in 2005
Fatal accidents locations in 2006
Fatal accidents locations in 2007
Fatal accidents locations in 2008
Fatal accidents locations in 2009
Fatal accidents locations in 2010
Fatal accidents locations in 2011
Fatal accidents locations in 2012
Fatal accidents locations in 2013
Fatal accidents locations in 2014
Fatal accidents locations in 2015
Fatal accidents locations in 2016
Fatal accidents locations in 2017
Fatal accidents locations in 2018
Fatal accidents locations in 2019
Fatal accidents locations in 2020
Fatal accidents locations in 2021
Alcohol use - People drinking some alcohol every month (%)
Alcohol use - People not drinking at all (%)
Alcohol use - Average days/month drinking alcohol
Alcohol use - Average drinks/week
Alcohol use - Average days/year people drink much
Audiometry - Average condition of hearing (%)
Audiometry - People that can hear a whisper from across a quiet room (%)
Audiometry - People that can hear normal voice from across a quiet room (%)
Audiometry - Ears ringing, roaring, buzzing (%)
Audiometry - Had a job exposure to loud noise (%)
Audiometry - Had off-work exposure to loud noise (%)
Blood Pressure & Cholesterol - Has high blood pressure (%)
Blood Pressure & Cholesterol - Checking blood pressure at home (%)
Blood Pressure & Cholesterol - Frequently checking blood cholesterol (%)
Blood Pressure & Cholesterol - Has high cholesterol level (%)
Consumer Behavior - Money monthly spent on food at supermarket/grocery store
Consumer Behavior - Money monthly spent on food at other stores
Consumer Behavior - Money monthly spent on eating out
Consumer Behavior - Money monthly spent on carryout/delivered foods
Consumer Behavior - Income spent on food at supermarket/grocery store (%)
Consumer Behavior - Income spent on food at other stores (%)
Consumer Behavior - Income spent on eating out (%)
Consumer Behavior - Income spent on carryout/delivered foods (%)
Current Health Status - General health condition (%)
Current Health Status - Blood donors (%)
Current Health Status - Has blood ever tested for HIV virus (%)
Current Health Status - Left-handed people (%)
Dermatology - People using sunscreen (%)
Diabetes - Diabetics (%)
Diabetes - Had a blood test for high blood sugar (%)
Diabetes - People taking insulin (%)
Diet Behavior & Nutrition - Diet health (%)
Diet Behavior & Nutrition - Milk product consumption (# of products/month)
Diet Behavior & Nutrition - Meals not home prepared (#/week)
Diet Behavior & Nutrition - Meals from fast food or pizza place (#/week)
Diet Behavior & Nutrition - Ready-to-eat foods (#/month)
Diet Behavior & Nutrition - Frozen meals/pizza (#/month)
Drug Use - People that ever used marijuana or hashish (%)
Drug Use - Ever used hard drugs (%)
Drug Use - Ever used any form of cocaine (%)
Drug Use - Ever used heroin (%)
Drug Use - Ever used methamphetamine (%)
Health Insurance - People covered by health insurance (%)
Kidney Conditions-Urology - Avg. # of times urinating at night
Medical Conditions - People with asthma (%)
Medical Conditions - People with anemia (%)
Medical Conditions - People with psoriasis (%)
Medical Conditions - People with overweight (%)
Medical Conditions - Elderly people having difficulties in thinking or remembering (%)
Medical Conditions - People who ever received blood transfusion (%)
Medical Conditions - People having trouble seeing even with glass/contacts (%)
Medical Conditions - People with arthritis (%)
Medical Conditions - People with gout (%)
Medical Conditions - People with congestive heart failure (%)
Medical Conditions - People with coronary heart disease (%)
Medical Conditions - People with angina pectoris (%)
Medical Conditions - People who ever had heart attack (%)
Medical Conditions - People who ever had stroke (%)
Medical Conditions - People with emphysema (%)
Medical Conditions - People with thyroid problem (%)
Medical Conditions - People with chronic bronchitis (%)
Medical Conditions - People with any liver condition (%)
Medical Conditions - People who ever had cancer or malignancy (%)
Mental Health - People who have little interest in doing things (%)
Mental Health - People feeling down, depressed, or hopeless (%)
Mental Health - People who have trouble sleeping or sleeping too much (%)
Mental Health - People feeling tired or having little energy (%)
Mental Health - People with poor appetite or overeating (%)
Mental Health - People feeling bad about themself (%)
Mental Health - People who have trouble concentrating on things (%)
Mental Health - People moving or speaking slowly or too fast (%)
Mental Health - People having thoughts they would be better off dead (%)
Oral Health - Average years since last visit a dentist
Oral Health - People embarrassed because of mouth (%)
Oral Health - People with gum disease (%)
Oral Health - General health of teeth and gums (%)
Oral Health - Average days a week using dental floss/device
Oral Health - Average days a week using mouthwash for dental problem
Oral Health - Average number of teeth
Pesticide Use - Households using pesticides to control insects (%)
Pesticide Use - Households using pesticides to kill weeds (%)
Physical Activity - People doing vigorous-intensity work activities (%)
Physical Activity - People doing moderate-intensity work activities (%)
Physical Activity - People walking or bicycling (%)
Physical Activity - People doing vigorous-intensity recreational activities (%)
Physical Activity - People doing moderate-intensity recreational activities (%)
Physical Activity - Average hours a day doing sedentary activities
Physical Activity - Average hours a day watching TV or videos
Physical Activity - Average hours a day using computer
Physical Functioning - People having limitations keeping them from working (%)
Physical Functioning - People limited in amount of work they can do (%)
Physical Functioning - People that need special equipment to walk (%)
Physical Functioning - People experiencing confusion/memory problems (%)
Physical Functioning - People requiring special healthcare equipment (%)
Prescription Medications - Average number of prescription medicines taking
Preventive Aspirin Use - Adults 40+ taking low-dose aspirin (%)
Reproductive Health - Vaginal deliveries (%)
Reproductive Health - Cesarean deliveries (%)
Reproductive Health - Deliveries resulted in a live birth (%)
Reproductive Health - Pregnancies resulted in a delivery (%)
Reproductive Health - Women breastfeeding newborns (%)
Reproductive Health - Women that had a hysterectomy (%)
Reproductive Health - Women that had both ovaries removed (%)
Reproductive Health - Women that have ever taken birth control pills (%)
Reproductive Health - Women taking birth control pills (%)
Reproductive Health - Women that have ever used Depo-Provera or injectables (%)
Reproductive Health - Women that have ever used female hormones (%)
Sexual Behavior - People 18+ that ever had sex (vaginal, anal, or oral) (%)
Sexual Behavior - Males 18+ that ever had vaginal sex with a woman (%)
Sexual Behavior - Males 18+ that ever performed oral sex on a woman (%)
Sexual Behavior - Males 18+ that ever had anal sex with a woman (%)
Sexual Behavior - Males 18+ that ever had any sex with a man (%)
Sexual Behavior - Females 18+ that ever had vaginal sex with a man (%)
Sexual Behavior - Females 18+ that ever performed oral sex on a man (%)
Sexual Behavior - Females 18+ that ever had anal sex with a man (%)
Sexual Behavior - Females 18+ that ever had any kind of sex with a woman (%)
Sexual Behavior - Average age people first had sex
Sexual Behavior - Average number of female sex partners in lifetime (males 18+)
Sexual Behavior - Average number of female vaginal sex partners in lifetime (males 18+)
Sexual Behavior - Average age people first performed oral sex on a woman (18+)
Sexual Behavior - Average number of woman performed oral sex on in lifetime (18+)
Sexual Behavior - Average number of male sex partners in lifetime (males 18+)
Sexual Behavior - Average number of male anal sex partners in lifetime (males 18+)
Sexual Behavior - Average age people first performed oral sex on a man (18+)
Sexual Behavior - Average number of male oral sex partners in lifetime (18+)
Sexual Behavior - People using protection when performing oral sex (%)
Sexual Behavior - Average number of times people have vaginal or anal sex a year
Sexual Behavior - People having sex without condom (%)
Sexual Behavior - Average number of male sex partners in lifetime (females 18+)
Sexual Behavior - Average number of male vaginal sex partners in lifetime (females 18+)
Sexual Behavior - Average number of female sex partners in lifetime (females 18+)
Sexual Behavior - Circumcised males 18+ (%)
Sleep Disorders - Average hours sleeping at night
Sleep Disorders - People that has trouble sleeping (%)
Smoking-Cigarette Use - People smoking cigarettes (%)
Taste & Smell - People 40+ having problems with smell (%)
Taste & Smell - People 40+ having problems with taste (%)
Taste & Smell - People 40+ that ever had wisdom teeth removed (%)
Taste & Smell - People 40+ that ever had tonsils teeth removed (%)
Taste & Smell - People 40+ that ever had a loss of consciousness because of a head injury (%)
Taste & Smell - People 40+ that ever had a broken nose or other serious injury to face or skull (%)
Taste & Smell - People 40+ that ever had two or more sinus infections (%)
Weight - Average height (inches)
Weight - Average weight (pounds)
Weight - Average BMI
Weight - People that are obese (%)
Weight - People that ever were obese (%)
Weight - People trying to lose weight (%)
100%
urban population.
Estimated median house/condo value in 2022: $470,764
10553:
$470,764New York:
$400,400
Median resident age: This zip code:
44.1 yearsNew York median age:
40.0 years
Average household size: This zip code:
2.7 peopleNew York:
2.5 people
Averages for the 2020 tax year for zip code 10553, filed in 2021:
Average Adjusted Gross Income (AGI) in 2020: $54,165 (Individual Income Tax Returns) Here:
$54,165State:
$90,930
Salary/wage: $52,806 (reported on 83.8% of returns )Here:
$52,806State:
$72,104
(% of AGI for various income ranges: 1027.7% for AGIs below $25k , 3788.6% for AGIs $25k-50k , 6966.6% for AGIs $50k-75k , 10523.8% for AGIs $75k-100k , 18339.8% for AGIs $100k-200k , 61992.5% for AGIs over 200k ) Taxable interest for individuals: $343 (reported on 20.9% of returns )This zip code:
$343New York:
$3,075
(% of AGI for various income ranges: 3.0% for AGIs below $25k , 5.8% for AGIs $25k-50k , 7.1% for AGIs $50k-75k , 17.8% for AGIs $75k-100k , 31.6% for AGIs $100k-200k , 127.5% for AGIs over 200k ) Ordinary dividends: $1,385 (reported on 8.6% of returns )(% of AGI for various income ranges: 2.7% for AGIs below $25k , 8.0% for AGIs $25k-50k , 7.8% for AGIs $50k-75k , 46.8% for AGIs $75k-100k , 46.0% for AGIs $100k-200k , 325.0% for AGIs over 200k ) Net capital gain/loss in AGI: +$8,833 (reported on 7.8% of returns )Here:
+$8,833State:
+$44,925
(% of AGI for various income ranges: 8.5% for AGIs $25k-50k , 7.3% for AGIs $50k-75k , 67.5% for AGIs $75k-100k , 121.4% for AGIs $100k-200k , 8242.5% for AGIs over 200k ) Profit/loss from business: +$4,943 (reported on 16.2% of returns )Here:
+$4,943State:
+$14,940
(% of AGI for various income ranges: 153.5% for AGIs below $25k , 55.6% for AGIs $25k-50k , 130.2% for AGIs $50k-75k , 126.8% for AGIs $75k-100k , 98.1% for AGIs $100k-200k ) Taxable individual retirement arrangement distribution: $13,467 (reported on 3.4% of returns )10553:
$13,467New York:
$19,609
(% of AGI for various income ranges: 16.5% for AGIs below $25k , 21.5% for AGIs $25k-50k , 33.5% for AGIs $50k-75k , 100.8% for AGIs $75k-100k , 373.7% for AGIs $100k-200k ) Total itemized deductions: $26,519 (reported on 13.6% of returns )Here:
$26,519State:
$39,326
(% of AGI for various income ranges: 59.9% for AGIs below $25k , 142.6% for AGIs $25k-50k , 501.8% for AGIs $50k-75k , 981.2% for AGIs $75k-100k , 2076.0% for AGIs $100k-200k , 5987.5% for AGIs over 200k ) Charity contributions: $7,291 (reported on 11.0% of returns )(% of AGI for various income ranges: 4.9% for AGIs below $25k , 25.3% for AGIs $25k-50k , 89.5% for AGIs $50k-75k , 226.5% for AGIs $75k-100k , 507.7% for AGIs $100k-200k , 1745.0% for AGIs over 200k ) Taxes paid: $9,320 (reported on 13.5% of returns )(% of AGI for various income ranges: 22.2% for AGIs below $25k , 50.8% for AGIs $25k-50k , 181.6% for AGIs $50k-75k , 354.0% for AGIs $75k-100k , 718.1% for AGIs $100k-200k , 1732.5% for AGIs over 200k ) Earned income credit: $2,099 (reported on 17.4% of returns )(% of AGI for various income ranges: 104.3% for AGIs below $25k , 54.5% for AGIs $25k-50k ) Percentage of individuals using paid preparers for their 2020 taxes: 94.3%(% for various income ranges: 92.6% for AGIs below $25k , 96.1% for AGIs $25k-50k , 95.3% for AGIs $50k-75k , 93.1% for AGIs $75k-100k , 94.4% for AGIs $100k-200k , 91.7% for AGIs over 200k )
Averages for the 2012 tax year for zip code 10553, filed in 2013:
Average Adjusted Gross Income (AGI) in 2012: $46,500 (Individual Income Tax Returns) Here:
$46,500State:
$77,088
Salary/wage: $45,833 (reported on 85.9% of returns )Here:
$45,833State:
$60,593
(% of AGI for various income ranges: 73.5% for AGIs below $25k , 88.7% for AGIs $25k-50k , 87.1% for AGIs $50k-75k , 85.7% for AGIs $75k-100k , 83.1% for AGIs $100k-200k , 85.8% for AGIs over 200k ) Taxable interest for individuals: $348 (reported on 21.9% of returns )This zip code:
$348New York:
$3,125
(% of AGI for various income ranges: 0.2% for AGIs below $25k , 0.1% for AGIs $25k-50k , 0.2% for AGIs $50k-75k , 0.2% for AGIs $75k-100k , 0.2% for AGIs $100k-200k , 0.1% for AGIs over 200k ) Ordinary dividends: $1,324 (reported on 9.1% of returns )(% of AGI for various income ranges: 0.4% for AGIs below $25k , 0.1% for AGIs $25k-50k , 0.3% for AGIs $50k-75k , 0.2% for AGIs $75k-100k , 0.3% for AGIs $100k-200k , 0.1% for AGIs over 200k ) Profit/loss from business: +$6,197 (reported on 14.2% of returns )Here:
+$6,197State:
+$16,168
(% of AGI for various income ranges: 12.5% for AGIs below $25k , 1.5% for AGIs $25k-50k , 0.4% for AGIs $50k-75k , 0.8% for AGIs $75k-100k , 0.4% for AGIs $100k-200k ) Taxable individual retirement arrangement distribution: $11,121 (reported on 4.4% of returns )10553:
$11,121New York:
$17,621
(% of AGI for various income ranges: 0.9% for AGIs below $25k , 0.8% for AGIs $25k-50k , 0.8% for AGIs $50k-75k , 0.8% for AGIs $75k-100k , 2.0% for AGIs $100k-200k ) Total itemized deductions: $24,179 (30% of AGI, reported on 37.4% of returns )Here:
$24,179State:
$34,985
Here:
30.1% of AGIState:
21.3% of AGI
(% of AGI for various income ranges: 11.3% for AGIs below $25k , 12.6% for AGIs $25k-50k , 21.6% for AGIs $50k-75k , 23.4% for AGIs $75k-100k , 23.9% for AGIs $100k-200k , 21.0% for AGIs over 200k ) Charity contributions: $4,363 (reported on 32.3% of returns )(% of AGI for various income ranges: 1.2% for AGIs below $25k , 1.9% for AGIs $25k-50k , 3.6% for AGIs $50k-75k , 3.9% for AGIs $75k-100k , 3.7% for AGIs $100k-200k , 3.2% for AGIs over 200k ) Taxes paid: $9,890 (reported on 37.2% of returns )10553:
$9,890State:
$18,656
(% of AGI for various income ranges: 3.9% for AGIs below $25k , 4.4% for AGIs $25k-50k , 7.9% for AGIs $50k-75k , 9.5% for AGIs $75k-100k , 10.7% for AGIs $100k-200k , 10.5% for AGIs over 200k ) Earned income credit: $2,154 (reported on 24.1% of returns )(% of AGI for various income ranges: 8.7% for AGIs below $25k , 1.1% for AGIs $25k-50k ) Percentage of individuals using paid preparers for their 2012 taxes: 70.8%(% for various income ranges: 68.5% for AGIs below $25k , 69.8% for AGIs $25k-50k , 72.0% for AGIs $50k-75k , 76.6% for AGIs $75k-100k , 75.5% for AGIs $100k-200k , 75.0% for AGIs over 200k )
Averages for the 2004 tax year for zip code 10553, filed in 2005:
Average Adjusted Gross Income (AGI) in 2004: $44,642 (Individual Income Tax Returns) Here:
$44,642State:
$59,519
Salary/wage: $40,480 (reported on 88.6% of returns )Here:
$40,480State:
$50,673
(% of AGI for various income ranges: 87.5% for AGIs below $10k , 84.7% for AGIs $10k-25k , 93.2% for AGIs $25k-50k , 91.5% for AGIs $50k-75k , 89.3% for AGIs $75k-100k , 56.1% for AGIs over 100k ) Taxable interest for individuals: $403 (reported on 35.1% of returns )This zip code:
$403New York:
$2,377
(% of AGI for various income ranges: 1.1% for AGIs below $10k , 0.4% for AGIs $10k-25k , 0.3% for AGIs $25k-50k , 0.2% for AGIs $50k-75k , 0.3% for AGIs $75k-100k , 0.3% for AGIs over 100k ) Taxable dividends: $1,162 (reported on 13.2% of returns )(% of AGI for various income ranges: 1.0% for AGIs below $10k , 0.3% for AGIs $10k-25k , 0.3% for AGIs $25k-50k , 0.2% for AGIs $50k-75k , 0.4% for AGIs $75k-100k , 0.5% for AGIs over 100k ) Net capital gain/loss: +$2,289 (reported on 7.8% of returns )Here:
+$2,289State:
+$23,581
(% of AGI for various income ranges: -0.4% for AGIs below $10k , -0.1% for AGIs $10k-25k , 0.0% for AGIs $25k-50k , -0.1% for AGIs $50k-75k , 0.4% for AGIs $75k-100k , 1.2% for AGIs over 100k ) Profit/loss from business: +$4,538 (reported on 12.0% of returns )Here:
+$4,538State:
+$13,809
(% of AGI for various income ranges: 15.1% for AGIs below $10k , 5.7% for AGIs $10k-25k , 0.7% for AGIs $25k-50k , 0.9% for AGIs $50k-75k , 0.0% for AGIs $75k-100k , 0.3% for AGIs over 100k ) IRA payment deduction: $2,175 (reported on 1.2% of returns )10553:
$2,175New York:
$3,115
Total itemized deductions: $21,950 (30% of AGI, reported on 43.2% of returns )Here:
$21,950State:
$25,864
Here:
29.7% of AGIState:
21.9% of AGI
(% of AGI for various income ranges: 12.5% for AGIs below $10k , 13.7% for AGIs $10k-25k , 20.2% for AGIs $25k-50k , 28.9% for AGIs $50k-75k , 26.1% for AGIs $75k-100k , 17.7% for AGIs over 100k ) Charity contributions deductions: $4,338 (6% of AGI, reported on 40.9% of returns )Here:
5.7% of AGIState:
3.6% of AGI
(% of AGI for various income ranges: 1.2% for AGIs below $10k , 2.2% for AGIs $10k-25k , 4.0% for AGIs $25k-50k , 5.4% for AGIs $50k-75k , 4.8% for AGIs $75k-100k , 3.4% for AGIs over 100k ) Total tax: $4,950 (reported on 70.3% of returns )10553:
$4,950State:
$11,730
(% of AGI for various income ranges: 3.1% for AGIs below $10k , 3.1% for AGIs $10k-25k , 5.5% for AGIs $25k-50k , 8.5% for AGIs $50k-75k , 10.4% for AGIs $75k-100k , 9.9% for AGIs over 100k ) Earned income credit: $1,759 (reported on 21.2% of returns )Percentage of individuals using paid preparers for their 2004 taxes: 72.1%(% for various income ranges: 63.6% for AGIs below $10k , 74.1% for AGIs $10k-25k , 74.5% for AGIs $25k-50k , 73.0% for AGIs $50k-75k , 70.5% for AGIs $75k-100k , 76.6% for AGIs over 100k )
Estimated median household income in 2022: This zip code:
$86,963New York:
$79,557
Nearest zip codes: 10550 ,
10552 ,
10803 ,
10466 ,
10708 ,
10475 .
Mount Vernon Zip Code Map
Percentage of family households: This zip code:
46.8%New York:
41.3%
Percentage of households with unmarried partners: This zip code:
6.1%New York:
42.3%
Likely homosexual households (counted as self-reported same-sex unmarried-partner households)
Lesbian couples: 0.7% of all households Gay men: 0.0% of all households
Household received Food Stamps/SNAP in the past 12 months: 495Household did not receive Food Stamps/SNAP in the past 12 months: 3,228
Women who had a birth in the past 12 months: 214 (87 now married , 130 unmarried) Women who did not have a birth in the past 12 months: 2,747 (600 now married , 2,165 unmarried)
Housing units in zip code 10553 with a mortgage: 1,213 (167
second mortgage , 24
home equity loan , 115
both second mortgage and home equity loan )
Houses without a mortgage: 87
Median monthly owner costs for units with a mortgage: $3,316
Median monthly owner costs for units without a mortgage: $1,487
Residents with income below the poverty level in 2022:
This zip code:
7.5%Whole state:
14.3%
Residents with income below 50% of the poverty level in 2022:
This zip code:
2.6%Whole state:
6.8%
Median number of rooms in houses and condos: Median number of rooms in apartments:
Year house built (houses)
0 2020 or later0 2010 to 201973 2000 to 200956 1990 to 1999157 1980 to 1989311 1970 to 1979281 1960 to 1969529 1950 to 1959597 1940 to 19491,752 1939 or earlier
Zip code 10553 household income distribution in 2022 199 Less than $10,00095 $10,000 to $14,999104 $15,000 to $19,99970 $20,000 to $24,999269 $25,000 to $29,99945 $30,000 to $34,99929 $35,000 to $39,99957 $40,000 to $44,99977 $45,000 to $49,99945 $50,000 to $59,999501 $60,000 to $74,999600 $75,000 to $99,999360 $100,000 to $124,999196 $125,000 to $149,999489 $150,000 to $199,999582 $200,000 or moreEstimate of home value of owner-occupied houses/condos in 2022 in zip code 10553 55 Less than $10,00013 $20,000 to $24,99923 $90,000 to $99,99926 $125,000 to $149,99918 $175,000 to $199,99937 $200,000 to $249,999101 $250,000 to $299,999434 $300,000 to $399,999439 $400,000 to $499,999769 $500,000 to $749,9991 $750,000 to $999,999Rent paid by renters in 2022 in zip code 10553 11 $200 to $24928 $250 to $29931 $300 to $34952 $450 to $49943 $600 to $64937 $750 to $79946 $800 to $89980 $900 to $999143 $1,000 to $1,249476 $1,250 to $1,499454 $1,500 to $1,999189 $2,000 to $2,49957 $2,500 to $2,99932 $3,000 to $3,499140 No cash rent
Median gross rent in 2022: $1,626.
Median price asked for vacant for-sale houses and condos in 2022: $289,059.
Estimated median house (or condo) value in 2022 for: White Non-Hispanic householders: $384,860Black or African American householders: $430,528Asian householders: $226,329Some other race householders: $507,178Two or more races householders: $387,274Hispanic or Latino householders: $444,208Estimated median house or condo value in 2022: $470,764
10553:
$470,764New York:
$400,400
Lower value quartile - upper value quartile: $368,009 - $596,738
Mean price in 2022: Detached houses: $546,928Here:
$546,928State:
$476,719
Townhouses or other attached units: $357,320Here:
$357,320State:
$699,270
In 2-unit structures: $1,069,764Here:
$1,069,764State:
$713,077
In 3-to-4-unit structures: $2,628,683Here:
$2,628,683State:
$764,568
In 5-or-more-unit structures: $184,601Here:
$184,601State:
$912,009
Housing units in structures:
One, detached: 1,592One, attached: 529Two: 4873 or 4: 3405 to 9: 12010 to 19: 15220 to 49: 44950 or more: 133Mobile homes: 17Unemployment : 3.8%
Means of transportation to work in zip code 10553 50.4% 2,770 Drove a car alone12.4% 683 Carpooled12.6% 693 Bus or trolley bus6.4% 352 Streetcar or trolley car1.8% 100 Subway or elevated0.1% 7 Railroad1.4% 79 Taxi0.4% 23 Bicycle7.7% 424 Walked1.7% 93 Other means3.7% 204 Worked at homeTravel time to work (commute) in zip code 10553 54 Less than 5 minutes513 5 to 9 minutes531 10 to 14 minutes632 15 to 19 minutes514 20 to 24 minutes33 25 to 29 minutes759 30 to 34 minutes160 35 to 39 minutes378 40 to 44 minutes587 45 to 59 minutes597 60 to 89 minutes398 90 or more minutes
Percentage of zip code residents living and working in this county: 66.5%
Household type by relationship:
Households: 10,358
Male householders: 1,274 (362 living alone ), Female householders: 2,474 (583 living alone )1,263 spouses (1,227 opposite-sex spouses ), 312 unmarried partners , (266 opposite-sex unmarried partners ), 3,225 children (3,023 natural , 80 adopted , 118 stepchildren ), 339 grandchildren , 552 brothers or sisters , 194 parents , 0 foster children , 475 other relatives , 72 non-relatives In group quarters: 119 (-1 institutionalized population )
Size of family households: 845 2-persons , 789 3-persons , 474 4-persons , 331 5-persons , 119 6-persons , 23 7-or-more-persons
Size of nonfamily households: 944 1-person , 141 2-persons , 32 3-persons
793 married couples with children. single-parent households (157 men , 463 women ).
73.6% of residents of 10553 zip code speak English at home. of residents speak Spanish at home (59% very well, 16% well, 20% not well, 4% not at all ).of residents speak other Indo-European language at home (82% very well, 18% well ).of residents speak Asian or Pacific Island language at home (100% well ).of residents speak other language at home (82% very well, 11% well, 7% not well ).
Foreign born population: 3,937 (38.0%)
(63.5%
of them are naturalized citizens )
This zip code:
38.0%Whole state:
22.7%
52% Haiti 10% Italy 7% St. Vincent and the Grenadines 2% Cabo Verde 2% Grenada 2% Bahamas 2% Dominica 28% Jamaican 8% Portuguese 8% West Indian 4% Trinidadian and Tobagonian 4% American 4% African 1% Barbadian
Year of entry for the foreign-born population
873 2010 or later 544 2000 to 2009 951 1990 to 1999 1,856 Before 1990
There are
53 Medical Specialists in Zip Code 10553 .
Facilities with environmental interests located in this zip code:
GRAHAM SCHOOL ( in MOUNT VERNON, NY)
(Geographic Names Information System) (National Center for Education Statistics) - STATE ID-660900010010 Organizations: MT VERNON CITY SD (SCHOOL DISTRICT)
HOLMES SCHOOL ( in MOUNT VERNON, NY)
(Geographic Names Information System) (National Center for Education Statistics) - STATE ID-660900010005 Organizations: MT VERNON CITY SD (SCHOOL DISTRICT)
ALCOR PETROLEUM CORP (135 E 3RD ST in MT VERNON, NY)
(Resource Conservation and Recovery Act (tracking hazardous waste)) Alternative names: C S G OF MOUNT VERNON INC
APF GROUP INC (320 WASHINGTON ST in MOUNT VERNON, NY)
HAZARDOUS WASTE BIENNIAL REPORTER (Resource Conservation and Recovery Act (tracking hazardous waste)) Large Quantity Generators, more that 1000 kg of hazardous waste/month (Resource Conservation and Recovery Act (tracking hazardous waste)) Business NAICS classification: CUSTOM ARCHITECTURAL WOODWORK AND MILLWORK MANUFACTURING.Alternative names: A P F INTERIORS
CON ED - MH 3993 (256 WASHINGTON AVE in MT VERNON, NY)
HAZARDOUS WASTE BIENNIAL REPORTER (Resource Conservation and Recovery Act (tracking hazardous waste)) (Resource Conservation and Recovery Act (tracking hazardous waste))
CON ED - WASHINGTON ST S/S (WASHINGTON ST S/S STATION L&P in MT VERNON, NY)
HAZARDOUS WASTE BIENNIAL REPORTER (Resource Conservation and Recovery Act (tracking hazardous waste)) (Resource Conservation and Recovery Act (tracking hazardous waste))
HALLS CLEANERS (332 S COLUMBUS AVE in MOUNT VERNON, NY)
(Resource Conservation and Recovery Act (tracking hazardous waste))
CONTEMPORARY MOTORS (5-7 TECUMSEH AVE in MT VERNON, NY)
(Resource Conservation and Recovery Act (tracking hazardous waste))
CON ED - MOUNT VERNON SUBSTATION (288 WASHINGTON ST in MOUNT VERNON, NY)
(Resource Conservation and Recovery Act (tracking hazardous waste))
ARC AUTO BODY SUPPLIES (504 E 3RD ST in MOUNT VERNON, NY)
Conditionally Exempt Small Quantity Generators, less than 100 kg/month of hazardous waste (Resource Conservation and Recovery Act (tracking hazardous waste)) - notification
GERITREX, INC. (539 EAST THIRD ST. in MOUNT VERNON, NY)
ENFORCEMENT/COMPLIANCE ACTIVITY (Integrated Compliance Information System) COMPLIANCE ACTIVITY (Tracking inspections of insecticide, fungicide, and rodenticide, and toxic substances)
HEALER PRODUCTS (120 HARTFORD AVE in MOUNT VERNON, NY)
Conditionally Exempt Small Quantity Generators, less than 100 kg/month of hazardous waste (Resource Conservation and Recovery Act (tracking hazardous waste)) - notification Organizations: ZELCO INDUSSTRIES INC (CONTACT/OWNER)
INTERIORS (320 WASDHINGTON ST in MOUNT VERNON, NY)
COMPLIANCE ACTIVITY (Tracking inspections of insecticide, fungicide, and rodenticide, and toxic substances) Business SIC classification: WOOD PRODUCTS
Housing units lacking complete kitchen facilities: 1.5%
43.3% Utility gas 32.2% Fuel oil, kerosene, etc. 20.3% Electricity 2.4% No fuel used 1.1% Other fuel 0.8% Bottled, tank, or LP gas
Population in 1990: 12,452.
Place of birth for U.S.-born residents:
This state: 5,400Northeast: 234Midwest: 59South: 366
66% of the 10553 zip code residents lived in the same house 5 years ago.
Out of people who lived in different houses, 69% lived in this county.
Out of people who lived in different counties, 50% lived in New York.
90% of the 10553 zip code residents lived in the same house 1 year ago.
Out of people who lived in different houses, 54% moved from this county.
Out of people who lived in different houses, 29% moved from different county within same state.
Out of people who lived in different houses, 7% moved from different state.
Out of people who lived in different houses, 10% moved from abroad.
Private vs. public school enrollment:
Students in private schools in grades 1 to 8 (elementary and middle school): 206
Students in private schools in grades 9 to 12 (high school): 105
Students in private undergraduate colleges: 255
Occupation by median earnings in the past 12 months ($)
133,554 Architecture and engineering occupations 108,706 Health diagnosing and treating practitioners and other technical occupations 107,902 Legal occupations 105,011 Management occupations 71,757 Computer and mathematical occupations 66,964 Business and financial operations occupations
Companies with federal contracts located in this zip code:
TRI-TECHNOLOGIES, INC (40 HARTFORD AVE in MOUNT VERNON, NY; small business) in 316 contracts from 1999 to 2006
Contracts for Bars and Rods, Nonferrous Base Metal, Guns, through 30 mm, Ammunition, over 125 mm, Guns, 75 mm through 125 mm, and more by Army, Defense Logistics Agency, NavySigned by year: 2000: $669,754; 2001: $1,522,370; 2002: $3,630,278; 2003: $2,316,209; 2004: $5,081,218; 2005: $9,311,556; 2006: $3,013,667.
Biggest contracts: with Army for Bars and Rods, Nonferrous Base Metal. Signed on 2002-09-27. Completion date: 2007-09-24.
with Army for Guns, through 30 mm. Signed on 2005-08-29. Completion date: 2007-08-30.
, same as above. Signed on 2006-05-31. Completion date: 2007-11-30.
with Army for Bars and Rods, Nonferrous Base Metal. Signed on 2002-09-24. Completion date: 2007-09-24.
Top industries in this zip code by the number of employees in 2005:
Construction: Site Preparation Contractors (500-999 employees: 1 establishment, 1-4 employees: 2 establishments)Administrative and Support and Waste Management and Remediation Services: Other Waste Collection (50-99: 1)
People in group quarters in 2010:
10 people in group homes intended for adults
People in group quarters in 2000:
21 people in other nonhousehold living situations
10 people in other group homes
Home Mortgage Disclosure Act Aggregated Statistics For Year 2009(Based on 2 full and 6 partial tracts) A) FHA, FSA/RHS & VA B) Conventional C) Refinancings D) Home Improvement Loans E) Loans on Dwellings For 5+ Families F) Non-occupant Loans on G) Loans On Manufactured Number Average Value Number Average Value Number Average Value Number Average Value Number Average Value Number Average Value Number Average Value
LOANS ORIGINATED 54 $332,830 26 $178,813 87 $292,297 4 $190,550 1 $951,300 4 $203,735 0 $0 APPLICATIONS APPROVED, NOT ACCEPTED 5 $315,416 2 $210,210 24 $267,826 5 $35,726 0 $0 0 $0 1 $145,560 APPLICATIONS DENIED 25 $339,297 24 $227,838 146 $322,274 31 $58,569 0 $0 9 $220,112 0 $0 APPLICATIONS WITHDRAWN 24 $315,600 10 $253,685 42 $310,975 0 $0 0 $0 1 $147,980 0 $0 FILES CLOSED FOR INCOMPLETENESS 6 $423,812 4 $216,770 17 $345,120 2 $179,340 0 $0 0 $0 0 $0
Aggregated Statistics For Year 2008(Based on 2 full and 6 partial tracts) A) FHA, FSA/RHS & VA B) Conventional C) Refinancings D) Home Improvement Loans E) Loans on Dwellings For 5+ Families F) Non-occupant Loans on Number Average Value Number Average Value Number Average Value Number Average Value Number Average Value Number Average Value
LOANS ORIGINATED 12 $303,987 56 $265,049 112 $311,161 28 $69,050 2 $1,399,615 12 $316,726 APPLICATIONS APPROVED, NOT ACCEPTED 6 $379,232 18 $254,266 41 $275,265 13 $96,962 0 $0 4 $216,645 APPLICATIONS DENIED 11 $328,770 41 $331,701 218 $365,983 57 $102,424 0 $0 18 $314,646 APPLICATIONS WITHDRAWN 1 $286,900 14 $339,281 64 $350,657 10 $111,701 1 $212,610 5 $281,704 FILES CLOSED FOR INCOMPLETENESS 1 $300,790 6 $355,865 22 $366,512 1 $349,530 0 $0 3 $283,440
Aggregated Statistics For Year 2007(Based on 2 full and 6 partial tracts) A) FHA, FSA/RHS & VA B) Conventional C) Refinancings D) Home Improvement Loans E) Loans on Dwellings For 5+ Families F) Non-occupant Loans on G) Loans On Manufactured Number Average Value Number Average Value Number Average Value Number Average Value Number Average Value Number Average Value Number Average Value
LOANS ORIGINATED 3 $358,423 178 $285,176 270 $329,542 51 $126,449 2 $554,010 24 $351,071 1 $26,580 APPLICATIONS APPROVED, NOT ACCEPTED 0 $0 48 $312,910 90 $322,079 29 $191,877 0 $0 9 $309,027 0 $0 APPLICATIONS DENIED 0 $0 198 $327,123 404 $352,704 88 $75,506 1 $2,950 30 $369,587 0 $0 APPLICATIONS WITHDRAWN 0 $0 47 $333,225 129 $363,315 14 $300,081 0 $0 12 $376,046 0 $0 FILES CLOSED FOR INCOMPLETENESS 0 $0 21 $222,815 61 $325,122 4 $331,902 2 $896,700 5 $295,946 0 $0
Aggregated Statistics For Year 2006(Based on 2 full and 6 partial tracts) A) FHA, FSA/RHS & VA B) Conventional C) Refinancings D) Home Improvement Loans E) Loans on Dwellings For 5+ Families F) Non-occupant Loans on Number Average Value Number Average Value Number Average Value Number Average Value Number Average Value Number Average Value
LOANS ORIGINATED 2 $290,530 336 $265,115 488 $324,571 76 $130,078 6 $668,012 27 $363,137 APPLICATIONS APPROVED, NOT ACCEPTED 0 $0 52 $297,808 143 $290,137 8 $198,916 0 $0 10 $400,085 APPLICATIONS DENIED 2 $387,890 226 $302,979 444 $323,909 94 $149,007 0 $0 33 $345,346 APPLICATIONS WITHDRAWN 0 $0 77 $288,819 278 $314,056 8 $201,218 3 $125,233 9 $334,280 FILES CLOSED FOR INCOMPLETENESS 0 $0 19 $248,910 79 $350,421 6 $149,385 1 $328,580 0 $0
Aggregated Statistics For Year 2005(Based on 2 full and 6 partial tracts) A) FHA, FSA/RHS & VA B) Conventional C) Refinancings D) Home Improvement Loans E) Loans on Dwellings For 5+ Families F) Non-occupant Loans on G) Loans On Manufactured Number Average Value Number Average Value Number Average Value Number Average Value Number Average Value Number Average Value Number Average Value
LOANS ORIGINATED 2 $260,045 300 $268,561 527 $288,940 62 $120,219 7 $1,004,003 37 $276,489 0 $0 APPLICATIONS APPROVED, NOT ACCEPTED 2 $286,895 44 $261,341 101 $290,607 12 $95,032 0 $0 4 $274,242 0 $0 APPLICATIONS DENIED 1 $146,170 156 $281,909 379 $301,986 94 $116,580 0 $0 21 $233,205 2 $128,610 APPLICATIONS WITHDRAWN 2 $338,055 113 $303,386 377 $284,152 27 $179,744 0 $0 21 $325,994 0 $0 FILES CLOSED FOR INCOMPLETENESS 0 $0 26 $236,482 87 $315,074 4 $126,465 0 $0 7 $251,753 0 $0
Aggregated Statistics For Year 2004(Based on 2 full and 6 partial tracts) A) FHA, FSA/RHS & VA B) Conventional C) Refinancings D) Home Improvement Loans E) Loans on Dwellings For 5+ Families F) Non-occupant Loans on G) Loans On Manufactured Number Average Value Number Average Value Number Average Value Number Average Value Number Average Value Number Average Value Number Average Value
LOANS ORIGINATED 2 $369,010 298 $244,167 496 $263,521 63 $142,518 4 $1,160,962 53 $284,581 2 $474,865 APPLICATIONS APPROVED, NOT ACCEPTED 1 $155,830 68 $236,234 139 $237,583 16 $43,376 0 $0 9 $349,367 0 $0 APPLICATIONS DENIED 3 $203,957 100 $268,541 362 $258,342 115 $112,117 1 $78,770 25 $216,998 2 $44,520 APPLICATIONS WITHDRAWN 6 $356,153 77 $252,639 359 $253,542 32 $127,255 4 $626,635 12 $257,471 2 $237,430 FILES CLOSED FOR INCOMPLETENESS 1 $216,230 11 $168,370 80 $246,096 0 $0 0 $0 7 $220,416 0 $0
Aggregated Statistics For Year 2003(Based on 2 full and 6 partial tracts) A) FHA, FSA/RHS & VA B) Conventional C) Refinancings D) Home Improvement Loans E) Loans on Dwellings For 5+ Families F) Non-occupant Loans on Number Average Value Number Average Value Number Average Value Number Average Value Number Average Value Number Average Value
LOANS ORIGINATED 19 $237,408 185 $218,090 621 $221,422 26 $41,867 7 $2,099,283 47 $217,631 APPLICATIONS APPROVED, NOT ACCEPTED 0 $0 39 $233,704 138 $238,267 10 $14,717 0 $0 11 $256,295 APPLICATIONS DENIED 3 $278,823 90 $230,348 459 $232,590 48 $42,347 0 $0 19 $198,940 APPLICATIONS WITHDRAWN 6 $287,633 38 $250,541 284 $227,388 15 $38,579 0 $0 5 $235,376 FILES CLOSED FOR INCOMPLETENESS 0 $0 16 $183,455 31 $202,480 7 $102,383 0 $0 8 $223,085
Aggregated Statistics For Year 2002(Based on 2 full and 6 partial tracts) A) FHA, FSA/RHS & VA B) Conventional C) Refinancings D) Home Improvement Loans E) Loans on Dwellings For 5+ Families F) Non-occupant Loans on Number Average Value Number Average Value Number Average Value Number Average Value Number Average Value Number Average Value
LOANS ORIGINATED 19 $276,212 118 $186,155 334 $200,639 33 $36,526 2 $807,030 23 $176,047 APPLICATIONS APPROVED, NOT ACCEPTED 5 $253,858 31 $139,313 86 $196,623 12 $31,152 0 $0 7 $201,940 APPLICATIONS DENIED 3 $232,350 48 $194,092 305 $185,916 71 $43,610 0 $0 13 $158,378 APPLICATIONS WITHDRAWN 6 $232,170 20 $232,939 213 $209,494 25 $34,999 0 $0 8 $193,118 FILES CLOSED FOR INCOMPLETENESS 1 $199,920 6 $77,062 72 $196,076 1 $84,560 0 $0 1 $155,230
Aggregated Statistics For Year 2001(Based on 2 full and 6 partial tracts) A) FHA, FSA/RHS & VA B) Conventional C) Refinancings D) Home Improvement Loans E) Loans on Dwellings For 5+ Families F) Non-occupant Loans on Number Average Value Number Average Value Number Average Value Number Average Value Number Average Value Number Average Value
LOANS ORIGINATED 28 $224,897 176 $190,837 246 $172,024 34 $43,524 2 $755,300 15 $176,767 APPLICATIONS APPROVED, NOT ACCEPTED 7 $284,760 27 $189,607 100 $143,543 12 $33,504 0 $0 4 $80,628 APPLICATIONS DENIED 13 $222,688 68 $192,430 317 $155,170 92 $25,183 0 $0 27 $146,830 APPLICATIONS WITHDRAWN 4 $239,728 26 $175,387 236 $169,109 41 $38,924 0 $0 4 $189,092 FILES CLOSED FOR INCOMPLETENESS 2 $280,895 9 $206,430 47 $187,149 7 $31,747 0 $0 2 $245,345
Aggregated Statistics For Year 2000(Based on 2 full and 6 partial tracts) A) FHA, FSA/RHS & VA B) Conventional C) Refinancings D) Home Improvement Loans E) Loans on Dwellings For 5+ Families F) Non-occupant Loans on Number Average Value Number Average Value Number Average Value Number Average Value Number Average Value Number Average Value
LOANS ORIGINATED 31 $233,687 155 $170,343 136 $148,351 29 $21,897 2 $62,770 13 $145,186 APPLICATIONS APPROVED, NOT ACCEPTED 0 $0 48 $183,104 57 $132,262 46 $27,168 0 $0 2 $102,225 APPLICATIONS DENIED 12 $139,552 88 $188,158 239 $125,446 69 $28,991 0 $0 9 $190,087 APPLICATIONS WITHDRAWN 7 $186,957 33 $172,094 260 $107,842 10 $56,692 0 $0 20 $110,423 FILES CLOSED FOR INCOMPLETENESS 1 $271,750 5 $127,258 36 $139,928 3 $37,053 0 $0 4 $239,105
Aggregated Statistics For Year 1999(Based on 1 full and 3 partial tracts) A) FHA, FSA/RHS & VA B) Conventional C) Refinancings D) Home Improvement Loans E) Loans on Dwellings For 5+ Families F) Non-occupant Loans on Number Average Value Number Average Value Number Average Value Number Average Value Number Average Value Number Average Value
LOANS ORIGINATED 16 $199,706 61 $219,377 102 $134,663 22 $10,559 1 $844,560 5 $141,284 APPLICATIONS APPROVED, NOT ACCEPTED 0 $0 16 $147,303 69 $137,083 9 $103,431 0 $0 4 $167,258 APPLICATIONS DENIED 5 $202,222 30 $158,287 140 $134,637 43 $37,307 0 $0 6 $226,262 APPLICATIONS WITHDRAWN 5 $206,432 14 $158,503 111 $133,049 7 $42,854 0 $0 2 $177,960 FILES CLOSED FOR INCOMPLETENESS 0 $0 6 $154,783 21 $163,530 1 $224,750 0 $0 1 $157,410
Detailed HMDA statistics for the following Tracts:
0027.00
,
0033.00 ,
0034.00 ,
0041.00
Private Mortgage Insurance Companies Aggregated Statistics For Year 2009(Based on 2 full and 6 partial tracts) A) Conventional B) Refinancings Number Average Value Number Average Value
LOANS ORIGINATED 7 $176,527 1 $403,690 APPLICATIONS APPROVED, NOT ACCEPTED 4 $308,860 1 $244,020 APPLICATIONS DENIED 1 $117,170 1 $220,550 APPLICATIONS WITHDRAWN 4 $438,952 0 $0 FILES CLOSED FOR INCOMPLETENESS 0 $0 0 $0
Aggregated Statistics For Year 2008(Based on 2 full and 6 partial tracts) A) Conventional B) Refinancings C) Non-occupant Loans on Number Average Value Number Average Value Number Average Value
LOANS ORIGINATED 26 $298,545 11 $449,895 0 $0 APPLICATIONS APPROVED, NOT ACCEPTED 20 $358,498 7 $435,247 2 $525,320 APPLICATIONS DENIED 7 $358,570 1 $204,150 3 $306,400 APPLICATIONS WITHDRAWN 6 $231,042 0 $0 0 $0 FILES CLOSED FOR INCOMPLETENESS 1 $69,910 0 $0 0 $0
Aggregated Statistics For Year 2007(Based on 2 full and 6 partial tracts) A) Conventional B) Refinancings C) Non-occupant Loans on D) Loans On Manufactured Number Average Value Number Average Value Number Average Value Number Average Value
LOANS ORIGINATED 41 $302,337 6 $336,793 1 $167,910 1 $128,980 APPLICATIONS APPROVED, NOT ACCEPTED 6 $281,312 1 $244,020 0 $0 0 $0 APPLICATIONS DENIED 0 $0 0 $0 0 $0 0 $0 APPLICATIONS WITHDRAWN 4 $66,215 3 $382,020 0 $0 0 $0 FILES CLOSED FOR INCOMPLETENESS 1 $380,520 0 $0 0 $0 0 $0
Aggregated Statistics For Year 2006(Based on 2 full and 6 partial tracts) A) Conventional B) Refinancings C) Non-occupant Loans on Number Average Value Number Average Value Number Average Value
LOANS ORIGINATED 31 $225,179 6 $408,210 1 $46,280 APPLICATIONS APPROVED, NOT ACCEPTED 5 $181,288 3 $369,913 0 $0 APPLICATIONS DENIED 1 $67,940 0 $0 0 $0 APPLICATIONS WITHDRAWN 2 $385,825 2 $460,025 0 $0 FILES CLOSED FOR INCOMPLETENESS 0 $0 0 $0 0 $0
Aggregated Statistics For Year 2005(Based on 2 full and 4 partial tracts) A) Conventional B) Refinancings C) Non-occupant Loans on Number Average Value Number Average Value Number Average Value
LOANS ORIGINATED 30 $183,679 11 $356,920 1 $44,310 APPLICATIONS APPROVED, NOT ACCEPTED 8 $219,068 4 $265,422 2 $409,570 APPLICATIONS DENIED 0 $0 0 $0 0 $0 APPLICATIONS WITHDRAWN 2 $71,385 0 $0 0 $0 FILES CLOSED FOR INCOMPLETENESS 0 $0 0 $0 0 $0
Aggregated Statistics For Year 2004(Based on 2 full and 6 partial tracts) A) Conventional B) Refinancings C) Non-occupant Loans on Number Average Value Number Average Value Number Average Value
LOANS ORIGINATED 66 $227,872 4 $292,955 5 $342,924 APPLICATIONS APPROVED, NOT ACCEPTED 20 $260,559 5 $278,574 0 $0 APPLICATIONS DENIED 2 $169,845 0 $0 0 $0 APPLICATIONS WITHDRAWN 4 $264,975 2 $420,455 2 $274,390 FILES CLOSED FOR INCOMPLETENESS 2 $176,735 0 $0 0 $0
Aggregated Statistics For Year 2003(Based on 2 full and 6 partial tracts) A) Conventional B) Refinancings C) Non-occupant Loans on Number Average Value Number Average Value Number Average Value
LOANS ORIGINATED 68 $259,571 28 $257,901 3 $306,143 APPLICATIONS APPROVED, NOT ACCEPTED 28 $156,996 15 $274,426 2 $254,665 APPLICATIONS DENIED 5 $212,522 0 $0 1 $75,810 APPLICATIONS WITHDRAWN 8 $207,928 3 $245,033 1 $206,770 FILES CLOSED FOR INCOMPLETENESS 0 $0 0 $0 0 $0
Aggregated Statistics For Year 2002(Based on 2 full and 6 partial tracts) A) Conventional B) Refinancings C) Non-occupant Loans on Number Average Value Number Average Value Number Average Value
LOANS ORIGINATED 73 $204,550 25 $238,432 3 $230,220 APPLICATIONS APPROVED, NOT ACCEPTED 38 $201,361 15 $225,917 1 $154,020 APPLICATIONS DENIED 6 $290,012 6 $274,607 2 $379,305 APPLICATIONS WITHDRAWN 3 $277,907 2 $311,630 0 $0 FILES CLOSED FOR INCOMPLETENESS 1 $259,120 0 $0 0 $0
Aggregated Statistics For Year 2001(Based on 2 full and 6 partial tracts) A) Conventional B) Refinancings C) Non-occupant Loans on Number Average Value Number Average Value Number Average Value
LOANS ORIGINATED 113 $211,165 14 $248,414 2 $213,690 APPLICATIONS APPROVED, NOT ACCEPTED 32 $242,678 3 $213,297 0 $0 APPLICATIONS DENIED 3 $73,880 2 $365,050 0 $0 APPLICATIONS WITHDRAWN 2 $152,440 2 $196,690 0 $0 FILES CLOSED FOR INCOMPLETENESS 3 $202,093 2 $260,045 0 $0
Aggregated Statistics For Year 2000(Based on 2 full and 6 partial tracts) A) Conventional B) Refinancings C) Non-occupant Loans on Number Average Value Number Average Value Number Average Value
LOANS ORIGINATED 81 $185,198 12 $249,448 2 $338,340 APPLICATIONS APPROVED, NOT ACCEPTED 16 $193,074 4 $144,192 0 $0 APPLICATIONS DENIED 6 $209,222 0 $0 0 $0 APPLICATIONS WITHDRAWN 3 $137,123 2 $154,330 0 $0 FILES CLOSED FOR INCOMPLETENESS 1 $27,570 0 $0 0 $0
Aggregated Statistics For Year 1999(Based on 1 full and 3 partial tracts) A) Conventional B) Refinancings Number Average Value Number Average Value
LOANS ORIGINATED 35 $165,138 16 $181,669 APPLICATIONS APPROVED, NOT ACCEPTED 6 $161,410 1 $394,500 APPLICATIONS DENIED 1 $190,640 0 $0 APPLICATIONS WITHDRAWN 0 $0 0 $0 FILES CLOSED FOR INCOMPLETENESS 0 $0 0 $0
Detailed PMIC statistics for the following Tracts:
0027.00
,
0033.00 ,
0034.00 ,
0041.00
2002 - 2018 National Fire Incident Reporting System (NFIRS) incidents See full 2006 National Fire Incident Reporting System statistics for zip code 10553, New York
Most common first names in zip code 10553 among deceased individuals Name Count Lived (average)
William 48 74.1 years John 47 71.4 years James 43 71.7 years Joseph 42 72.1 years Mary 42 79.2 years Charles 31 72.3 years Robert 31 68.9 years George 29 75.6 years Thomas 20 72.6 years Elizabeth 19 73.9 years
Most common last names in zip code 10553 among deceased individuals Last name Count Lived (average)
Williams 30 73.3 years Smith 27 74.8 years Brown 27 74.5 years Jones 19 76.1 years Johnson 18 72.4 years Green 14 63.2 years Miller 14 78.8 years Anderson 13 72.3 years Scott 11 72.5 years James 11 72.2 years
Businesses in zip code 10553
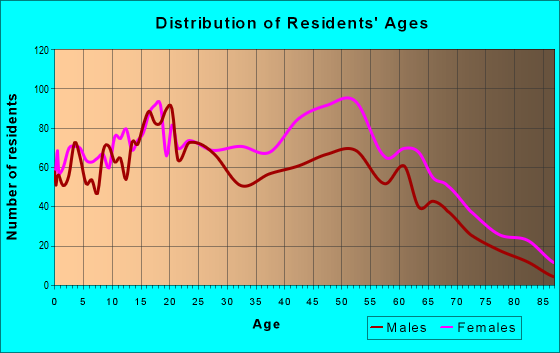
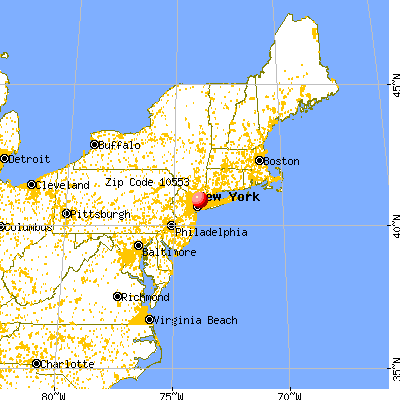


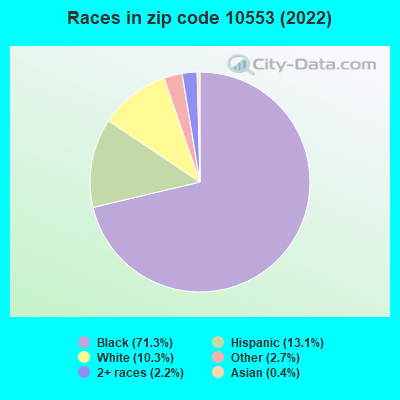


 Nearest zip codes: 10550, 10552, 10803, 10466, 10708, 10475.
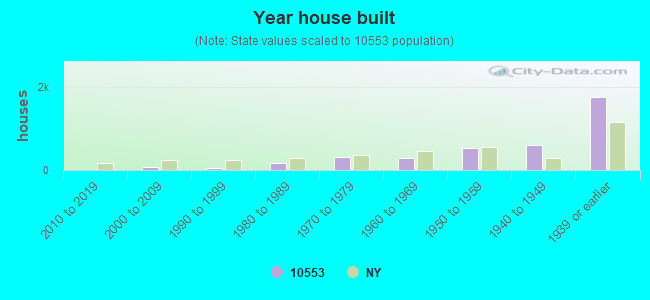

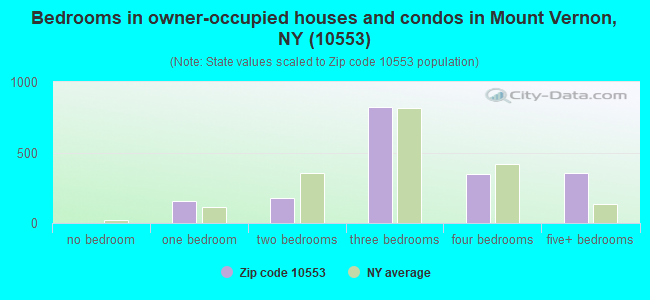
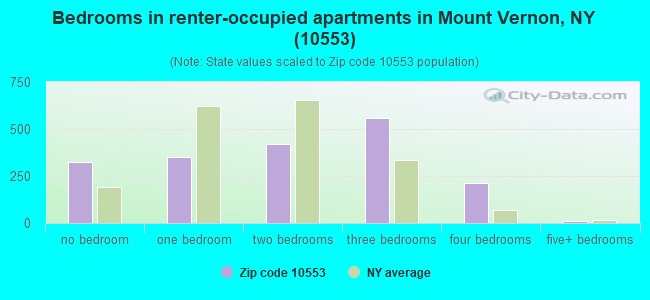
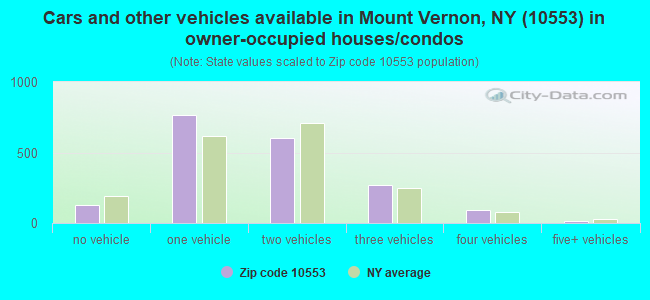
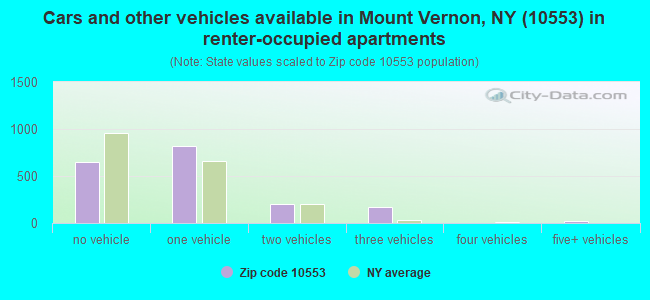


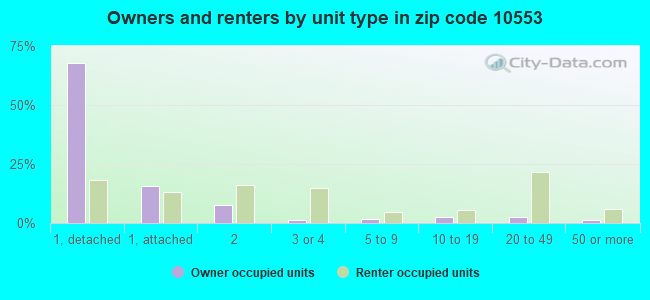
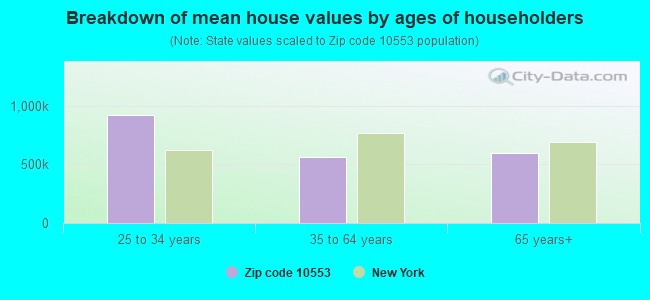


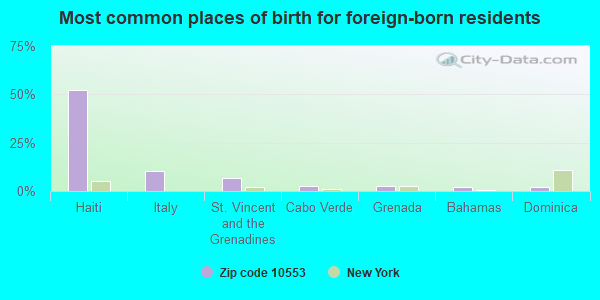
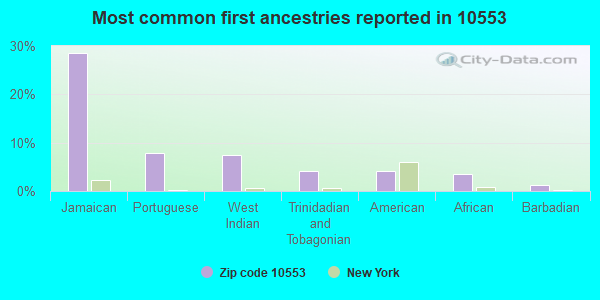
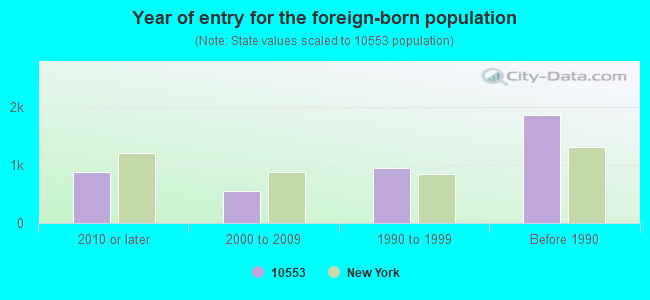


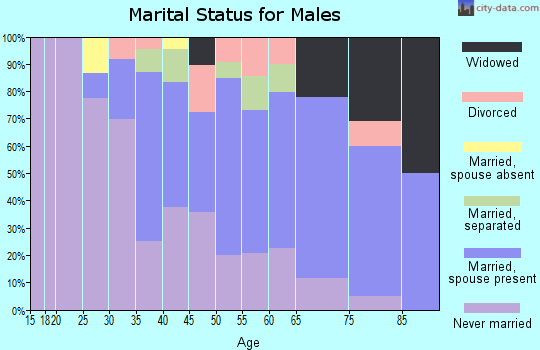
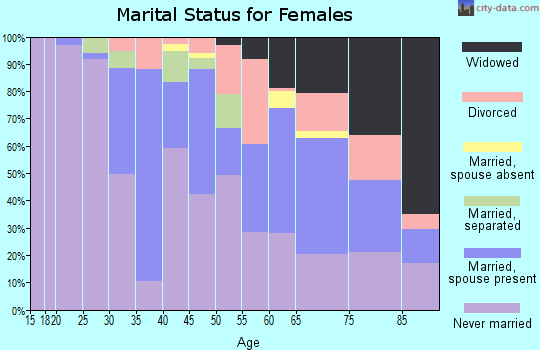
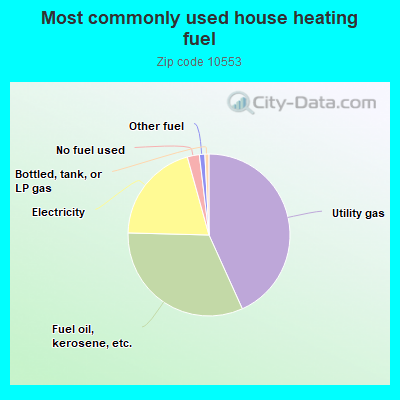
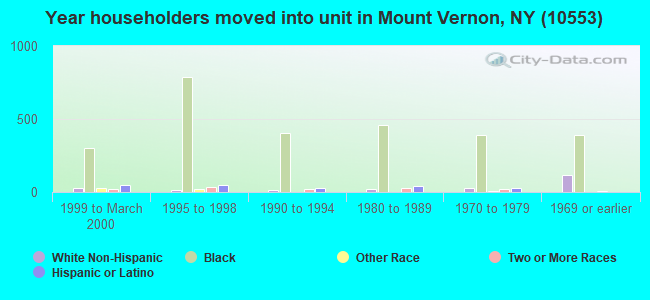
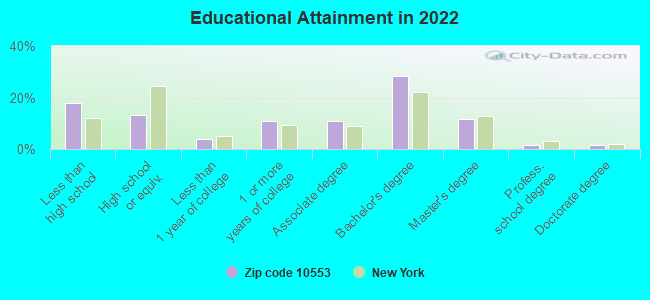

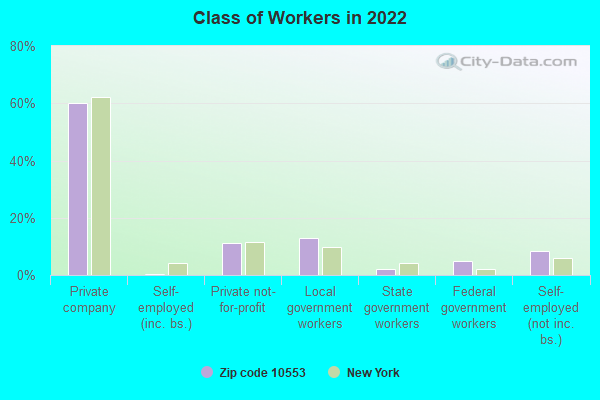
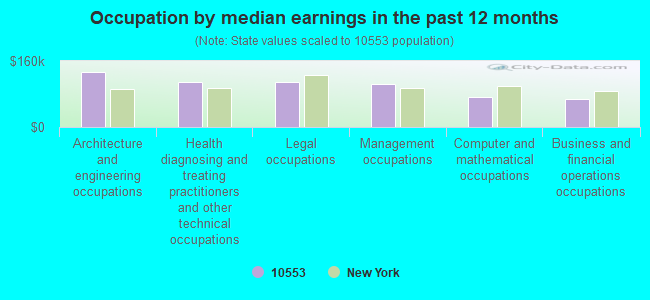
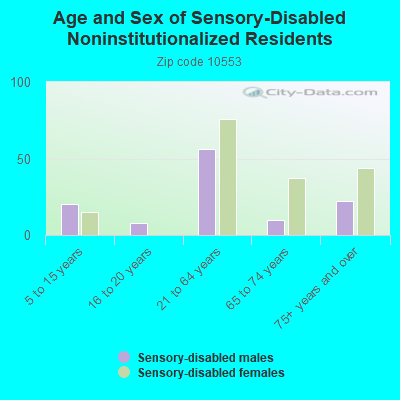
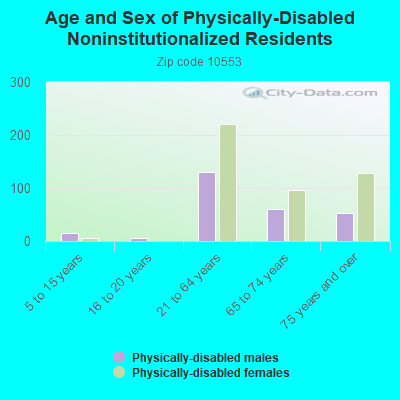
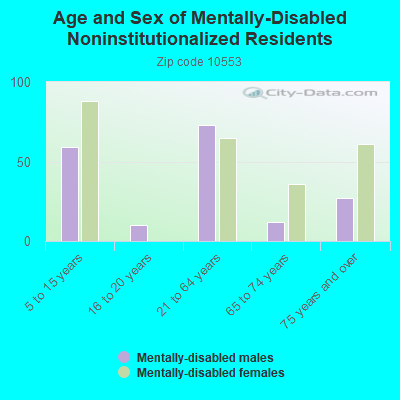
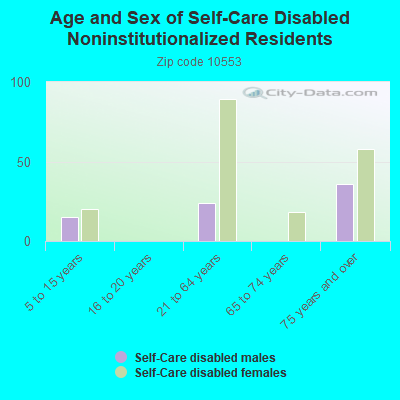
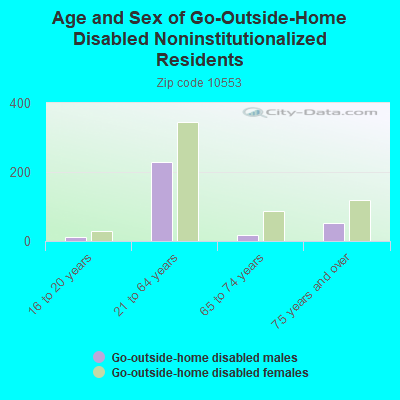
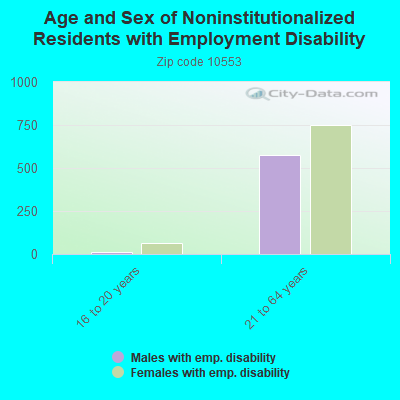
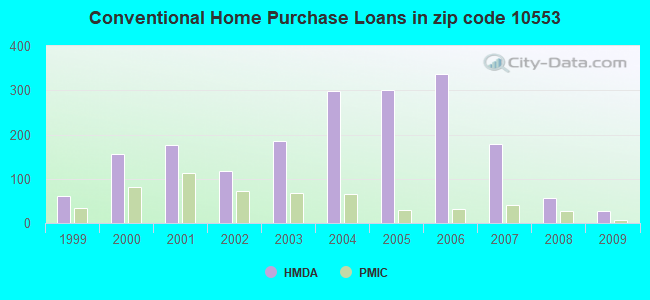
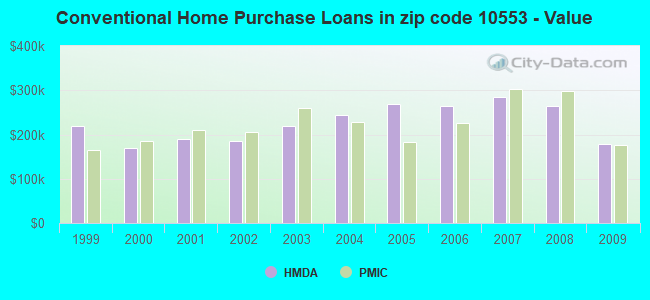
 According to the data from the years 2002 - 2018 the average number of fires per year is 15. The highest number of fire incidents - 70 took place in 2002, and the least - 0 in 2005. The data has a declining trend.
 When looking into fire subcategories, the most reports belonged to: Structure Fires (57.7%), and Outside Fires (20.2%).