Estimated zip code population in 2022: 19,750
Zip code population in 2010: 19,929
Zip code population in 2000: 17,805
Houses and condos: 7,012
Renter-occupied apartments: 469
% of renters here:
7%State:
46%
March 2022 cost of living index in zip code 10567: 146.3
(very high, U.S. average is 100)
Land area: 22.1
sq. mi.
Water area: 0.5
sq. mi.
Population density: 892 people per square mile (low).
OSM Map
General Map
Google Map
MSN Map
OSM Map
General Map
Google Map
MSN Map
OSM Map
General Map
Google Map
MSN Map
OSM Map
General Map
Google Map
MSN Map
Please wait while loading the map...
Real estate property taxes paid for housing units in 2022:
This zip code:
1.9% ($9,805)New York:
1.5% ($6,180)
Median real estate property taxes paid for housing units with mortgages in 2022: $9,858 (1.9%)
Median real estate property taxes paid for housing units with no mortgage in 2022: $9,755 (2.0%)
Profiles of local businesses
Business Search - 14 Million verified businesses
Males: 10,054 Females: 9,695
For population 25 years and over in 10567:
High school or higher: 95.5%Bachelor's degree or higher: 52.5%Graduate or professional degree: 28.0%Unemployed: 6.5%Mean travel time to work (commute): 41.7 minutes
For population 15 years and over in 10567:
Never married: 29.8%Now married: 56.4%Separated: 1.1%Widowed: 5.2%Divorced: 7.5%
Zip code 10567 compared to state average:
Median household income above state average. Black race population percentage below state average. Renting percentage significantly below state average. Number of rooms per house above state average. 13,033 66.0% White 3,513 17.8% Hispanic or Latino 1,445 7.3% Black 840 4.3% Asian 847 4.3% Two or more races 45 0.2% Some other race 11 0.06% American Indian 12 0.06% Native Hawaiian and Other
Data:
Median household income ($)
Median household income (% change since 2000)
Household income diversity
Ratio of average income to average house value (%)
Ratio of average income to average rent
Median household income ($) - White
Median household income ($) - Black or African American
Median household income ($) - Asian
Median household income ($) - Hispanic or Latino
Median household income ($) - American Indian and Alaska Native
Median household income ($) - Multirace
Median household income ($) - Other Race
Median household income for houses/condos with a mortgage ($)
Median household income for apartments without a mortgage ($)
Races - White alone (%)
Races - White alone (% change since 2000)
Races - Black alone (%)
Races - Black alone (% change since 2000)
Races - American Indian alone (%)
Races - American Indian alone (% change since 2000)
Races - Asian alone (%)
Races - Asian alone (% change since 2000)
Races - Hispanic (%)
Races - Hispanic (% change since 2000)
Races - Native Hawaiian and Other Pacific Islander alone (%)
Races - Native Hawaiian and Other Pacific Islander alone (% change since 2000)
Races - Two or more races (%)
Races - Two or more races (% change since 2000)
Races - Other race alone (%)
Races - Other race alone (% change since 2000)
Racial diversity
Unemployment (%)
Unemployment (% change since 2000)
Unemployment (%) - White
Unemployment (%) - Black or African American
Unemployment (%) - Asian
Unemployment (%) - Hispanic or Latino
Unemployment (%) - American Indian and Alaska Native
Unemployment (%) - Multirace
Unemployment (%) - Other Race
Population density (people per square mile)
Population - Males (%)
Population - Females (%)
Population - Males (%) - White
Population - Males (%) - Black or African American
Population - Males (%) - Asian
Population - Males (%) - Hispanic or Latino
Population - Males (%) - American Indian and Alaska Native
Population - Males (%) - Multirace
Population - Males (%) - Other Race
Population - Females (%) - White
Population - Females (%) - Black or African American
Population - Females (%) - Asian
Population - Females (%) - Hispanic or Latino
Population - Females (%) - American Indian and Alaska Native
Population - Females (%) - Multirace
Population - Females (%) - Other Race
Coronavirus confirmed cases (May 21, 2024)
Deaths caused by coronavirus (May 21, 2024)
Coronavirus confirmed cases (per 100k population) (May 21, 2024)
Deaths caused by coronavirus (per 100k population) (May 21, 2024)
Daily increase in number of cases (May 21, 2024)
Weekly increase in number of cases (May 21, 2024)
Cases doubled (in days) (May 21, 2024)
Hospitalized patients (Apr 18, 2022)
Negative test results (Apr 18, 2022)
Total test results (Apr 18, 2022)
COVID Vaccine doses distributed (per 100k population) (Sep 19, 2023)
COVID Vaccine doses administered (per 100k population) (Sep 19, 2023)
COVID Vaccine doses distributed (Sep 19, 2023)
COVID Vaccine doses administered (Sep 19, 2023)
Likely homosexual households (%)
Likely homosexual households (% change since 2000)
Likely homosexual households - Lesbian couples (%)
Likely homosexual households - Lesbian couples (% change since 2000)
Likely homosexual households - Gay men (%)
Likely homosexual households - Gay men (% change since 2000)
Cost of living index
Median gross rent ($)
Median contract rent ($)
Median monthly housing costs ($)
Median house or condo value ($)
Median house or condo value ($ change since 2000)
Mean house or condo value by units in structure - 1, detached ($)
Mean house or condo value by units in structure - 1, attached ($)
Mean house or condo value by units in structure - 2 ($)
Mean house or condo value by units in structure by units in structure - 3 or 4 ($)
Mean house or condo value by units in structure - 5 or more ($)
Mean house or condo value by units in structure - Boat, RV, van, etc. ($)
Mean house or condo value by units in structure - Mobile home ($)
Median house or condo value ($) - White
Median house or condo value ($) - Black or African American
Median house or condo value ($) - Asian
Median house or condo value ($) - Hispanic or Latino
Median house or condo value ($) - American Indian and Alaska Native
Median house or condo value ($) - Multirace
Median house or condo value ($) - Other Race
Median resident age
Resident age diversity
Median resident age - Males
Median resident age - Females
Median resident age - White
Median resident age - Black or African American
Median resident age - Asian
Median resident age - Hispanic or Latino
Median resident age - American Indian and Alaska Native
Median resident age - Multirace
Median resident age - Other Race
Median resident age - Males - White
Median resident age - Males - Black or African American
Median resident age - Males - Asian
Median resident age - Males - Hispanic or Latino
Median resident age - Males - American Indian and Alaska Native
Median resident age - Males - Multirace
Median resident age - Males - Other Race
Median resident age - Females - White
Median resident age - Females - Black or African American
Median resident age - Females - Asian
Median resident age - Females - Hispanic or Latino
Median resident age - Females - American Indian and Alaska Native
Median resident age - Females - Multirace
Median resident age - Females - Other Race
Commute - mean travel time to work (minutes)
Travel time to work - Less than 5 minutes (%)
Travel time to work - Less than 5 minutes (% change since 2000)
Travel time to work - 5 to 9 minutes (%)
Travel time to work - 5 to 9 minutes (% change since 2000)
Travel time to work - 10 to 19 minutes (%)
Travel time to work - 10 to 19 minutes (% change since 2000)
Travel time to work - 20 to 29 minutes (%)
Travel time to work - 20 to 29 minutes (% change since 2000)
Travel time to work - 30 to 39 minutes (%)
Travel time to work - 30 to 39 minutes (% change since 2000)
Travel time to work - 40 to 59 minutes (%)
Travel time to work - 40 to 59 minutes (% change since 2000)
Travel time to work - 60 to 89 minutes (%)
Travel time to work - 60 to 89 minutes (% change since 2000)
Travel time to work - 90 or more minutes (%)
Travel time to work - 90 or more minutes (% change since 2000)
Marital status - Never married (%)
Marital status - Now married (%)
Marital status - Separated (%)
Marital status - Widowed (%)
Marital status - Divorced (%)
Median family income ($)
Median family income (% change since 2000)
Median non-family income ($)
Median non-family income (% change since 2000)
Median per capita income ($)
Median per capita income (% change since 2000)
Median family income ($) - White
Median family income ($) - Black or African American
Median family income ($) - Asian
Median family income ($) - Hispanic or Latino
Median family income ($) - American Indian and Alaska Native
Median family income ($) - Multirace
Median family income ($) - Other Race
Median year house/condo built
Median year apartment built
Year house built - Built 2005 or later (%)
Year house built - Built 2000 to 2004 (%)
Year house built - Built 1990 to 1999 (%)
Year house built - Built 1980 to 1989 (%)
Year house built - Built 1970 to 1979 (%)
Year house built - Built 1960 to 1969 (%)
Year house built - Built 1950 to 1959 (%)
Year house built - Built 1940 to 1949 (%)
Year house built - Built 1939 or earlier (%)
Average household size
Household density (households per square mile)
Average household size - White
Average household size - Black or African American
Average household size - Asian
Average household size - Hispanic or Latino
Average household size - American Indian and Alaska Native
Average household size - Multirace
Average household size - Other Race
Occupied housing units (%)
Vacant housing units (%)
Owner occupied housing units (%)
Renter occupied housing units (%)
Vacancy status - For rent (%)
Vacancy status - For sale only (%)
Vacancy status - Rented or sold, not occupied (%)
Vacancy status - For seasonal, recreational, or occasional use (%)
Vacancy status - For migrant workers (%)
Vacancy status - Other vacant (%)
Residents with income below the poverty level (%)
Residents with income below 50% of the poverty level (%)
Children below poverty level (%)
Poor families by family type - Married-couple family (%)
Poor families by family type - Male, no wife present (%)
Poor families by family type - Female, no husband present (%)
Poverty status for native-born residents (%)
Poverty status for foreign-born residents (%)
Poverty among high school graduates not in families (%)
Poverty among people who did not graduate high school not in families (%)
Residents with income below the poverty level (%) - White
Residents with income below the poverty level (%) - Black or African American
Residents with income below the poverty level (%) - Asian
Residents with income below the poverty level (%) - Hispanic or Latino
Residents with income below the poverty level (%) - American Indian and Alaska Native
Residents with income below the poverty level (%) - Multirace
Residents with income below the poverty level (%) - Other Race
Air pollution - Air Quality Index (AQI)
Air pollution - CO
Air pollution - NO2
Air pollution - SO2
Air pollution - Ozone
Air pollution - PM10
Air pollution - PM25
Air pollution - Pb
Crime - Murders per 100,000 population
Crime - Rapes per 100,000 population
Crime - Robberies per 100,000 population
Crime - Assaults per 100,000 population
Crime - Burglaries per 100,000 population
Crime - Thefts per 100,000 population
Crime - Auto thefts per 100,000 population
Crime - Arson per 100,000 population
Crime - City-data.com crime index
Crime - Violent crime index
Crime - Property crime index
Crime - Murders per 100,000 population (5 year average)
Crime - Rapes per 100,000 population (5 year average)
Crime - Robberies per 100,000 population (5 year average)
Crime - Assaults per 100,000 population (5 year average)
Crime - Burglaries per 100,000 population (5 year average)
Crime - Thefts per 100,000 population (5 year average)
Crime - Auto thefts per 100,000 population (5 year average)
Crime - Arson per 100,000 population (5 year average)
Crime - City-data.com crime index (5 year average)
Crime - Violent crime index (5 year average)
Crime - Property crime index (5 year average)
1996 Presidential Elections Results (%) - Democratic Party (Clinton)
1996 Presidential Elections Results (%) - Republican Party (Dole)
1996 Presidential Elections Results (%) - Other
2000 Presidential Elections Results (%) - Democratic Party (Gore)
2000 Presidential Elections Results (%) - Republican Party (Bush)
2000 Presidential Elections Results (%) - Other
2004 Presidential Elections Results (%) - Democratic Party (Kerry)
2004 Presidential Elections Results (%) - Republican Party (Bush)
2004 Presidential Elections Results (%) - Other
2008 Presidential Elections Results (%) - Democratic Party (Obama)
2008 Presidential Elections Results (%) - Republican Party (McCain)
2008 Presidential Elections Results (%) - Other
2012 Presidential Elections Results (%) - Democratic Party (Obama)
2012 Presidential Elections Results (%) - Republican Party (Romney)
2012 Presidential Elections Results (%) - Other
2016 Presidential Elections Results (%) - Democratic Party (Clinton)
2016 Presidential Elections Results (%) - Republican Party (Trump)
2016 Presidential Elections Results (%) - Other
2020 Presidential Elections Results (%) - Democratic Party (Biden)
2020 Presidential Elections Results (%) - Republican Party (Trump)
2020 Presidential Elections Results (%) - Other
Ancestries Reported - Arab (%)
Ancestries Reported - Czech (%)
Ancestries Reported - Danish (%)
Ancestries Reported - Dutch (%)
Ancestries Reported - English (%)
Ancestries Reported - French (%)
Ancestries Reported - French Canadian (%)
Ancestries Reported - German (%)
Ancestries Reported - Greek (%)
Ancestries Reported - Hungarian (%)
Ancestries Reported - Irish (%)
Ancestries Reported - Italian (%)
Ancestries Reported - Lithuanian (%)
Ancestries Reported - Norwegian (%)
Ancestries Reported - Polish (%)
Ancestries Reported - Portuguese (%)
Ancestries Reported - Russian (%)
Ancestries Reported - Scotch-Irish (%)
Ancestries Reported - Scottish (%)
Ancestries Reported - Slovak (%)
Ancestries Reported - Subsaharan African (%)
Ancestries Reported - Swedish (%)
Ancestries Reported - Swiss (%)
Ancestries Reported - Ukrainian (%)
Ancestries Reported - United States (%)
Ancestries Reported - Welsh (%)
Ancestries Reported - West Indian (%)
Ancestries Reported - Other (%)
Educational Attainment - No schooling completed (%)
Educational Attainment - Less than high school (%)
Educational Attainment - High school or equivalent (%)
Educational Attainment - Less than 1 year of college (%)
Educational Attainment - 1 or more years of college (%)
Educational Attainment - Associate degree (%)
Educational Attainment - Bachelor's degree (%)
Educational Attainment - Master's degree (%)
Educational Attainment - Professional school degree (%)
Educational Attainment - Doctorate degree (%)
School Enrollment - Nursery, preschool (%)
School Enrollment - Kindergarten (%)
School Enrollment - Grade 1 to 4 (%)
School Enrollment - Grade 5 to 8 (%)
School Enrollment - Grade 9 to 12 (%)
School Enrollment - College undergrad (%)
School Enrollment - Graduate or professional (%)
School Enrollment - Not enrolled in school (%)
School enrollment - Public schools (%)
School enrollment - Private schools (%)
School enrollment - Not enrolled (%)
Median number of rooms in houses and condos
Median number of rooms in apartments
Housing units lacking complete plumbing facilities (%)
Housing units lacking complete kitchen facilities (%)
Density of houses
Urban houses (%)
Rural houses (%)
Households with people 60 years and over (%)
Households with people 65 years and over (%)
Households with people 75 years and over (%)
Households with one or more nonrelatives (%)
Households with no nonrelatives (%)
Population in households (%)
Family households (%)
Nonfamily households (%)
Population in families (%)
Family households with own children (%)
Median number of bedrooms in owner occupied houses
Mean number of bedrooms in owner occupied houses
Median number of bedrooms in renter occupied houses
Mean number of bedrooms in renter occupied houses
Median number of vehichles in owner occupied houses
Mean number of vehichles in owner occupied houses
Median number of vehichles in renter occupied houses
Mean number of vehichles in renter occupied houses
Mortgage status - with mortgage (%)
Mortgage status - with second mortgage (%)
Mortgage status - with home equity loan (%)
Mortgage status - with both second mortgage and home equity loan (%)
Mortgage status - without a mortgage (%)
Average family size
Average family size - White
Average family size - Black or African American
Average family size - Asian
Average family size - Hispanic or Latino
Average family size - American Indian and Alaska Native
Average family size - Multirace
Average family size - Other Race
Geographical mobility - Same house 1 year ago (%)
Geographical mobility - Moved within same county (%)
Geographical mobility - Moved from different county within same state (%)
Geographical mobility - Moved from different state (%)
Geographical mobility - Moved from abroad (%)
Place of birth - Born in state of residence (%)
Place of birth - Born in other state (%)
Place of birth - Native, outside of US (%)
Place of birth - Foreign born (%)
Housing units in structures - 1, detached (%)
Housing units in structures - 1, attached (%)
Housing units in structures - 2 (%)
Housing units in structures - 3 or 4 (%)
Housing units in structures - 5 to 9 (%)
Housing units in structures - 10 to 19 (%)
Housing units in structures - 20 to 49 (%)
Housing units in structures - 50 or more (%)
Housing units in structures - Mobile home (%)
Housing units in structures - Boat, RV, van, etc. (%)
House/condo owner moved in on average (years ago)
Renter moved in on average (years ago)
Year householder moved into unit - Moved in 1999 to March 2000 (%)
Year householder moved into unit - Moved in 1995 to 1998 (%)
Year householder moved into unit - Moved in 1990 to 1994 (%)
Year householder moved into unit - Moved in 1980 to 1989 (%)
Year householder moved into unit - Moved in 1970 to 1979 (%)
Year householder moved into unit - Moved in 1969 or earlier (%)
Means of transportation to work - Drove car alone (%)
Means of transportation to work - Carpooled (%)
Means of transportation to work - Public transportation (%)
Means of transportation to work - Bus or trolley bus (%)
Means of transportation to work - Streetcar or trolley car (%)
Means of transportation to work - Subway or elevated (%)
Means of transportation to work - Railroad (%)
Means of transportation to work - Ferryboat (%)
Means of transportation to work - Taxicab (%)
Means of transportation to work - Motorcycle (%)
Means of transportation to work - Bicycle (%)
Means of transportation to work - Walked (%)
Means of transportation to work - Other means (%)
Working at home (%)
Industry diversity
Most Common Industries - Agriculture, forestry, fishing and hunting, and mining (%)
Most Common Industries - Agriculture, forestry, fishing and hunting (%)
Most Common Industries - Mining, quarrying, and oil and gas extraction (%)
Most Common Industries - Construction (%)
Most Common Industries - Manufacturing (%)
Most Common Industries - Wholesale trade (%)
Most Common Industries - Retail trade (%)
Most Common Industries - Transportation and warehousing, and utilities (%)
Most Common Industries - Transportation and warehousing (%)
Most Common Industries - Utilities (%)
Most Common Industries - Information (%)
Most Common Industries - Finance and insurance, and real estate and rental and leasing (%)
Most Common Industries - Finance and insurance (%)
Most Common Industries - Real estate and rental and leasing (%)
Most Common Industries - Professional, scientific, and management, and administrative and waste management services (%)
Most Common Industries - Professional, scientific, and technical services (%)
Most Common Industries - Management of companies and enterprises (%)
Most Common Industries - Administrative and support and waste management services (%)
Most Common Industries - Educational services, and health care and social assistance (%)
Most Common Industries - Educational services (%)
Most Common Industries - Health care and social assistance (%)
Most Common Industries - Arts, entertainment, and recreation, and accommodation and food services (%)
Most Common Industries - Arts, entertainment, and recreation (%)
Most Common Industries - Accommodation and food services (%)
Most Common Industries - Other services, except public administration (%)
Most Common Industries - Public administration (%)
Occupation diversity
Most Common Occupations - Management, business, science, and arts occupations (%)
Most Common Occupations - Management, business, and financial occupations (%)
Most Common Occupations - Management occupations (%)
Most Common Occupations - Business and financial operations occupations (%)
Most Common Occupations - Computer, engineering, and science occupations (%)
Most Common Occupations - Computer and mathematical occupations (%)
Most Common Occupations - Architecture and engineering occupations (%)
Most Common Occupations - Life, physical, and social science occupations (%)
Most Common Occupations - Education, legal, community service, arts, and media occupations (%)
Most Common Occupations - Community and social service occupations (%)
Most Common Occupations - Legal occupations (%)
Most Common Occupations - Education, training, and library occupations (%)
Most Common Occupations - Arts, design, entertainment, sports, and media occupations (%)
Most Common Occupations - Healthcare practitioners and technical occupations (%)
Most Common Occupations - Health diagnosing and treating practitioners and other technical occupations (%)
Most Common Occupations - Health technologists and technicians (%)
Most Common Occupations - Service occupations (%)
Most Common Occupations - Healthcare support occupations (%)
Most Common Occupations - Protective service occupations (%)
Most Common Occupations - Fire fighting and prevention, and other protective service workers including supervisors (%)
Most Common Occupations - Law enforcement workers including supervisors (%)
Most Common Occupations - Food preparation and serving related occupations (%)
Most Common Occupations - Building and grounds cleaning and maintenance occupations (%)
Most Common Occupations - Personal care and service occupations (%)
Most Common Occupations - Sales and office occupations (%)
Most Common Occupations - Sales and related occupations (%)
Most Common Occupations - Office and administrative support occupations (%)
Most Common Occupations - Natural resources, construction, and maintenance occupations (%)
Most Common Occupations - Farming, fishing, and forestry occupations (%)
Most Common Occupations - Construction and extraction occupations (%)
Most Common Occupations - Installation, maintenance, and repair occupations (%)
Most Common Occupations - Production, transportation, and material moving occupations (%)
Most Common Occupations - Production occupations (%)
Most Common Occupations - Transportation occupations (%)
Most Common Occupations - Material moving occupations (%)
People in Group quarters - Institutionalized population (%)
People in Group quarters - Correctional institutions (%)
People in Group quarters - Federal prisons and detention centers (%)
People in Group quarters - Halfway houses (%)
People in Group quarters - Local jails and other confinement facilities (including police lockups) (%)
People in Group quarters - Military disciplinary barracks (%)
People in Group quarters - State prisons (%)
People in Group quarters - Other types of correctional institutions (%)
People in Group quarters - Nursing homes (%)
People in Group quarters - Hospitals/wards, hospices, and schools for the handicapped (%)
People in Group quarters - Hospitals/wards and hospices for chronically ill (%)
People in Group quarters - Hospices or homes for chronically ill (%)
People in Group quarters - Military hospitals or wards for chronically ill (%)
People in Group quarters - Other hospitals or wards for chronically ill (%)
People in Group quarters - Hospitals or wards for drug/alcohol abuse (%)
People in Group quarters - Mental (Psychiatric) hospitals or wards (%)
People in Group quarters - Schools, hospitals, or wards for the mentally retarded (%)
People in Group quarters - Schools, hospitals, or wards for the physically handicapped (%)
People in Group quarters - Institutions for the deaf (%)
People in Group quarters - Institutions for the blind (%)
People in Group quarters - Orthopedic wards and institutions for the physically handicapped (%)
People in Group quarters - Wards in general hospitals for patients who have no usual home elsewhere (%)
People in Group quarters - Wards in military hospitals for patients who have no usual home elsewhere (%)
People in Group quarters - Juvenile institutions (%)
People in Group quarters - Long-term care (%)
People in Group quarters - Homes for abused, dependent, and neglected children (%)
People in Group quarters - Residential treatment centers for emotionally disturbed children (%)
People in Group quarters - Training schools for juvenile delinquents (%)
People in Group quarters - Short-term care, detention or diagnostic centers for delinquent children (%)
People in Group quarters - Type of juvenile institution unknown (%)
People in Group quarters - Noninstitutionalized population (%)
People in Group quarters - College dormitories (includes college quarters off campus) (%)
People in Group quarters - Military quarters (%)
People in Group quarters - On base (%)
People in Group quarters - Barracks, unaccompanied personnel housing (UPH), (Enlisted/Officer), ;and similar group living quarters for military personnel (%)
People in Group quarters - Transient quarters for temporary residents (%)
People in Group quarters - Military ships (%)
People in Group quarters - Group homes (%)
People in Group quarters - Homes or halfway houses for drug/alcohol abuse (%)
People in Group quarters - Homes for the mentally ill (%)
People in Group quarters - Homes for the mentally retarded (%)
People in Group quarters - Homes for the physically handicapped (%)
People in Group quarters - Other group homes (%)
People in Group quarters - Religious group quarters (%)
People in Group quarters - Dormitories (%)
People in Group quarters - Agriculture workers' dormitories on farms (%)
People in Group quarters - Job Corps and vocational training facilities (%)
People in Group quarters - Other workers' dormitories (%)
People in Group quarters - Crews of maritime vessels (%)
People in Group quarters - Other nonhousehold living situations (%)
People in Group quarters - Other noninstitutional group quarters (%)
Residents speaking English at home (%)
Residents speaking English at home - Born in the United States (%)
Residents speaking English at home - Native, born elsewhere (%)
Residents speaking English at home - Foreign born (%)
Residents speaking Spanish at home (%)
Residents speaking Spanish at home - Born in the United States (%)
Residents speaking Spanish at home - Native, born elsewhere (%)
Residents speaking Spanish at home - Foreign born (%)
Residents speaking other language at home (%)
Residents speaking other language at home - Born in the United States (%)
Residents speaking other language at home - Native, born elsewhere (%)
Residents speaking other language at home - Foreign born (%)
Class of Workers - Employee of private company (%)
Class of Workers - Self-employed in own incorporated business (%)
Class of Workers - Private not-for-profit wage and salary workers (%)
Class of Workers - Local government workers (%)
Class of Workers - State government workers (%)
Class of Workers - Federal government workers (%)
Class of Workers - Self-employed workers in own not incorporated business and Unpaid family workers (%)
House heating fuel used in houses and condos - Utility gas (%)
House heating fuel used in houses and condos - Bottled, tank, or LP gas (%)
House heating fuel used in houses and condos - Electricity (%)
House heating fuel used in houses and condos - Fuel oil, kerosene, etc. (%)
House heating fuel used in houses and condos - Coal or coke (%)
House heating fuel used in houses and condos - Wood (%)
House heating fuel used in houses and condos - Solar energy (%)
House heating fuel used in houses and condos - Other fuel (%)
House heating fuel used in houses and condos - No fuel used (%)
House heating fuel used in apartments - Utility gas (%)
House heating fuel used in apartments - Bottled, tank, or LP gas (%)
House heating fuel used in apartments - Electricity (%)
House heating fuel used in apartments - Fuel oil, kerosene, etc. (%)
House heating fuel used in apartments - Coal or coke (%)
House heating fuel used in apartments - Wood (%)
House heating fuel used in apartments - Solar energy (%)
House heating fuel used in apartments - Other fuel (%)
House heating fuel used in apartments - No fuel used (%)
Armed forces status - In Armed Forces (%)
Armed forces status - Civilian (%)
Armed forces status - Civilian - Veteran (%)
Armed forces status - Civilian - Nonveteran (%)
Fatal accidents locations in years 2005-2021
Fatal accidents locations in 2005
Fatal accidents locations in 2006
Fatal accidents locations in 2007
Fatal accidents locations in 2008
Fatal accidents locations in 2009
Fatal accidents locations in 2010
Fatal accidents locations in 2011
Fatal accidents locations in 2012
Fatal accidents locations in 2013
Fatal accidents locations in 2014
Fatal accidents locations in 2015
Fatal accidents locations in 2016
Fatal accidents locations in 2017
Fatal accidents locations in 2018
Fatal accidents locations in 2019
Fatal accidents locations in 2020
Fatal accidents locations in 2021
Alcohol use - People drinking some alcohol every month (%)
Alcohol use - People not drinking at all (%)
Alcohol use - Average days/month drinking alcohol
Alcohol use - Average drinks/week
Alcohol use - Average days/year people drink much
Audiometry - Average condition of hearing (%)
Audiometry - People that can hear a whisper from across a quiet room (%)
Audiometry - People that can hear normal voice from across a quiet room (%)
Audiometry - Ears ringing, roaring, buzzing (%)
Audiometry - Had a job exposure to loud noise (%)
Audiometry - Had off-work exposure to loud noise (%)
Blood Pressure & Cholesterol - Has high blood pressure (%)
Blood Pressure & Cholesterol - Checking blood pressure at home (%)
Blood Pressure & Cholesterol - Frequently checking blood cholesterol (%)
Blood Pressure & Cholesterol - Has high cholesterol level (%)
Consumer Behavior - Money monthly spent on food at supermarket/grocery store
Consumer Behavior - Money monthly spent on food at other stores
Consumer Behavior - Money monthly spent on eating out
Consumer Behavior - Money monthly spent on carryout/delivered foods
Consumer Behavior - Income spent on food at supermarket/grocery store (%)
Consumer Behavior - Income spent on food at other stores (%)
Consumer Behavior - Income spent on eating out (%)
Consumer Behavior - Income spent on carryout/delivered foods (%)
Current Health Status - General health condition (%)
Current Health Status - Blood donors (%)
Current Health Status - Has blood ever tested for HIV virus (%)
Current Health Status - Left-handed people (%)
Dermatology - People using sunscreen (%)
Diabetes - Diabetics (%)
Diabetes - Had a blood test for high blood sugar (%)
Diabetes - People taking insulin (%)
Diet Behavior & Nutrition - Diet health (%)
Diet Behavior & Nutrition - Milk product consumption (# of products/month)
Diet Behavior & Nutrition - Meals not home prepared (#/week)
Diet Behavior & Nutrition - Meals from fast food or pizza place (#/week)
Diet Behavior & Nutrition - Ready-to-eat foods (#/month)
Diet Behavior & Nutrition - Frozen meals/pizza (#/month)
Drug Use - People that ever used marijuana or hashish (%)
Drug Use - Ever used hard drugs (%)
Drug Use - Ever used any form of cocaine (%)
Drug Use - Ever used heroin (%)
Drug Use - Ever used methamphetamine (%)
Health Insurance - People covered by health insurance (%)
Kidney Conditions-Urology - Avg. # of times urinating at night
Medical Conditions - People with asthma (%)
Medical Conditions - People with anemia (%)
Medical Conditions - People with psoriasis (%)
Medical Conditions - People with overweight (%)
Medical Conditions - Elderly people having difficulties in thinking or remembering (%)
Medical Conditions - People who ever received blood transfusion (%)
Medical Conditions - People having trouble seeing even with glass/contacts (%)
Medical Conditions - People with arthritis (%)
Medical Conditions - People with gout (%)
Medical Conditions - People with congestive heart failure (%)
Medical Conditions - People with coronary heart disease (%)
Medical Conditions - People with angina pectoris (%)
Medical Conditions - People who ever had heart attack (%)
Medical Conditions - People who ever had stroke (%)
Medical Conditions - People with emphysema (%)
Medical Conditions - People with thyroid problem (%)
Medical Conditions - People with chronic bronchitis (%)
Medical Conditions - People with any liver condition (%)
Medical Conditions - People who ever had cancer or malignancy (%)
Mental Health - People who have little interest in doing things (%)
Mental Health - People feeling down, depressed, or hopeless (%)
Mental Health - People who have trouble sleeping or sleeping too much (%)
Mental Health - People feeling tired or having little energy (%)
Mental Health - People with poor appetite or overeating (%)
Mental Health - People feeling bad about themself (%)
Mental Health - People who have trouble concentrating on things (%)
Mental Health - People moving or speaking slowly or too fast (%)
Mental Health - People having thoughts they would be better off dead (%)
Oral Health - Average years since last visit a dentist
Oral Health - People embarrassed because of mouth (%)
Oral Health - People with gum disease (%)
Oral Health - General health of teeth and gums (%)
Oral Health - Average days a week using dental floss/device
Oral Health - Average days a week using mouthwash for dental problem
Oral Health - Average number of teeth
Pesticide Use - Households using pesticides to control insects (%)
Pesticide Use - Households using pesticides to kill weeds (%)
Physical Activity - People doing vigorous-intensity work activities (%)
Physical Activity - People doing moderate-intensity work activities (%)
Physical Activity - People walking or bicycling (%)
Physical Activity - People doing vigorous-intensity recreational activities (%)
Physical Activity - People doing moderate-intensity recreational activities (%)
Physical Activity - Average hours a day doing sedentary activities
Physical Activity - Average hours a day watching TV or videos
Physical Activity - Average hours a day using computer
Physical Functioning - People having limitations keeping them from working (%)
Physical Functioning - People limited in amount of work they can do (%)
Physical Functioning - People that need special equipment to walk (%)
Physical Functioning - People experiencing confusion/memory problems (%)
Physical Functioning - People requiring special healthcare equipment (%)
Prescription Medications - Average number of prescription medicines taking
Preventive Aspirin Use - Adults 40+ taking low-dose aspirin (%)
Reproductive Health - Vaginal deliveries (%)
Reproductive Health - Cesarean deliveries (%)
Reproductive Health - Deliveries resulted in a live birth (%)
Reproductive Health - Pregnancies resulted in a delivery (%)
Reproductive Health - Women breastfeeding newborns (%)
Reproductive Health - Women that had a hysterectomy (%)
Reproductive Health - Women that had both ovaries removed (%)
Reproductive Health - Women that have ever taken birth control pills (%)
Reproductive Health - Women taking birth control pills (%)
Reproductive Health - Women that have ever used Depo-Provera or injectables (%)
Reproductive Health - Women that have ever used female hormones (%)
Sexual Behavior - People 18+ that ever had sex (vaginal, anal, or oral) (%)
Sexual Behavior - Males 18+ that ever had vaginal sex with a woman (%)
Sexual Behavior - Males 18+ that ever performed oral sex on a woman (%)
Sexual Behavior - Males 18+ that ever had anal sex with a woman (%)
Sexual Behavior - Males 18+ that ever had any sex with a man (%)
Sexual Behavior - Females 18+ that ever had vaginal sex with a man (%)
Sexual Behavior - Females 18+ that ever performed oral sex on a man (%)
Sexual Behavior - Females 18+ that ever had anal sex with a man (%)
Sexual Behavior - Females 18+ that ever had any kind of sex with a woman (%)
Sexual Behavior - Average age people first had sex
Sexual Behavior - Average number of female sex partners in lifetime (males 18+)
Sexual Behavior - Average number of female vaginal sex partners in lifetime (males 18+)
Sexual Behavior - Average age people first performed oral sex on a woman (18+)
Sexual Behavior - Average number of woman performed oral sex on in lifetime (18+)
Sexual Behavior - Average number of male sex partners in lifetime (males 18+)
Sexual Behavior - Average number of male anal sex partners in lifetime (males 18+)
Sexual Behavior - Average age people first performed oral sex on a man (18+)
Sexual Behavior - Average number of male oral sex partners in lifetime (18+)
Sexual Behavior - People using protection when performing oral sex (%)
Sexual Behavior - Average number of times people have vaginal or anal sex a year
Sexual Behavior - People having sex without condom (%)
Sexual Behavior - Average number of male sex partners in lifetime (females 18+)
Sexual Behavior - Average number of male vaginal sex partners in lifetime (females 18+)
Sexual Behavior - Average number of female sex partners in lifetime (females 18+)
Sexual Behavior - Circumcised males 18+ (%)
Sleep Disorders - Average hours sleeping at night
Sleep Disorders - People that has trouble sleeping (%)
Smoking-Cigarette Use - People smoking cigarettes (%)
Taste & Smell - People 40+ having problems with smell (%)
Taste & Smell - People 40+ having problems with taste (%)
Taste & Smell - People 40+ that ever had wisdom teeth removed (%)
Taste & Smell - People 40+ that ever had tonsils teeth removed (%)
Taste & Smell - People 40+ that ever had a loss of consciousness because of a head injury (%)
Taste & Smell - People 40+ that ever had a broken nose or other serious injury to face or skull (%)
Taste & Smell - People 40+ that ever had two or more sinus infections (%)
Weight - Average height (inches)
Weight - Average weight (pounds)
Weight - Average BMI
Weight - People that are obese (%)
Weight - People that ever were obese (%)
Weight - People trying to lose weight (%)
Urban population: 18,354
Rural population: 1,395
Estimated median house/condo value in 2022: $509,856
10567:
$509,856New York:
$400,400
According to our research of New York and other state lists, there were 8 registered sex offenders living in 10567 zip code as of May 21, 2024 . The ratio of all residents to sex offenders in zip code 10567 is 2,619 to 1.The ratio of registered sex offenders to all residents in this zip code is much lower than the state average.
Median resident age: This zip code:
43.7 yearsNew York median age:
40.0 years
Average household size: This zip code:
2.9 peopleNew York:
2.5 people
Averages for the 2020 tax year for zip code 10567, filed in 2021:
Average Adjusted Gross Income (AGI) in 2020: $118,012 (Individual Income Tax Returns) Here:
$118,012State:
$90,930
Salary/wage: $103,858 (reported on 81.4% of returns )Here:
$103,858State:
$72,104
(% of AGI for various income ranges: 1121.4% for AGIs below $25k , 3525.0% for AGIs $25k-50k , 6368.4% for AGIs $50k-75k , 9470.4% for AGIs $75k-100k , 19516.9% for AGIs $100k-200k , 81974.7% for AGIs over 200k ) Taxable interest for individuals: $1,674 (reported on 50.6% of returns )This zip code:
$1,674New York:
$3,075
(% of AGI for various income ranges: 28.2% for AGIs below $25k , 24.2% for AGIs $25k-50k , 44.2% for AGIs $50k-75k , 91.3% for AGIs $75k-100k , 224.0% for AGIs $100k-200k , 765.8% for AGIs over 200k ) Ordinary dividends: $5,967 (reported on 35.4% of returns )(% of AGI for various income ranges: 58.1% for AGIs below $25k , 78.0% for AGIs $25k-50k , 123.3% for AGIs $50k-75k , 227.6% for AGIs $75k-100k , 427.4% for AGIs $100k-200k , 2210.6% for AGIs over 200k ) Net capital gain/loss in AGI: +$15,951 (reported on 30.4% of returns )Here:
+$15,951State:
+$44,925
(% of AGI for various income ranges: 31.3% for AGIs below $25k , 65.9% for AGIs $25k-50k , 68.1% for AGIs $50k-75k , 189.7% for AGIs $75k-100k , 430.8% for AGIs $100k-200k , 7737.9% for AGIs over 200k ) Profit/loss from business: +$18,963 (reported on 16.7% of returns )Here:
+$18,963State:
+$14,940
(% of AGI for various income ranges: 168.2% for AGIs below $25k , 157.5% for AGIs $25k-50k , 223.7% for AGIs $50k-75k , 233.4% for AGIs $75k-100k , 473.6% for AGIs $100k-200k , 3500.9% for AGIs over 200k ) Taxable individual retirement arrangement distribution: $22,773 (reported on 10.7% of returns )10567:
$22,773New York:
$19,609
(% of AGI for various income ranges: 59.3% for AGIs below $25k , 96.6% for AGIs $25k-50k , 255.0% for AGIs $50k-75k , 372.7% for AGIs $75k-100k , 723.1% for AGIs $100k-200k , 1668.3% for AGIs over 200k ) Self-employed (Keogh) retirement plans: $30,069 (reported on 1.6% of returns )10567:
$30,069New York:
$32,497
(% of AGI for various income ranges: 66.2% for AGIs $100k-200k , 741.5% for AGIs over 200k ) Total itemized deductions: $29,536 (reported on 20.7% of returns )Here:
$29,536State:
$39,326
(% of AGI for various income ranges: 198.5% for AGIs below $25k , 253.7% for AGIs $25k-50k , 539.3% for AGIs $50k-75k , 944.2% for AGIs $75k-100k , 1626.9% for AGIs $100k-200k , 4610.4% for AGIs over 200k ) Charity contributions: $5,654 (reported on 17.6% of returns )(% of AGI for various income ranges: 6.7% for AGIs below $25k , 21.9% for AGIs $25k-50k , 52.1% for AGIs $50k-75k , 101.0% for AGIs $75k-100k , 250.8% for AGIs $100k-200k , 1025.3% for AGIs over 200k ) Taxes paid: $9,592 (reported on 20.7% of returns )(% of AGI for various income ranges: 46.4% for AGIs below $25k , 91.9% for AGIs $25k-50k , 179.9% for AGIs $50k-75k , 365.4% for AGIs $75k-100k , 574.2% for AGIs $100k-200k , 1327.0% for AGIs over 200k ) Earned income credit: $1,798 (reported on 6.1% of returns )(% of AGI for various income ranges: 46.3% for AGIs below $25k , 44.1% for AGIs $25k-50k ) Percentage of individuals using paid preparers for their 2020 taxes: 94.3%(% for various income ranges: 92.9% for AGIs below $25k , 93.3% for AGIs $25k-50k , 94.2% for AGIs $50k-75k , 94.2% for AGIs $75k-100k , 95.7% for AGIs $100k-200k , 95.6% for AGIs over 200k )
Averages for the 2012 tax year for zip code 10567, filed in 2013:
Average Adjusted Gross Income (AGI) in 2012: $102,140 (Individual Income Tax Returns) Here:
$102,140State:
$77,088
Salary/wage: $90,638 (reported on 83.8% of returns )Here:
$90,638State:
$60,593
(% of AGI for various income ranges: 70.3% for AGIs below $25k , 74.4% for AGIs $25k-50k , 72.0% for AGIs $50k-75k , 71.6% for AGIs $75k-100k , 78.8% for AGIs $100k-200k , 72.0% for AGIs over 200k ) Taxable interest for individuals: $1,369 (reported on 57.0% of returns )This zip code:
$1,369New York:
$3,125
(% of AGI for various income ranges: 1.6% for AGIs below $25k , 1.3% for AGIs $25k-50k , 1.0% for AGIs $50k-75k , 0.7% for AGIs $75k-100k , 0.5% for AGIs $100k-200k , 0.8% for AGIs over 200k ) Ordinary dividends: $4,577 (reported on 36.7% of returns )(% of AGI for various income ranges: 3.1% for AGIs below $25k , 2.0% for AGIs $25k-50k , 1.6% for AGIs $50k-75k , 1.6% for AGIs $75k-100k , 1.2% for AGIs $100k-200k , 1.9% for AGIs over 200k ) Net capital gain/loss in AGI: +$6,455 (reported on 28.1% of returns )Here:
+$6,455State:
+$42,474
(% of AGI for various income ranges: 0.4% for AGIs $25k-50k , 0.3% for AGIs $50k-75k , 0.2% for AGIs $75k-100k , 0.7% for AGIs $100k-200k , 3.5% for AGIs over 200k ) Profit/loss from business: +$18,482 (reported on 16.9% of returns )Here:
+$18,482State:
+$16,168
(% of AGI for various income ranges: 8.1% for AGIs below $25k , 4.2% for AGIs $25k-50k , 3.3% for AGIs $50k-75k , 3.1% for AGIs $75k-100k , 2.5% for AGIs $100k-200k , 3.0% for AGIs over 200k ) Taxable individual retirement arrangement distribution: $19,945 (reported on 11.8% of returns )10567:
$19,945New York:
$17,621
(% of AGI for various income ranges: 3.8% for AGIs below $25k , 3.1% for AGIs $25k-50k , 3.1% for AGIs $50k-75k , 3.0% for AGIs $75k-100k , 2.2% for AGIs $100k-200k , 1.9% for AGIs over 200k ) Self-employment retirement plans: $28,013 (reported on 1.6% of returns )10567:
$28,013New York:
$27,330
(% of AGI for various income ranges: 1.3% for AGIs below $25k , 0.2% for AGIs $100k-200k , 0.8% for AGIs over 200k ) Total itemized deductions: $35,207 (23% of AGI, reported on 58.9% of returns )Here:
$35,207State:
$34,985
Here:
22.8% of AGIState:
21.3% of AGI
(% of AGI for various income ranges: 18.4% for AGIs below $25k , 18.9% for AGIs $25k-50k , 23.4% for AGIs $50k-75k , 24.7% for AGIs $75k-100k , 23.1% for AGIs $100k-200k , 17.0% for AGIs over 200k ) Charity contributions: $2,966 (reported on 52.3% of returns )(% of AGI for various income ranges: 0.9% for AGIs below $25k , 1.3% for AGIs $25k-50k , 1.7% for AGIs $50k-75k , 1.8% for AGIs $75k-100k , 1.8% for AGIs $100k-200k , 1.3% for AGIs over 200k ) Taxes paid: $19,597 (reported on 58.8% of returns )10567:
$19,597State:
$18,656
(% of AGI for various income ranges: 7.0% for AGIs below $25k , 7.8% for AGIs $25k-50k , 11.0% for AGIs $50k-75k , 12.2% for AGIs $75k-100k , 12.2% for AGIs $100k-200k , 11.2% for AGIs over 200k ) Earned income credit: $1,798 (reported on 6.1% of returns )(% of AGI for various income ranges: 2.8% for AGIs below $25k , 0.5% for AGIs $25k-50k ) Percentage of individuals using paid preparers for their 2012 taxes: 66.6%(% for various income ranges: 59.1% for AGIs below $25k , 62.0% for AGIs $25k-50k , 69.5% for AGIs $50k-75k , 71.9% for AGIs $75k-100k , 72.6% for AGIs $100k-200k , 70.4% for AGIs over 200k )
Averages for the 2004 tax year for zip code 10567, filed in 2005:
Average Adjusted Gross Income (AGI) in 2004: $83,698 (Individual Income Tax Returns) Here:
$83,698State:
$59,519
Salary/wage: $78,508 (reported on 84.7% of returns )Here:
$78,508State:
$50,673
(% of AGI for various income ranges: 118.1% for AGIs below $10k , 69.4% for AGIs $10k-25k , 76.8% for AGIs $25k-50k , 78.6% for AGIs $50k-75k , 82.7% for AGIs $75k-100k , 79.2% for AGIs over 100k ) Taxable interest for individuals: $1,403 (reported on 70.7% of returns )This zip code:
$1,403New York:
$2,377
(% of AGI for various income ranges: 9.1% for AGIs below $10k , 3.0% for AGIs $10k-25k , 1.7% for AGIs $25k-50k , 1.5% for AGIs $50k-75k , 1.2% for AGIs $75k-100k , 1.0% for AGIs over 100k ) Taxable dividends: $2,317 (reported on 44.2% of returns )(% of AGI for various income ranges: 9.0% for AGIs below $10k , 2.9% for AGIs $10k-25k , 1.6% for AGIs $25k-50k , 1.2% for AGIs $50k-75k , 0.9% for AGIs $75k-100k , 1.1% for AGIs over 100k ) Net capital gain/loss: +$5,495 (reported on 34.9% of returns )Here:
+$5,495State:
+$23,581
(% of AGI for various income ranges: -6.9% for AGIs below $10k , 0.6% for AGIs $10k-25k , 0.5% for AGIs $25k-50k , 1.3% for AGIs $50k-75k , 0.5% for AGIs $75k-100k , 3.1% for AGIs over 100k ) Profit/loss from business: +$17,176 (reported on 15.7% of returns )Here:
+$17,176State:
+$13,809
(% of AGI for various income ranges: 4.9% for AGIs below $10k , 6.2% for AGIs $10k-25k , 4.6% for AGIs $25k-50k , 4.0% for AGIs $50k-75k , 2.9% for AGIs $75k-100k , 2.9% for AGIs over 100k ) IRA payment deduction: $3,426 (reported on 3.7% of returns )10567:
$3,426New York:
$3,115
(% of AGI for various income ranges: 0.6% for AGIs below $10k , 0.3% for AGIs $10k-25k , 0.4% for AGIs $25k-50k , 0.3% for AGIs $50k-75k , 0.2% for AGIs $75k-100k , 0.1% for AGIs over 100k ) Self-employed pension: $16,745 (reported on 2.4% of returns )Here:
$16,745New York:
$19,016
(% of AGI for various income ranges: 0.2% for AGIs $25k-50k , 0.2% for AGIs $50k-75k , 0.2% for AGIs $75k-100k , 0.6% for AGIs over 100k ) Total itemized deductions: $29,155 (23% of AGI, reported on 58.6% of returns )Here:
$29,155State:
$25,864
Here:
22.8% of AGIState:
21.9% of AGI
(% of AGI for various income ranges: 25.1% for AGIs below $10k , 19.3% for AGIs $10k-25k , 21.2% for AGIs $25k-50k , 25.9% for AGIs $50k-75k , 25.3% for AGIs $75k-100k , 18.7% for AGIs over 100k ) Charity contributions deductions: $3,027 (2% of AGI, reported on 55.6% of returns )Here:
2.3% of AGIState:
3.6% of AGI
(% of AGI for various income ranges: 1.4% for AGIs below $10k , 1.5% for AGIs $10k-25k , 2.0% for AGIs $25k-50k , 2.4% for AGIs $50k-75k , 2.6% for AGIs $75k-100k , 1.9% for AGIs over 100k ) Total tax: $15,787 (reported on 81.6% of returns )10567:
$15,787State:
$11,730
(% of AGI for various income ranges: 3.7% for AGIs below $10k , 4.6% for AGIs $10k-25k , 7.4% for AGIs $25k-50k , 8.5% for AGIs $50k-75k , 9.4% for AGIs $75k-100k , 18.8% for AGIs over 100k ) Earned income credit: $1,461 (reported on 4.1% of returns )Percentage of individuals using paid preparers for their 2004 taxes: 65.4%(% for various income ranges: 57.4% for AGIs below $10k , 60.5% for AGIs $10k-25k , 64.6% for AGIs $25k-50k , 71.9% for AGIs $50k-75k , 69.7% for AGIs $75k-100k , 68.8% for AGIs over 100k )
Estimated median household income in 2022: This zip code:
$148,856New York:
$79,557
Nearest zip codes: 10566 ,
10517 ,
10511 ,
10537 ,
10547 ,
10548 .
Peekskill Zip Code Map
Percentage of family households: This zip code:
51.1%New York:
41.3%
Percentage of households with unmarried partners: This zip code:
3.1%New York:
42.3%
Likely homosexual households (counted as self-reported same-sex unmarried-partner households)
Lesbian couples: 0.3% of all households Gay men: 0.0% of all households
Household received Food Stamps/SNAP in the past 12 months: 245Household did not receive Food Stamps/SNAP in the past 12 months: 6,255
Women who had a birth in the past 12 months: 131 (124 now married , 5 unmarried) Women who did not have a birth in the past 12 months: 3,451 (1,448 now married , 1,993 unmarried)
Housing units in zip code 10567 with a mortgage: 4,133 (570
second mortgage , 507
both second mortgage and home equity loan )
Houses without a mortgage: 134
Median monthly owner costs for units with a mortgage: $3,313
Median monthly owner costs for units without a mortgage: $1,487
Residents with income below the poverty level in 2022:
This zip code:
5.1%Whole state:
14.3%
Residents with income below 50% of the poverty level in 2022:
This zip code:
2.7%Whole state:
6.8%
Median number of rooms in houses and condos: Median number of rooms in apartments: Notable locations in this zip code not listed on our city pages
Click to draw/clear zip code borders Notable locations in zip code 10567: (A) , Pine Lake Camp (B) , Valeria Home (C) , Camp Smith (D) , Hemlock Hill Farm (E) , Chicory Meadow Farm (F) , Hollowbrook Fire Station (G) , Furnace Woods Fire Station (H) , The Seabury at Fieldhome Assisted Living Facility (I) , Cortlandt Town Hall (J) . Display/hide their locations on the map
Shopping Center: (1) . Display/hide its location on the map
Churches in zip code 10567 include: (A) , Calvary Memorial Church (B) , Van Cortlandtville Church (C) . Display/hide their locations on the map
Cemeteries: (1) , Ackerman Cemetery (2) , Lent Cemetery (3) , Hebrew Cemetery (4) , Hillside Cemetery (5) . Display/hide their locations on the map
Lakes and reservoirs: (A) , Pine Lake (B) , Spy Pond (C) , Twin Lakes (D) , Nelson Pond (E) , Dickiebusch Lake (F) , Gregory Pond (G) , Dickerson Pond (H) . Display/hide their locations on the map
Parks in zip code 10567 include: (1) , Blue Mountain Reservation (2) . Display/hide their locations on the map
Year house built (houses)
0 2020 or later119 2010 to 2019711 2000 to 2009733 1990 to 1999964 1980 to 1989724 1970 to 19791,033 1960 to 19691,645 1950 to 1959366 1940 to 1949646 1939 or earlier
Zip code 10567 household income distribution in 2022 135 Less than $10,00073 $10,000 to $14,99934 $15,000 to $19,999150 $20,000 to $24,99955 $25,000 to $29,99960 $30,000 to $34,99980 $35,000 to $39,99911 $40,000 to $44,999125 $45,000 to $49,999169 $50,000 to $59,999266 $60,000 to $74,999783 $75,000 to $99,999678 $100,000 to $124,999588 $125,000 to $149,9991,166 $150,000 to $199,9992,131 $200,000 or moreEstimate of home value of owner-occupied houses/condos in 2022 in zip code 10567 12 $35,000 to $39,99921 $40,000 to $49,9998 $50,000 to $59,99969 $150,000 to $174,9996 $175,000 to $199,999153 $200,000 to $249,9998 $250,000 to $299,9991,117 $300,000 to $399,9991,824 $400,000 to $499,9992,136 $500,000 to $749,999767 $750,000 to $999,999128 $1,000,000 to $1,499,99916 $1,500,000 to $1,999,99918 $2,000,000 or moreRent paid by renters in 2022 in zip code 10567 18 Less than $10010 $300 to $34917 $500 to $54919 $900 to $99968 $1,000 to $1,24940 $1,250 to $1,49946 $1,500 to $1,999142 $2,000 to $2,49934 $2,500 to $2,9998 $3,000 to $3,49920 $3,500 or more38 No cash rent
Median gross rent in 2022: $2,067.
Median price asked for vacant for-sale houses and condos in 2022: $413,040.
Estimated median house (or condo) value in 2022 for: White Non-Hispanic householders: $509,627Black or African American householders: $504,611Asian householders: $715,531Native Hawaiian and other Pacific Islander householders: $427,540Some other race householders: $518,292Two or more races householders: $564,352Hispanic or Latino householders: $450,342Estimated median house or condo value in 2022: $509,856
10567:
$509,856New York:
$400,400
Lower value quartile - upper value quartile: $438,594 - $680,108
Mean price in 2022: Detached houses: $562,209Here:
$562,209State:
$476,719
Townhouses or other attached units: $556,648Here:
$556,648State:
$699,270
In 2-unit structures: $222,065Here:
$222,065State:
$713,077
In 3-to-4-unit structures: $650,813Here:
$650,813State:
$764,568
In 5-or-more-unit structures: $337,238Here:
$337,238State:
$912,009
Housing units in structures:
One, detached: 5,980One, attached: 513Two: 1873 or 4: 445 to 9: 7710 to 19: 2520 to 49: 11750 or more: 11Unemployment : 6.5%
Means of transportation to work in zip code 10567 65.0% 6,223 Drove a car alone6.8% 647 Carpooled1.8% 170 Bus or trolley bus0.9% 89 Streetcar or trolley car5.9% 569 Subway or elevated0.1% 5 Railroad0.1% 9 Taxi0.1% 12 Motorcycle0.1% 6 Bicycle0.3% 27 Walked0.4% 34 Other means19.1% 1,829 Worked at homeTravel time to work (commute) in zip code 10567 62 Less than 5 minutes538 5 to 9 minutes905 10 to 14 minutes451 15 to 19 minutes819 20 to 24 minutes265 25 to 29 minutes627 30 to 34 minutes236 35 to 39 minutes356 40 to 44 minutes1,352 45 to 59 minutes1,273 60 to 89 minutes961 90 or more minutes
Percentage of zip code residents living and working in this county: 78.6%
Household type by relationship:
Households: 19,750
Male householders: 3,035 (261 living alone ), Female householders: 3,565 (869 living alone )4,320 spouses (4,298 opposite-sex spouses ), 394 unmarried partners , (367 opposite-sex unmarried partners ), 5,984 children (5,783 natural , 121 adopted , 83 stepchildren ), 660 grandchildren , 149 brothers or sisters , 339 parents , 8 foster children , 427 other relatives , 336 non-relatives In group quarters: 495 (-1 institutionalized population )
Size of family households: 1,943 2-persons , 1,387 3-persons , 1,016 4-persons , 470 5-persons , 220 6-persons , 129 7-or-more-persons
Size of nonfamily households: 1,127 1-person , 170 2-persons , 4 3-persons , 50 4-persons
2,795 married couples with children. single-parent households (344 men , 460 women ).
77.8% of residents of 10567 zip code speak English at home. of residents speak Spanish at home (59% very well, 29% well, 9% not well, 3% not at all ).of residents speak other Indo-European language at home (84% very well, 11% well, 3% not well, 1% not at all ).of residents speak Asian or Pacific Island language at home (87% very well, 13% not well ).of residents speak other language at home (48% very well, 52% well ).
Foreign born population: 3,049 (15.4%)
(70.7%
of them are naturalized citizens )
This zip code:
15.4%Whole state:
22.7%
11% Colombia 9% Bhutan 7% Greece 7% Cabo Verde 5% Haiti 4% Dominica 4% Malaysia 21% Italian 8% American 6% Irish 3% European 3% Polish 3% German 2% Jamaican
Year of entry for the foreign-born population
679 2010 or later 845 2000 to 2009 598 1990 to 1999 1,326 Before 1990
Facilities with environmental interests located in this zip code:
HUDSON VALLEY HOSPITAL CENTER (1980 CROMPOND RD in CORTLANDT MANOR, NY)
STATE MASTER (New York facility tracking) - AIR PROGRAM ENFORCEMENT/COMPLIANCE ACTIVITY (Integrated Compliance Information System) Business SIC classification: GENERAL MEDICAL AND SURGICAL HOSPITALS
CORTLANDT CONSOLIDATED WATER DISTRICT (1 HEADY STREET in CORTLANDT MANOR, NY)
(Integrated Compliance Information System) - ICIS-02-2002-8089, FORMAL ENFORCEMENT ACTION
HORAN REALTY CORP (743 ALBANY POST RD in CORTLANDT MANOR, NY)
(Resource Conservation and Recovery Act (tracking hazardous waste))
Housing units lacking complete plumbing facilities: 0.2%
Housing units lacking complete kitchen facilities: 0.2%
69.8% Fuel oil, kerosene, etc. 22.2% Utility gas 5.2% Electricity 1.2% Wood 1.1% Bottled, tank, or LP gas 0.6% Other fuel
Place of birth for U.S.-born residents:
This state: 14,318Northeast: 958Midwest: 311South: 494West: 124
69% of the 10567 zip code residents lived in the same house 5 years ago.
Out of people who lived in different houses, 62% lived in this county.
Out of people who lived in different counties, 50% lived in New York.
93% of the 10567 zip code residents lived in the same house 1 year ago.
Out of people who lived in different houses, 51% moved from this county.
Out of people who lived in different houses, 32% moved from different county within same state.
Out of people who lived in different houses, 16% moved from different state.
Out of people who lived in different houses, 1% moved from abroad.
Private vs. public school enrollment:
Students in private schools in grades 1 to 8 (elementary and middle school): 325
Students in private schools in grades 9 to 12 (high school): 235
Students in private undergraduate colleges: 455
Occupation by median earnings in the past 12 months ($)
140,812 Health diagnosing and treating practitioners and other technical occupations 106,367 Management occupations 105,979 Law enforcement workers including supervisors 104,506 Architecture and engineering occupations 103,694 Computer and mathematical occupations 98,805 Life, physical, and social science occupations
Companies with federal contracts located in this zip code:
EAGLE AWARDS AND TROPHY CO INC (2051 E MAIN ST in CORTLANDT MANO, NY; small business) in 2 contracts in 2005
$37,000 with Army for Notions and Apparel Findings. Signed on 2005-05-18. Completion date: 2005-08-05.
with Navy for Miscellaneous Items. Taking place in MD. Signed on 2005-05-09. Completion date: 2005-05-11.
MOTION LABORATORIES, INC (520 FURNACE DOCK RD in CORTLANDT MANO, NY; small business)
$5,595 with Air Force for Electrical Control Equipment. Signed on 2004-12-08. Completion date: 2004-12-21.
Top industries in this zip code by the number of employees in 2005:
Health Care and Social Assistance: General Medical and Surgical Hospitals (500-999 employees: 1 establishment)Health Care and Social Assistance: Nursing Care Facilities (250-499: 1, 100-249: 1)Wholesale Trade: Medical, Dental, and Hospital Equipment and Supplies Merchant Wholesalers (100-249: 1, 1-4: 1)Health Care and Social Assistance: Offices of Physicians (except Mental Health Specialists) (50-99: 1, 10-19: 3, 5-9: 2, 1-4: 9)Accommodation and Food Services: Limited-Service Restaurants (50-99: 1, 20-49: 2, 1-4: 2)Construction: Plumbing, Heating, and Air-Conditioning Contractors (50-99: 1, 5-9: 2, 1-4: 8)Accommodation and Food Services: Full-Service Restaurants (20-49: 1, 10-19: 1, 5-9: 3, 1-4: 4)Construction: Roofing Contractors (50-99: 1)
People in group quarters in 2010:
314 people in nursing facilities/skilled-nursing facilities
103 people in college/university student housing
88 people in residential schools for people with disabilities
55 people in group homes intended for adults
6 people in other noninstitutional facilities
People in group quarters in 2000:
306 people in nursing homes
91 people in training schools for juvenile delinquents
71 people in college dormitories (includes college quarters off campus)
13 people in other noninstitutional group quarters
6 people in homes for the physically handicapped
5 people in religious group quarters
2 people in homes for the mentally retarded
Fatal accident statistics in 2014:
Fatal accident count: 1Vehicles involved in fatal accidents: 1Fatal accidents caused by drunken drivers: 0Fatalities: 1Persons involved in fatal accidents: 1Pedestrians involved in fatal accidents: 0
Fatal accident statistics in 2012:
Fatal accident count: 4Vehicles involved in fatal accidents: 6Fatal accidents caused by drunken drivers: 1Fatalities: 4Persons involved in fatal accidents: 11Pedestrians involved in fatal accidents: 0
Home Mortgage Disclosure Act Aggregated Statistics For Year 2009(Based on 2 full and 8 partial tracts) A) FHA, FSA/RHS & VA B) Conventional C) Refinancings D) Home Improvement Loans F) Non-occupant Loans on G) Loans On Manufactured Number Average Value Number Average Value Number Average Value Number Average Value Number Average Value Number Average Value
LOANS ORIGINATED 57 $338,355 178 $340,497 399 $289,431 26 $93,653 13 $250,155 0 $0 APPLICATIONS APPROVED, NOT ACCEPTED 8 $258,470 24 $450,602 68 $351,982 3 $22,570 1 $343,900 0 $0 APPLICATIONS DENIED 24 $324,546 38 $344,304 291 $351,349 22 $78,353 2 $369,465 3 $265,190 APPLICATIONS WITHDRAWN 11 $310,510 39 $316,263 134 $325,304 5 $94,848 3 $355,620 0 $0 FILES CLOSED FOR INCOMPLETENESS 3 $286,413 4 $316,348 50 $340,847 6 $115,307 0 $0 0 $0
Aggregated Statistics For Year 2008(Based on 2 full and 8 partial tracts) A) FHA, FSA/RHS & VA B) Conventional C) Refinancings D) Home Improvement Loans F) Non-occupant Loans on Number Average Value Number Average Value Number Average Value Number Average Value Number Average Value
LOANS ORIGINATED 24 $383,533 219 $349,780 222 $287,587 53 $112,933 16 $289,454 APPLICATIONS APPROVED, NOT ACCEPTED 4 $271,132 76 $365,275 96 $268,378 16 $115,469 5 $184,402 APPLICATIONS DENIED 14 $359,010 57 $331,084 228 $301,465 59 $114,353 20 $283,260 APPLICATIONS WITHDRAWN 8 $247,979 18 $333,806 103 $307,429 6 $119,783 0 $0 FILES CLOSED FOR INCOMPLETENESS 4 $295,280 10 $331,058 27 $334,665 2 $156,675 1 $150,770
Aggregated Statistics For Year 2007(Based on 2 full and 8 partial tracts) A) FHA, FSA/RHS & VA B) Conventional C) Refinancings D) Home Improvement Loans E) Loans on Dwellings For 5+ Families F) Non-occupant Loans on G) Loans On Manufactured Number Average Value Number Average Value Number Average Value Number Average Value Number Average Value Number Average Value Number Average Value
LOANS ORIGINATED 2 $290,470 451 $326,856 431 $276,746 119 $99,009 1 $233,840 24 $280,599 0 $0 APPLICATIONS APPROVED, NOT ACCEPTED 0 $0 98 $356,964 147 $235,595 43 $82,077 1 $582,130 6 $182,880 1 $101,910 APPLICATIONS DENIED 0 $0 101 $326,284 417 $334,258 70 $98,724 0 $0 26 $237,470 1 $311,310 APPLICATIONS WITHDRAWN 0 $0 49 $369,670 162 $309,463 23 $133,129 0 $0 3 $385,723 0 $0 FILES CLOSED FOR INCOMPLETENESS 0 $0 22 $243,619 65 $335,194 7 $141,004 0 $0 3 $313,040 0 $0
Aggregated Statistics For Year 2006(Based on 2 full and 8 partial tracts) A) FHA, FSA/RHS & VA B) Conventional C) Refinancings D) Home Improvement Loans E) Loans on Dwellings For 5+ Families F) Non-occupant Loans on G) Loans On Manufactured Number Average Value Number Average Value Number Average Value Number Average Value Number Average Value Number Average Value Number Average Value
LOANS ORIGINATED 1 $512,330 612 $328,234 576 $257,934 124 $148,052 0 $0 20 $269,835 3 $317,823 APPLICATIONS APPROVED, NOT ACCEPTED 0 $0 133 $308,169 134 $233,282 25 $91,610 0 $0 15 $167,465 1 $35,080 APPLICATIONS DENIED 0 $0 151 $304,454 358 $279,245 82 $135,756 2 $138,565 21 $298,989 2 $174,895 APPLICATIONS WITHDRAWN 2 $349,790 88 $363,843 271 $291,696 35 $181,209 0 $0 11 $274,216 0 $0 FILES CLOSED FOR INCOMPLETENESS 0 $0 51 $309,046 61 $283,027 5 $53,962 0 $0 6 $300,423 0 $0
Aggregated Statistics For Year 2005(Based on 2 full and 8 partial tracts) B) Conventional C) Refinancings D) Home Improvement Loans E) Loans on Dwellings For 5+ Families F) Non-occupant Loans on G) Loans On Manufactured Number Average Value Number Average Value Number Average Value Number Average Value Number Average Value Number Average Value
LOANS ORIGINATED 597 $313,433 664 $274,332 111 $131,133 1 $862,730 33 $297,541 0 $0 APPLICATIONS APPROVED, NOT ACCEPTED 88 $344,788 141 $214,422 27 $83,435 0 $0 8 $233,294 1 $18,150 APPLICATIONS DENIED 120 $318,009 339 $266,669 93 $122,759 0 $0 17 $270,341 2 $239,855 APPLICATIONS WITHDRAWN 141 $316,226 367 $270,268 41 $255,374 0 $0 10 $294,400 0 $0 FILES CLOSED FOR INCOMPLETENESS 36 $278,987 65 $313,025 9 $174,037 0 $0 1 $153,560 0 $0
Aggregated Statistics For Year 2004(Based on 2 full and 8 partial tracts) B) Conventional C) Refinancings D) Home Improvement Loans F) Non-occupant Loans on G) Loans On Manufactured Number Average Value Number Average Value Number Average Value Number Average Value Number Average Value
LOANS ORIGINATED 518 $316,056 782 $252,695 89 $120,887 39 $256,577 0 $0 APPLICATIONS APPROVED, NOT ACCEPTED 94 $314,050 220 $224,993 47 $88,134 9 $169,233 0 $0 APPLICATIONS DENIED 72 $285,604 317 $281,648 98 $122,751 16 $248,162 2 $250,925 APPLICATIONS WITHDRAWN 73 $314,685 418 $261,415 41 $118,859 3 $263,927 0 $0 FILES CLOSED FOR INCOMPLETENESS 25 $310,870 72 $240,438 7 $77,366 3 $264,567 0 $0
Aggregated Statistics For Year 2003(Based on 2 full and 8 partial tracts) A) FHA, FSA/RHS & VA B) Conventional C) Refinancings D) Home Improvement Loans F) Non-occupant Loans on Number Average Value Number Average Value Number Average Value Number Average Value Number Average Value
LOANS ORIGINATED 4 $244,578 473 $283,758 2,012 $217,155 62 $73,535 31 $225,123 APPLICATIONS APPROVED, NOT ACCEPTED 0 $0 69 $300,668 344 $218,526 40 $47,991 8 $183,060 APPLICATIONS DENIED 2 $249,985 49 $254,860 474 $244,792 60 $60,487 8 $237,649 APPLICATIONS WITHDRAWN 0 $0 64 $267,738 345 $235,678 27 $73,399 8 $233,598 FILES CLOSED FOR INCOMPLETENESS 0 $0 12 $325,752 92 $238,486 4 $75,868 0 $0
Aggregated Statistics For Year 2002(Based on 2 full and 8 partial tracts) A) FHA, FSA/RHS & VA B) Conventional C) Refinancings D) Home Improvement Loans E) Loans on Dwellings For 5+ Families F) Non-occupant Loans on Number Average Value Number Average Value Number Average Value Number Average Value Number Average Value Number Average Value
LOANS ORIGINATED 6 $204,197 559 $272,407 1,306 $220,270 105 $52,872 3 $231,737 33 $237,082 APPLICATIONS APPROVED, NOT ACCEPTED 0 $0 80 $353,807 248 $215,867 25 $42,525 0 $0 2 $139,725 APPLICATIONS DENIED 0 $0 73 $256,883 275 $202,590 66 $44,293 2 $300,735 10 $203,881 APPLICATIONS WITHDRAWN 4 $304,550 95 $290,001 325 $202,604 65 $65,867 0 $0 7 $273,541 FILES CLOSED FOR INCOMPLETENESS 1 $202,420 25 $299,317 82 $215,614 8 $56,182 0 $0 2 $256,845
Aggregated Statistics For Year 2001(Based on 2 full and 8 partial tracts) A) FHA, FSA/RHS & VA B) Conventional C) Refinancings D) Home Improvement Loans F) Non-occupant Loans on Number Average Value Number Average Value Number Average Value Number Average Value Number Average Value
LOANS ORIGINATED 12 $186,687 585 $240,078 792 $186,644 90 $53,536 19 $207,076 APPLICATIONS APPROVED, NOT ACCEPTED 2 $201,115 57 $219,368 168 $142,038 73 $49,669 0 $0 APPLICATIONS DENIED 4 $155,908 55 $238,062 268 $167,379 63 $47,536 8 $170,402 APPLICATIONS WITHDRAWN 3 $203,010 57 $236,359 243 $172,330 53 $59,608 2 $519,710 FILES CLOSED FOR INCOMPLETENESS 2 $193,885 25 $255,704 74 $151,684 9 $51,318 0 $0
Aggregated Statistics For Year 2000(Based on 2 full and 8 partial tracts) A) FHA, FSA/RHS & VA B) Conventional C) Refinancings D) Home Improvement Loans E) Loans on Dwellings For 5+ Families F) Non-occupant Loans on Number Average Value Number Average Value Number Average Value Number Average Value Number Average Value Number Average Value
LOANS ORIGINATED 21 $179,448 551 $222,955 246 $130,726 102 $54,924 2 $67,230 14 $172,592 APPLICATIONS APPROVED, NOT ACCEPTED 3 $223,633 71 $249,946 79 $136,942 52 $26,850 0 $0 7 $244,430 APPLICATIONS DENIED 8 $178,704 99 $205,184 158 $152,563 46 $88,413 1 $209,290 10 $127,179 APPLICATIONS WITHDRAWN 4 $172,370 50 $294,584 235 $111,359 31 $73,615 2 $109,015 4 $158,650 FILES CLOSED FOR INCOMPLETENESS 0 $0 20 $282,416 36 $145,874 10 $30,358 0 $0 1 $184,270
Aggregated Statistics For Year 1999(Based on 1 full and 4 partial tracts) A) FHA, FSA/RHS & VA B) Conventional C) Refinancings D) Home Improvement Loans E) Loans on Dwellings For 5+ Families F) Non-occupant Loans on Number Average Value Number Average Value Number Average Value Number Average Value Number Average Value Number Average Value
LOANS ORIGINATED 14 $163,954 258 $201,833 266 $146,337 43 $37,147 1 $243,140 12 $161,406 APPLICATIONS APPROVED, NOT ACCEPTED 1 $109,870 26 $192,949 76 $132,263 12 $37,931 0 $0 3 $193,143 APPLICATIONS DENIED 3 $170,097 37 $182,127 100 $142,423 22 $44,395 0 $0 3 $111,183 APPLICATIONS WITHDRAWN 3 $150,900 25 $225,390 94 $125,988 9 $75,719 0 $0 2 $139,850 FILES CLOSED FOR INCOMPLETENESS 0 $0 8 $182,115 26 $168,620 1 $11,620 0 $0 1 $78,420
Private Mortgage Insurance Companies Aggregated Statistics For Year 2009(Based on 2 full and 8 partial tracts) A) Conventional B) Refinancings Number Average Value Number Average Value
LOANS ORIGINATED 29 $320,258 7 $450,467 APPLICATIONS APPROVED, NOT ACCEPTED 9 $353,502 11 $379,138 APPLICATIONS DENIED 13 $408,444 1 $562,390 APPLICATIONS WITHDRAWN 3 $265,190 2 $300,735 FILES CLOSED FOR INCOMPLETENESS 0 $0 0 $0
Aggregated Statistics For Year 2008(Based on 2 full and 8 partial tracts) A) Conventional B) Refinancings Number Average Value Number Average Value
LOANS ORIGINATED 41 $348,206 17 $356,012 APPLICATIONS APPROVED, NOT ACCEPTED 34 $354,252 13 $339,625 APPLICATIONS DENIED 12 $368,212 8 $310,604 APPLICATIONS WITHDRAWN 2 $436,650 1 $460,680 FILES CLOSED FOR INCOMPLETENESS 0 $0 3 $359,890
Aggregated Statistics For Year 2007(Based on 2 full and 8 partial tracts) A) Conventional B) Refinancings C) Non-occupant Loans on Number Average Value Number Average Value Number Average Value
LOANS ORIGINATED 48 $336,454 15 $381,511 1 $523,500 APPLICATIONS APPROVED, NOT ACCEPTED 11 $315,582 4 $318,890 0 $0 APPLICATIONS DENIED 0 $0 2 $357,125 0 $0 APPLICATIONS WITHDRAWN 1 $523,500 0 $0 1 $523,500 FILES CLOSED FOR INCOMPLETENESS 0 $0 0 $0 0 $0
Aggregated Statistics For Year 2006(Based on 2 full and 8 partial tracts) A) Conventional B) Refinancings Number Average Value Number Average Value
LOANS ORIGINATED 44 $334,244 9 $336,960 APPLICATIONS APPROVED, NOT ACCEPTED 9 $384,948 10 $332,672 APPLICATIONS DENIED 0 $0 0 $0 APPLICATIONS WITHDRAWN 2 $263,145 0 $0 FILES CLOSED FOR INCOMPLETENESS 0 $0 0 $0
Aggregated Statistics For Year 2005(Based on 2 full and 8 partial tracts) A) Conventional B) Refinancings C) Non-occupant Loans on Number Average Value Number Average Value Number Average Value
LOANS ORIGINATED 39 $326,661 10 $359,805 1 $300,480 APPLICATIONS APPROVED, NOT ACCEPTED 23 $364,837 10 $307,466 1 $413,220 APPLICATIONS DENIED 0 $0 0 $0 0 $0 APPLICATIONS WITHDRAWN 4 $324,700 0 $0 0 $0 FILES CLOSED FOR INCOMPLETENESS 0 $0 2 $308,815 0 $0
Aggregated Statistics For Year 2004(Based on 2 full and 8 partial tracts) A) Conventional B) Refinancings C) Non-occupant Loans on Number Average Value Number Average Value Number Average Value
LOANS ORIGINATED 40 $313,094 3 $200,560 0 $0 APPLICATIONS APPROVED, NOT ACCEPTED 25 $324,162 4 $331,508 1 $349,000 APPLICATIONS DENIED 0 $0 0 $0 0 $0 APPLICATIONS WITHDRAWN 4 $256,642 0 $0 0 $0 FILES CLOSED FOR INCOMPLETENESS 0 $0 2 $280,060 0 $0
Aggregated Statistics For Year 2003(Based on 2 full and 8 partial tracts) A) Conventional B) Refinancings C) Non-occupant Loans on Number Average Value Number Average Value Number Average Value
LOANS ORIGINATED 88 $287,801 28 $247,284 3 $317,360 APPLICATIONS APPROVED, NOT ACCEPTED 10 $268,502 5 $234,342 2 $287,580 APPLICATIONS DENIED 0 $0 0 $0 0 $0 APPLICATIONS WITHDRAWN 6 $272,270 9 $247,427 0 $0 FILES CLOSED FOR INCOMPLETENESS 0 $0 2 $549,670 0 $0
Aggregated Statistics For Year 2002(Based on 2 full and 8 partial tracts) A) Conventional B) Refinancings C) Non-occupant Loans on Number Average Value Number Average Value Number Average Value
LOANS ORIGINATED 119 $254,758 50 $245,057 2 $199,240 APPLICATIONS APPROVED, NOT ACCEPTED 49 $252,516 16 $237,374 0 $0 APPLICATIONS DENIED 8 $194,429 2 $118,930 1 $194,040 APPLICATIONS WITHDRAWN 10 $263,557 2 $217,095 4 $228,042 FILES CLOSED FOR INCOMPLETENESS 1 $311,310 1 $321,530 0 $0
Aggregated Statistics For Year 2001(Based on 2 full and 8 partial tracts) A) Conventional B) Refinancings C) Non-occupant Loans on Number Average Value Number Average Value Number Average Value
LOANS ORIGINATED 137 $224,662 47 $220,857 9 $191,328 APPLICATIONS APPROVED, NOT ACCEPTED 37 $222,494 4 $165,405 3 $190,093 APPLICATIONS DENIED 2 $179,500 0 $0 2 $179,500 APPLICATIONS WITHDRAWN 2 $198,880 5 $154,964 0 $0 FILES CLOSED FOR INCOMPLETENESS 1 $209,400 0 $0 1 $209,400
Aggregated Statistics For Year 2000(Based on 2 full and 8 partial tracts) A) Conventional B) Refinancings C) Non-occupant Loans on Number Average Value Number Average Value Number Average Value
LOANS ORIGINATED 120 $218,349 13 $197,442 4 $160,705 APPLICATIONS APPROVED, NOT ACCEPTED 12 $220,741 1 $382,500 0 $0 APPLICATIONS DENIED 4 $229,175 0 $0 0 $0 APPLICATIONS WITHDRAWN 4 $127,812 2 $182,320 0 $0 FILES CLOSED FOR INCOMPLETENESS 1 $235,920 0 $0 0 $0
Aggregated Statistics For Year 1999(Based on 1 full and 4 partial tracts) A) Conventional B) Refinancings Number Average Value Number Average Value
LOANS ORIGINATED 77 $189,916 21 $173,593 APPLICATIONS APPROVED, NOT ACCEPTED 9 $184,608 6 $198,153 APPLICATIONS DENIED 6 $159,468 0 $0 APPLICATIONS WITHDRAWN 0 $0 2 $303,610 FILES CLOSED FOR INCOMPLETENESS 2 $154,525 3 $201,323
2002 - 2018 National Fire Incident Reporting System (NFIRS) incidents See full 2006 National Fire Incident Reporting System statistics for zip code 10567, New York
Most common first names in zip code 10567 among deceased individuals Name Count Lived (average)
John 32 81.7 years Mary 25 82.8 years Robert 23 73.8 years Joseph 20 83.0 years George 19 79.0 years James 18 75.4 years William 16 75.7 years Anna 16 90.4 years Helen 15 86.2 years Edward 12 74.5 years
Most common last names in zip code 10567 among deceased individuals Last name Count Lived (average)
Brown 8 82.6 years Smith 7 81.6 years Kelly 5 67.2 years Gilbert 5 82.0 years Lent 4 81.2 years Miller 4 84.7 years Johnson 3 65.7 years Roberts 3 83.3 years Anzovino 3 74.3 years Koch 3 86.4 years
Businesses in zip code 10567
Name Count Name Count
7-Eleven 1 Kohl's 1 Domino's Pizza 1 MasterBrand Cabinets 4 Dunkin Donuts 2 Subaru 1 FedEx 1 Toyota 1 H&R Block 1 UPS 1 Hyundai 1
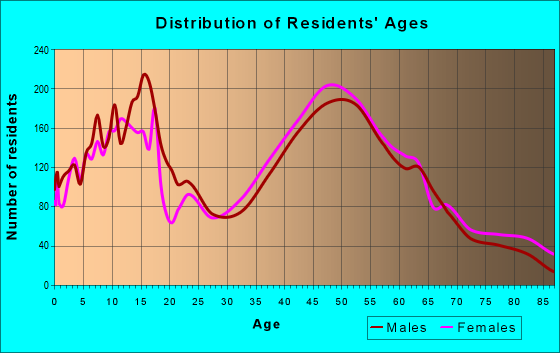
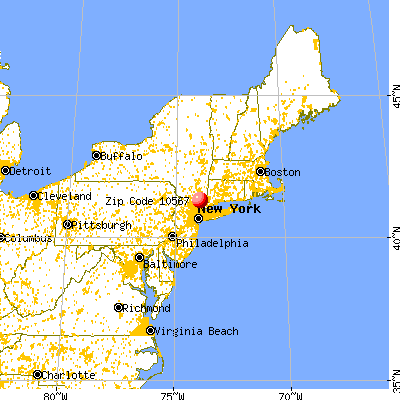


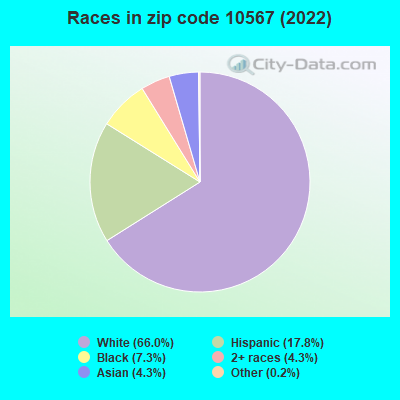


 Nearest zip codes: 10566, 10517, 10511, 10537, 10547, 10548.
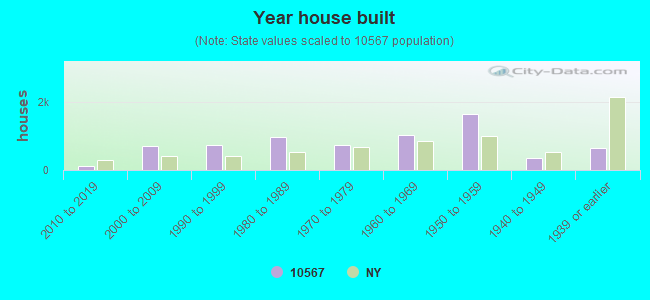
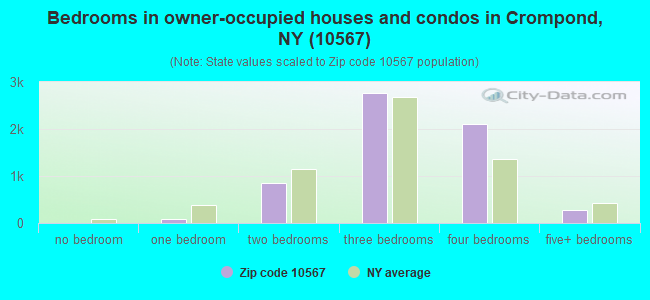
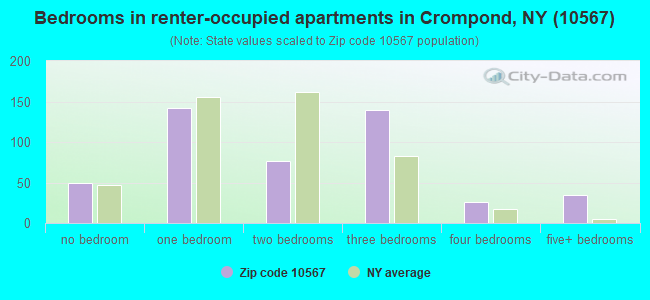
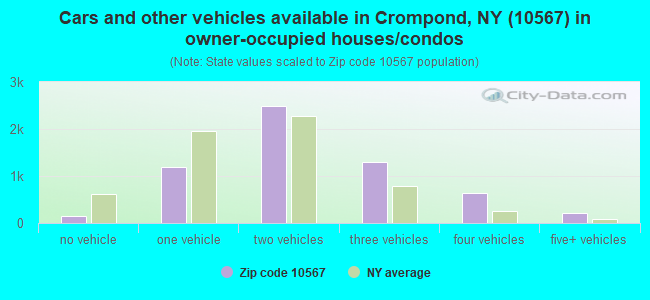
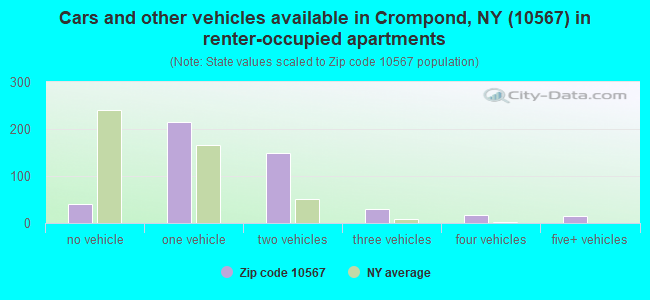


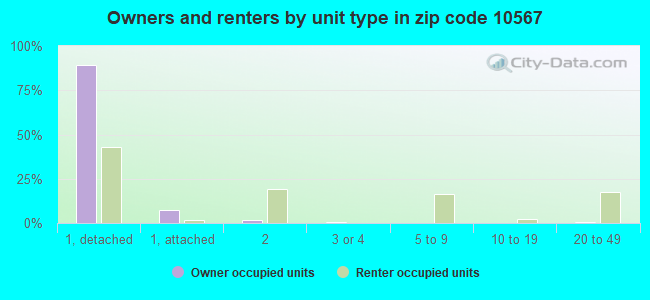
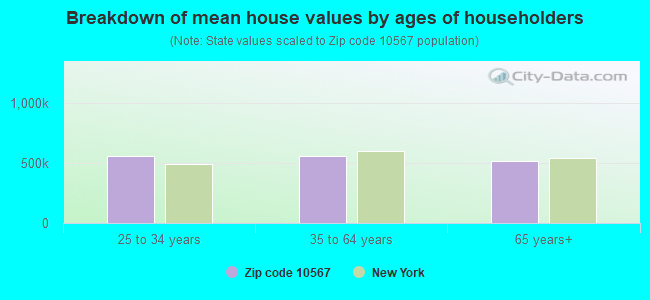


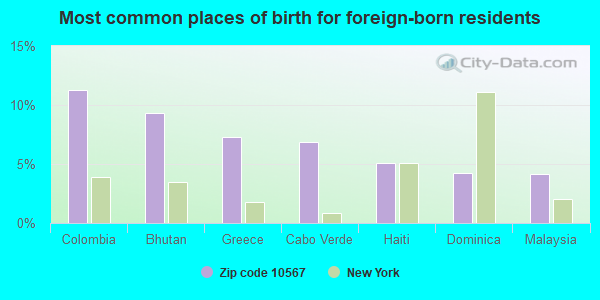
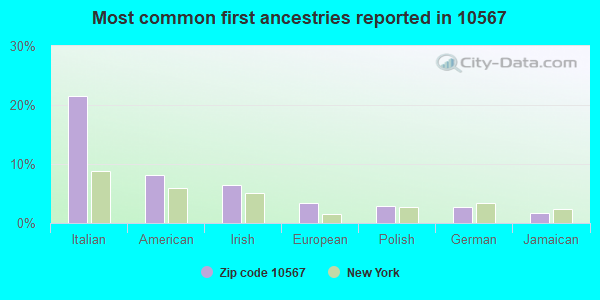
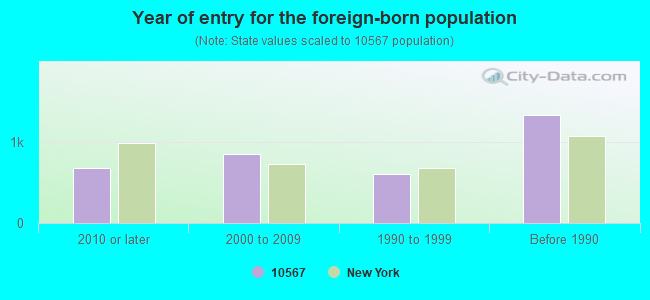
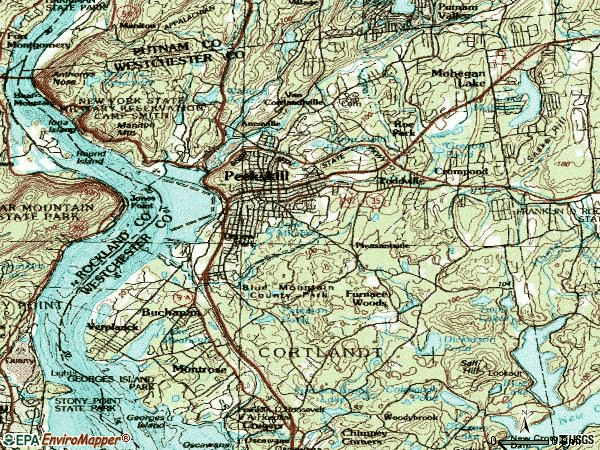


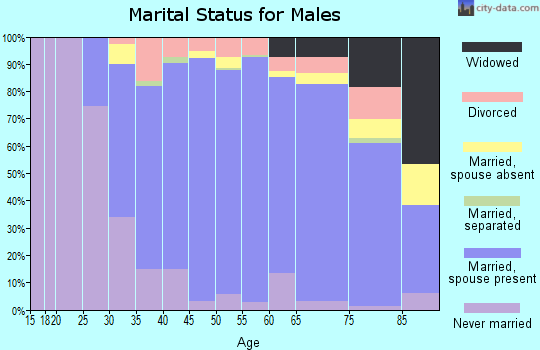
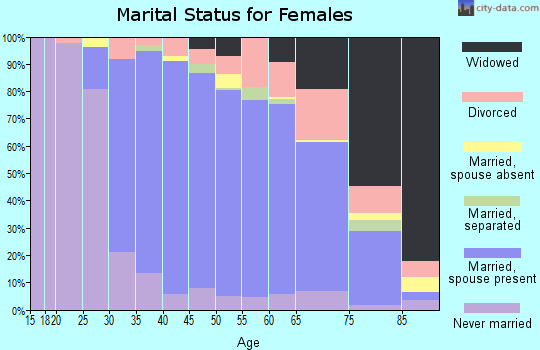
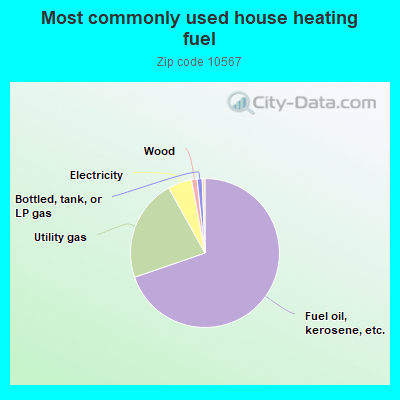

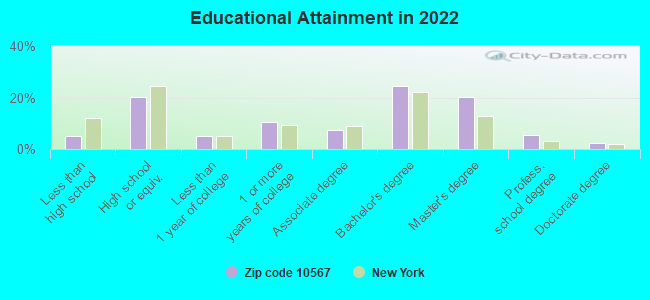
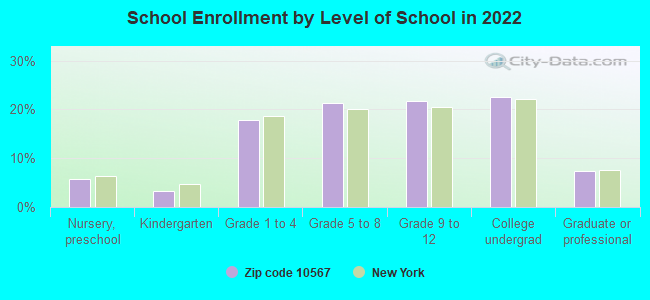
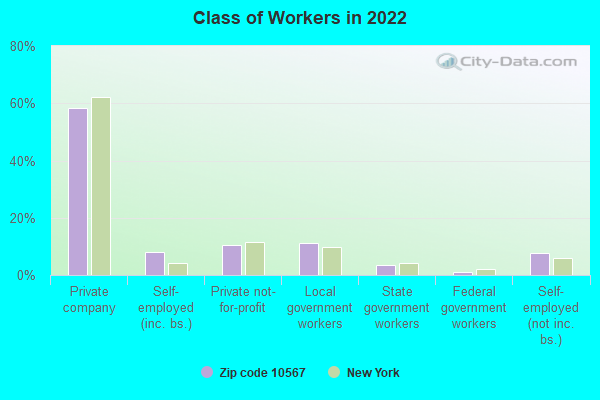
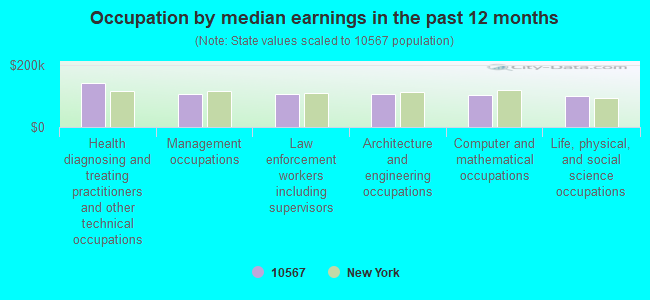
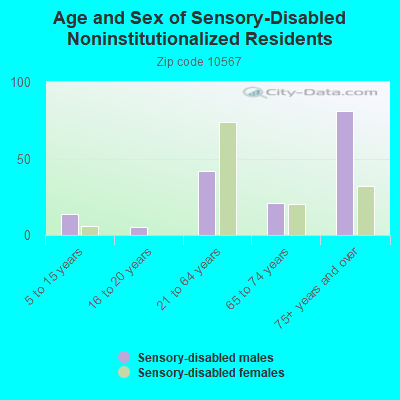
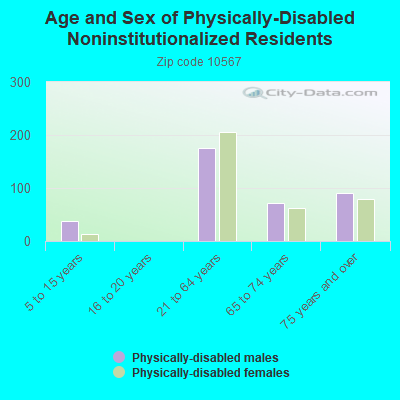
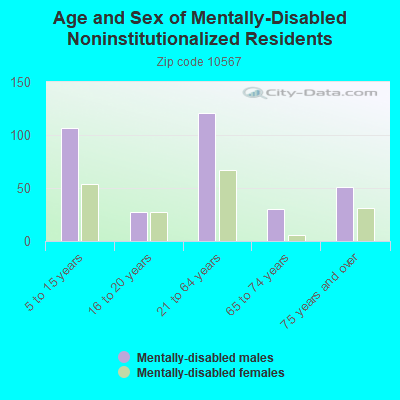
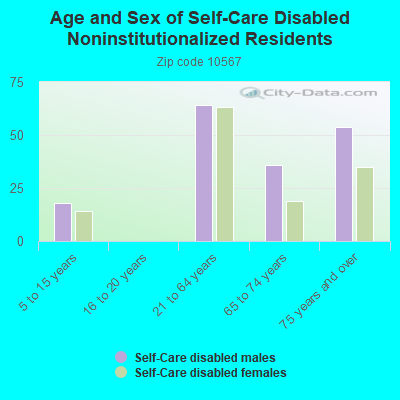
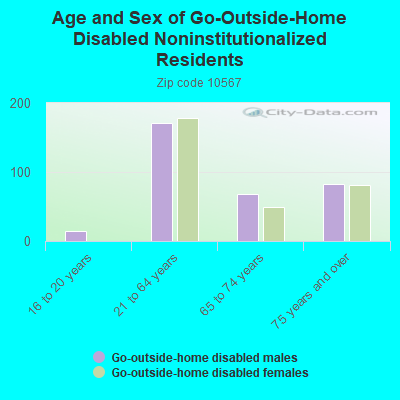
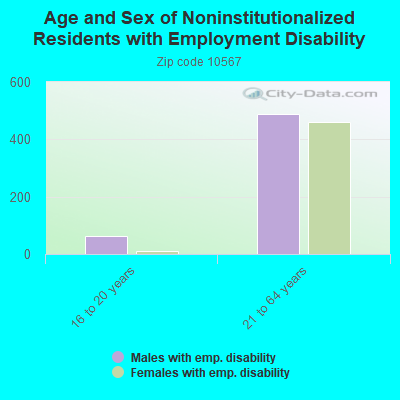
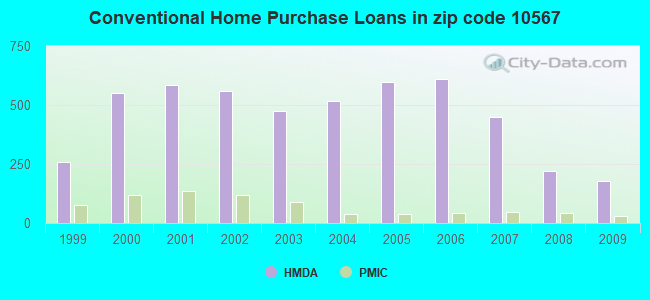
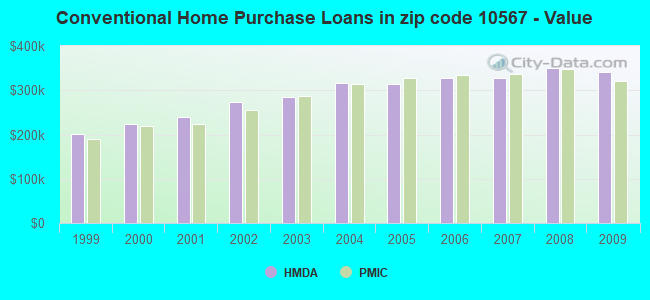
 According to the data from the years 2002 - 2018 the average number of fires per year is 56. The highest number of reported fire incidents - 86 took place in 2007, and the least - 27 in 2002. The data has a growing trend.
 When looking into fire subcategories, the most incidents belonged to: Structure Fires (51.7%), and Outside Fires (31.1%).