Estimated zip code population in 2022: 5,476 Zip code population in 2010: 5,117 Zip code population in 2000: 5,460
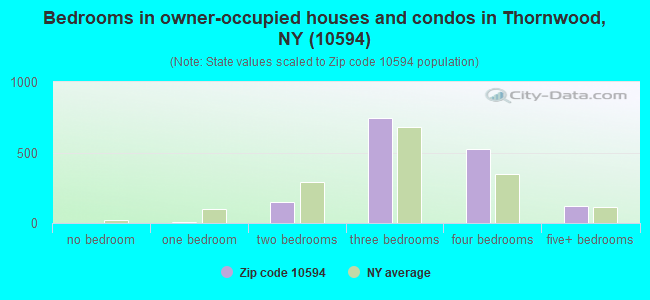
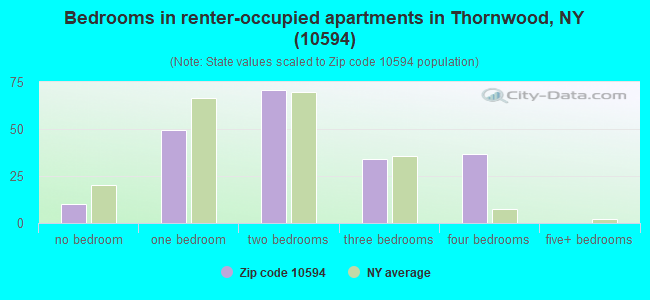
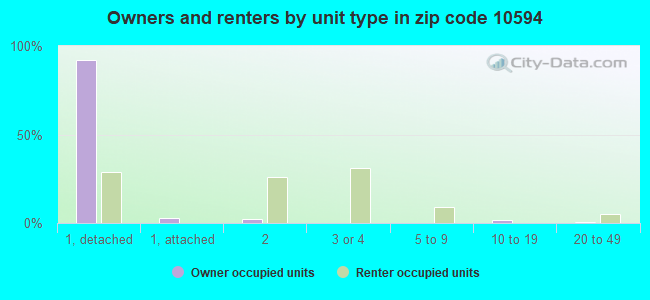
Houses and condos: 1,770 Renter-occupied apartments: 203
% of renters here:
12%
State:
46%
March 2022 cost of living index in zip code 10594: 147.2 (very high, U.S. average is 100)
Land area: 2.5 sq. mi. Water area: 0.0 sq. mi.
Population density: 2,186 people per square mile
(low).
OSM Map
General Map
Google Map
MSN Map
OSM Map
General Map
Google Map
MSN Map
OSM Map
General Map
Google Map
MSN Map
OSM Map
General Map
Google Map
MSN Map
Please wait while loading the map...
Real estate property taxes paid for housing units in 2022:
This zip code:
1.4% ($9,805)
New York:
1.5% ($6,180)
Median real estate property taxes paid for housing units with mortgages in 2022: $9,858 (1.3%) Median real estate property taxes paid for housing units with no mortgage in 2022: $9,755 (1.4%)
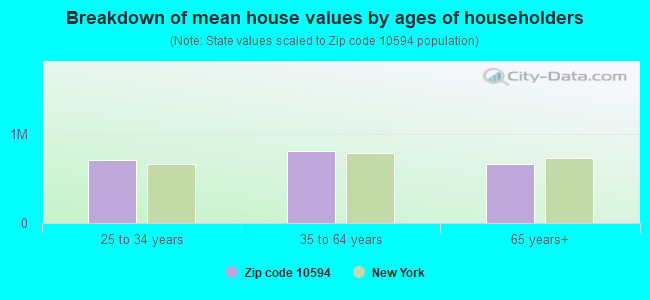
Estimated median house/condo value in 2022: $723,034
10594:
$723,034
New York:
$400,400
According to our research of New York and other state lists, there was 1 registered sex offender living in 10594 zip code as of May 28, 2024. The ratio of all residents to sex offenders in zip code 10594 is 5,148 to 1. The ratio of registered sex offenders to all residents in this zip code is much lower than the state average.
Median resident age:
This zip code:
40.5 years
New York median age:
40.0 years
Average household size:
This zip code:
3.0 people
New York:
2.5 people
Averages for the 2020 tax year for zip code 10594, filed in 2021:
Average Adjusted Gross Income (AGI) in 2020: $135,809 (Individual Income Tax Returns)
Here:
$135,809
State:
$90,930
Salary/wage: $113,043 (reported on 81.1% of returns)
Here:
$113,043
State:
$72,104
(% of AGI for various income ranges: 1237.5% for AGIs below $25k, 4015.7% for AGIs $25k-50k, 7411.0% for AGIs $50k-75k, 10991.4% for AGIs $75k-100k, 19274.2% for AGIs $100k-200k, 96636.4% for AGIs over 200k)
Taxable interest for individuals: $2,082 (reported on 54.3% of returns)
This zip code:
$2,082
New York:
$3,075
(% of AGI for various income ranges: 32.5% for AGIs below $25k, 99.1% for AGIs $25k-50k, 106.7% for AGIs $50k-75k, 145.0% for AGIs $75k-100k, 224.2% for AGIs $100k-200k, 1070.7% for AGIs over 200k)
Ordinary dividends: $6,917 (reported on 39.2% of returns)
Here:
$6,917
State:
$11,095
(% of AGI for various income ranges: 51.2% for AGIs below $25k, 148.7% for AGIs $25k-50k, 220.0% for AGIs $50k-75k, 308.6% for AGIs $75k-100k, 450.3% for AGIs $100k-200k, 3077.1% for AGIs over 200k)
Net capital gain/loss in AGI: +$21,592 (reported on 35.1% of returns)
Here:
+$21,592
State:
+$44,925
(% of AGI for various income ranges: 25.0% for AGIs below $25k, 71.7% for AGIs $25k-50k, 153.8% for AGIs $50k-75k, 290.0% for AGIs $75k-100k, 453.3% for AGIs $100k-200k, 12579.3% for AGIs over 200k)
Profit/loss from business: +$18,054 (reported on 15.5% of returns)
Here:
+$18,054
State:
+$14,940
(% of AGI for various income ranges: 155.9% for AGIs below $25k, 286.1% for AGIs $25k-50k, 264.8% for AGIs $50k-75k, 213.6% for AGIs $75k-100k, 441.8% for AGIs $100k-200k, 2808.6% for AGIs over 200k)
Taxable individual retirement arrangement distribution: $22,286 (reported on 10.6% of returns)
10594:
$22,286
New York:
$19,609
(% of AGI for various income ranges: 60.6% for AGIs below $25k, 137.4% for AGIs $25k-50k, 238.6% for AGIs $50k-75k, 370.0% for AGIs $75k-100k, 673.3% for AGIs $100k-200k, 1777.9% for AGIs over 200k)
Self-employed (Keogh) retirement plans: $23,767 (reported on 1.1% of returns)
10594:
$23,767
New York:
$32,497
(% of AGI for various income ranges: 509.3% for AGIs over 200k)
Total itemized deductions: $31,990 (reported on 22.3% of returns)
Here:
$31,990
State:
$39,326
(% of AGI for various income ranges: 483.9% for AGIs $25k-50k, 625.2% for AGIs $50k-75k, 839.3% for AGIs $75k-100k, 1585.5% for AGIs $100k-200k, 7172.1% for AGIs over 200k)
Charity contributions: $6,100 (reported on 20.4% of returns)
Here:
$6,100
State:
$15,420
(% of AGI for various income ranges: 23.5% for AGIs $25k-50k, 66.7% for AGIs $50k-75k, 64.3% for AGIs $75k-100k, 197.9% for AGIs $100k-200k, 1683.6% for AGIs over 200k)
Taxes paid: $9,759 (reported on 21.9% of returns)
10594:
$9,759
State:
$9,183
(% of AGI for various income ranges: 164.3% for AGIs $25k-50k, 193.8% for AGIs $50k-75k, 304.3% for AGIs $75k-100k, 549.4% for AGIs $100k-200k, 1882.9% for AGIs over 200k)
Earned income credit: $1,692 (reported on 4.5% of returns)
Here:
$1,692
State:
$2,138
(% of AGI for various income ranges: 37.5% for AGIs below $25k, 36.1% for AGIs $25k-50k)
Percentage of individuals using paid preparers for their 2020 taxes: 94.0%
Here:
94%
State:
95%
(% for various income ranges: 91.8% for AGIs below $25k, 94.4% for AGIs $25k-50k, 94.1% for AGIs $50k-75k, 92.0% for AGIs $75k-100k, 93.4% for AGIs $100k-200k, 97.9% for AGIs over 200k)
Averages for the 2012 tax year for zip code 10594, filed in 2013:
Average Adjusted Gross Income (AGI) in 2012: $117,567 (Individual Income Tax Returns)
Here:
$117,567
State:
$77,088
Salary/wage: $93,063 (reported on 79.8% of returns)
Here:
$93,063
State:
$60,593
(% of AGI for various income ranges: 66.6% for AGIs below $25k, 74.0% for AGIs $25k-50k, 67.4% for AGIs $50k-75k, 66.4% for AGIs $75k-100k, 77.7% for AGIs $100k-200k, 53.2% for AGIs over 200k)
Taxable interest for individuals: $1,744 (reported on 59.1% of returns)
This zip code:
$1,744
New York:
$3,125
(% of AGI for various income ranges: 2.6% for AGIs below $25k, 1.7% for AGIs $25k-50k, 1.2% for AGIs $50k-75k, 1.2% for AGIs $75k-100k, 0.8% for AGIs $100k-200k, 0.7% for AGIs over 200k)
Ordinary dividends: $4,931 (reported on 41.7% of returns)
Here:
$4,931
State:
$10,299
(% of AGI for various income ranges: 5.8% for AGIs below $25k, 2.6% for AGIs $25k-50k, 2.5% for AGIs $50k-75k, 1.9% for AGIs $75k-100k, 1.4% for AGIs $100k-200k, 1.5% for AGIs over 200k)
Net capital gain/loss in AGI: +$6,119 (reported on 34.1% of returns)
Here:
+$6,119
State:
+$42,474
(% of AGI for various income ranges: 0.1% for AGIs $50k-75k, 0.6% for AGIs $100k-200k, 3.2% for AGIs over 200k)
Profit/loss from business: +$19,305 (reported on 16.3% of returns)
Here:
+$19,305
State:
+$16,168
(% of AGI for various income ranges: 8.9% for AGIs below $25k, 3.5% for AGIs $25k-50k, 5.1% for AGIs $50k-75k, 2.6% for AGIs $75k-100k, 3.0% for AGIs $100k-200k, 1.8% for AGIs over 200k)
Taxable individual retirement arrangement distribution: $16,832 (reported on 13.5% of returns)
10594:
$16,832
New York:
$17,621
(% of AGI for various income ranges: 3.8% for AGIs below $25k, 2.9% for AGIs $25k-50k, 3.3% for AGIs $50k-75k, 3.0% for AGIs $75k-100k, 2.4% for AGIs $100k-200k, 1.2% for AGIs over 200k)
Self-employment retirement plans: $26,225 (reported on 1.6% of returns)
10594:
$26,225
New York:
$27,330
Total itemized deductions: $37,145 (20% of AGI, reported on 56.7% of returns)
Here:
$37,145
State:
$34,985
Here:
20.2% of AGI
State:
21.3% of AGI
(% of AGI for various income ranges: 34.2% for AGIs below $25k, 21.2% for AGIs $25k-50k, 20.8% for AGIs $50k-75k, 23.9% for AGIs $75k-100k, 23.0% for AGIs $100k-200k, 12.9% for AGIs over 200k)
Charity contributions: $3,525 (reported on 51.6% of returns)
Here:
$3,525
State:
$5,572
(% of AGI for various income ranges: 1.4% for AGIs below $25k, 1.0% for AGIs $25k-50k, 1.7% for AGIs $50k-75k, 1.8% for AGIs $75k-100k, 1.7% for AGIs $100k-200k, 1.5% for AGIs over 200k)
Taxes paid: $21,453 (reported on 56.7% of returns)
10594:
$21,453
State:
$18,656
(% of AGI for various income ranges: 14.4% for AGIs below $25k, 10.9% for AGIs $25k-50k, 9.7% for AGIs $50k-75k, 13.0% for AGIs $75k-100k, 12.7% for AGIs $100k-200k, 8.6% for AGIs over 200k)
Earned income credit: $1,664 (reported on 4.4% of returns)
Here:
$1,664
State:
$2,230
(% of AGI for various income ranges: 2.1% for AGIs below $25k, 0.2% for AGIs $25k-50k)
Percentage of individuals using paid preparers for their 2012 taxes: 71.0%
Here:
71%
State:
66%
(% for various income ranges: 68.6% for AGIs below $25k, 65.0% for AGIs $25k-50k, 71.0% for AGIs $50k-75k, 76.0% for AGIs $75k-100k, 71.9% for AGIs $100k-200k, 79.3% for AGIs over 200k)
Averages for the 2004 tax year for zip code 10594, filed in 2005:
Average Adjusted Gross Income (AGI) in 2004: $80,274 (Individual Income Tax Returns)
Here:
$80,274
State:
$59,519
Salary/wage: $72,467 (reported on 81.9% of returns)
Here:
$72,467
State:
$50,673
(% of AGI for various income ranges: 100.2% for AGIs below $10k, 68.9% for AGIs $10k-25k, 77.0% for AGIs $25k-50k, 70.2% for AGIs $50k-75k, 74.5% for AGIs $75k-100k, 74.0% for AGIs over 100k)
Taxable interest for individuals: $2,042 (reported on 69.9% of returns)
This zip code:
$2,042
New York:
$2,377
(% of AGI for various income ranges: 13.9% for AGIs below $10k, 3.1% for AGIs $10k-25k, 2.7% for AGIs $25k-50k, 2.2% for AGIs $50k-75k, 1.7% for AGIs $75k-100k, 1.4% for AGIs over 100k)
Taxable dividends: $3,295 (reported on 47.0% of returns)
Here:
$3,295
State:
$5,394
(% of AGI for various income ranges: 10.2% for AGIs below $10k, 2.9% for AGIs $10k-25k, 1.9% for AGIs $25k-50k, 1.8% for AGIs $50k-75k, 1.6% for AGIs $75k-100k, 1.9% for AGIs over 100k)
Net capital gain/loss: +$4,422 (reported on 39.7% of returns)
Here:
+$4,422
State:
+$23,581
(% of AGI for various income ranges: -8.5% for AGIs below $10k, -0.3% for AGIs $10k-25k, -0.0% for AGIs $25k-50k, 0.9% for AGIs $50k-75k, 0.2% for AGIs $75k-100k, 3.3% for AGIs over 100k)
Profit/loss from business: +$20,343 (reported on 14.8% of returns)
Here:
+$20,343
State:
+$13,809
(% of AGI for various income ranges: 11.3% for AGIs below $10k, 7.3% for AGIs $10k-25k, 4.6% for AGIs $25k-50k, 4.1% for AGIs $50k-75k, 4.3% for AGIs $75k-100k, 3.3% for AGIs over 100k)
IRA payment deduction: $3,631 (reported on 4.2% of returns)
10594:
$3,631
New York:
$3,115
(% of AGI for various income ranges: 0.6% for AGIs $25k-50k, 0.4% for AGIs $50k-75k, 0.2% for AGIs $75k-100k, 0.1% for AGIs over 100k)
Self-employed pension: $17,000 (reported on 2.2% of returns)
Here:
$17,000
New York:
$19,016
Total itemized deductions: $28,547 (23% of AGI, reported on 56.9% of returns)
Here:
$28,547
State:
$25,864
Here:
23.1% of AGI
State:
21.9% of AGI
(% of AGI for various income ranges: 21.2% for AGIs below $10k, 20.9% for AGIs $10k-25k, 19.7% for AGIs $25k-50k, 24.1% for AGIs $50k-75k, 25.9% for AGIs $75k-100k, 18.7% for AGIs over 100k)
Charity contributions deductions: $3,067 (2% of AGI, reported on 54.2% of returns)
Here:
$3,067
State:
$4,439
Here:
2.4% of AGI
State:
3.6% of AGI
(% of AGI for various income ranges: 1.1% for AGIs below $10k, 1.5% for AGIs $10k-25k, 1.8% for AGIs $25k-50k, 2.5% for AGIs $50k-75k, 2.4% for AGIs $75k-100k, 2.0% for AGIs over 100k)
Total tax: $14,821 (reported on 82.8% of returns)
10594:
$14,821
State:
$11,730
(% of AGI for various income ranges: 4.1% for AGIs below $10k, 4.7% for AGIs $10k-25k, 7.9% for AGIs $25k-50k, 9.3% for AGIs $50k-75k, 9.6% for AGIs $75k-100k, 18.9% for AGIs over 100k)
Earned income credit: $1,120 (reported on 3.4% of returns)
Here:
$1,120
State:
$1,757
Percentage of individuals using paid preparers for their 2004 taxes: 69.7%
Here:
70%
State:
67%
(% for various income ranges: 64.1% for AGIs below $10k, 69.0% for AGIs $10k-25k, 66.9% for AGIs $25k-50k, 72.2% for AGIs $50k-75k, 73.2% for AGIs $75k-100k, 73.2% for AGIs over 100k)
Household received Food Stamps/SNAP in the past 12 months: 64 Household did not receive Food Stamps/SNAP in the past 12 months: 1,671
Women who had a birth in the past 12 months: 23 (23 now married, 0 unmarried) Women who did not have a birth in the past 12 months: 1,048 (526 now married, 514 unmarried)
Housing units in zip code 10594 with a mortgage: 932 (141 second mortgage, 136 both second mortgage and home equity loan) Houses without a mortgage: 60
Median monthly owner costs for units with a mortgage: $3,860 Median monthly owner costs for units without a mortgage: $1,487
Residents with income below the poverty level in 2022:
This zip code:
5.2%
Whole state:
14.3%
Residents with income below 50% of the poverty level in 2022:
This zip code:
3.9%
Whole state:
6.8%
Median number of rooms in houses and condos:
Here:
7.1
State:
6.3
Median number of rooms in apartments:
Here:
4.2
State:
3.8
Notable locations in this zip code not listed on our city pages
In group quarters: 192 (-1 institutionalized population)
Size of family households: 452 2-persons, 259 3-persons, 498 4-persons, 123 5-persons, 18 6-persons, 30 7-or-more-persons
Size of nonfamily households: 277 1-person, 66 2-persons, 12 4-persons
1,123 married couples with children.
17 single-parent households (17 women).
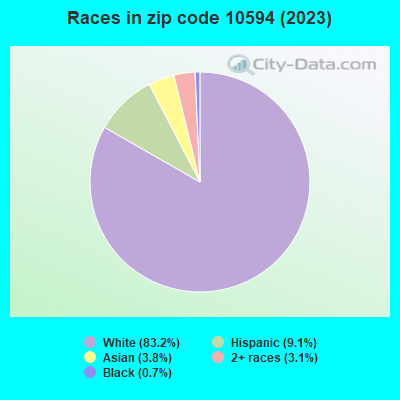
79.1% of residents of 10594 zip code speak English at home.
6.6% of residents speak Spanish at home (72% very well, 22% well, 7% not well).
9.3% of residents speak other Indo-European language at home (81% very well, 8% well, 11% not well).
4.7% of residents speak Asian or Pacific Island language at home (88% very well, 8% well, 3% not well).
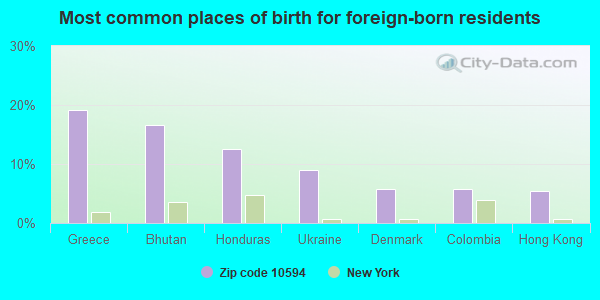
Foreign born population: 696 (12.7%) (79.3% of them are naturalized citizens)
This zip code:
12.7%
Whole state:
22.7%
19%Greece
17%Bhutan
13%Honduras
9%Ukraine
6%Denmark
6%Colombia
5%Hong Kong
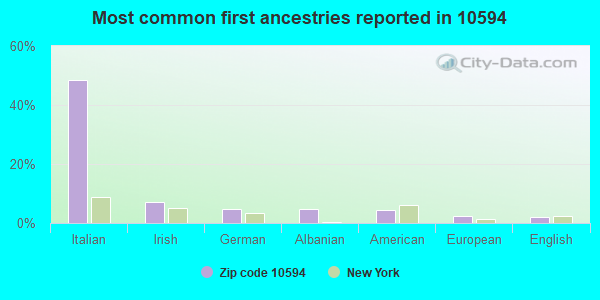
48%Italian
7%Irish
5%German
5%Albanian
5%American
2%European
2%English
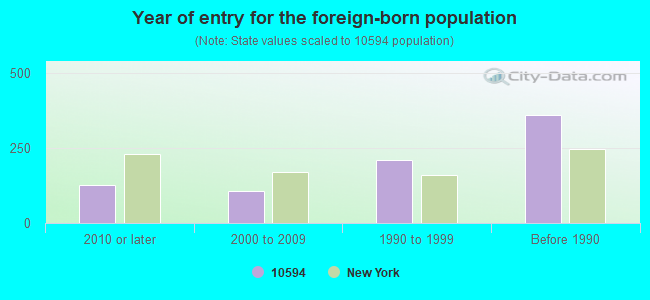
Year of entry for the foreign-born population
1272010 or later
1062000 to 2009
2101990 to 1999
359Before 1990
Facilities with environmental interests located in this zip code:
A & G AUTO BODY (10 WALNUT PL in THORNWOOD, NY)
STATE MASTER (New York facility tracking) - AIR PROGRAM, HAZARDOUS WASTE PROGRAM Small Quantity Generators, between 100 kg and 1000 kg of hazardous waste/month (Resource Conservation and Recovery Act (tracking hazardous waste)) - notification Organizations: ACQUAVIVA & GIULIANO AUTO BODY INC (CONTACT/OWNER)
COLUMBUS ES ( in THORNWOOD, NY)
(National Center for Education Statistics) - STATE ID-660801060005 Organizations: MT PLEASANT CSD (SCHOOL DISTRICT)
A & A TRANS (BROADWAY PO BOX 202 in THORNWOOD, NY)
(Resource Conservation and Recovery Act (tracking hazardous waste))
IBM CORP - CORPORATE TECH INSTITUTE (500 COLUMBUS AVE in THORNWOOD, NY)
(Resource Conservation and Recovery Act (tracking hazardous waste))
Housing units lacking complete kitchen facilities: 0.5%
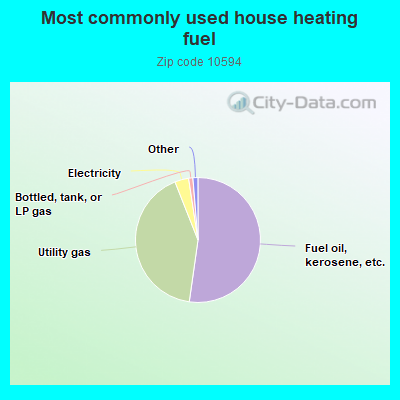
52.4%Fuel oil, kerosene, etc.
42.1%Utility gas
2.7%Electricity
1.6%Bottled, tank, or LP gas
1.3%Wood
Population in 1990: 5,455. Population change in the 1990s: +5 (+0.1%).
Place of birth for U.S.-born residents:
This state: 3,831
Northeast: 659
Midwest: 64
South: 44
West: 43
68% of the 10594 zip code residents lived in the same house 5 years ago. Out of people who lived in different houses, 59% lived in this county. Out of people who lived in different counties, 50% lived in New York.
95% of the 10594 zip code residents lived in the same house 1 year ago. Out of people who lived in different houses, 60% moved from this county. Out of people who lived in different houses, 11% moved from different county within same state. Out of people who lived in different houses, 16% moved from different state. Out of people who lived in different houses, 11% moved from abroad.
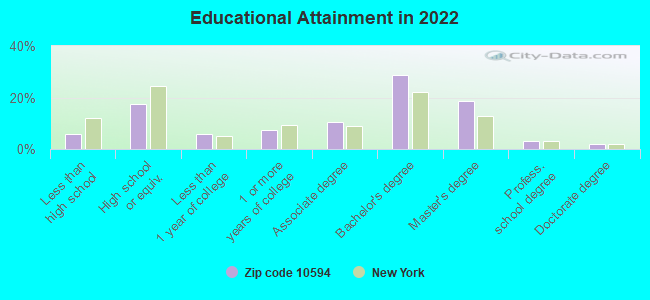
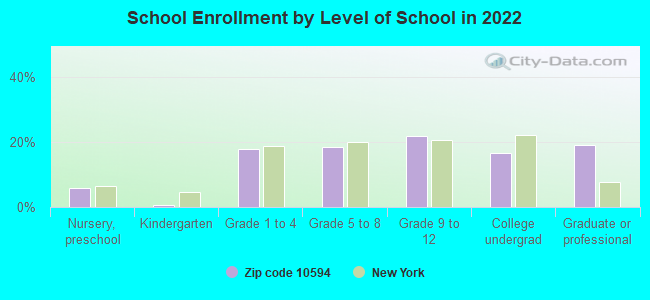
Private vs. public school enrollment:
Students in private schools in grades 1 to 8 (elementary and middle school): 38
Here:
8.6%
New York:
15.6%
Students in private schools in grades 9 to 12 (high school): 80
Here:
30.1%
New York:
15.0%
Students in private undergraduate colleges: 45
Here:
22.7%
New York:
39.2%
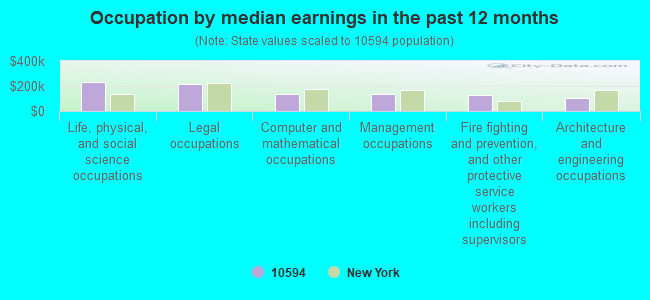
Occupation by median earnings in the past 12 months ($)
234,607Life, physical, and social science occupations
213,269Legal occupations
139,365Computer and mathematical occupations
135,247Management occupations
129,219Fire fighting and prevention, and other protective service workers including supervisors
103,936Architecture and engineering occupations
Companies with federal contracts located in this zip code:
FENBAR PRECISION MACHINIST INC (633 COMMERCE ST in THORNWOOD, NY; small business) : $411,441 in 58 contractsfrom 2001 to 2006
Contracts for Bearings, Plain, Unmounted, Gas Turbines and Jet Engines, Aircraft; Prime Moving, and Components, Nails, Machine Keys, and Pins, Electrical Hardware and Supplies, and moreby Defense Logistics Agency, Navy, Army, Air Force, and others Signed by year:2000: $0; 2001: $65,718; 2002: $0; 2003: $0; 2004: $49,088; 2005: $230,733; 2006: $65,902.
Biggest contracts:
$65,718 with Defense Logistics Agency for Bearings, Plain, Unmounted. Signed on 2001-06-13. Completion date: 2001-09-21.
$34,968 with Defense Logistics Agency for Gas Turbines and Jet Engines, Aircraft; Prime Moving, and Components. Signed on 2005-09-30. Completion date: 2006-06-27.
$30,877 with Defense Logistics Agency for Nails, Machine Keys, and Pins. Signed on 2004-02-13. Completion date: 2004-04-13.
$25,399 with Defense Logistics Agency for Electrical Hardware and Supplies. Signed on 2005-12-02. Completion date: 2006-02-15.
Top industries in this zip code by the number of employees in 2005:
Wholesale Trade: Other Professional Equipment and Supplies Merchant Wholesalers (100-249 employees: 1 establishment, 50-99 employees: 1 establishment)
Wholesale Trade: Medical, Dental, and Hospital Equipment and Supplies Merchant Wholesalers (100-249: 1, 1-4: 1)
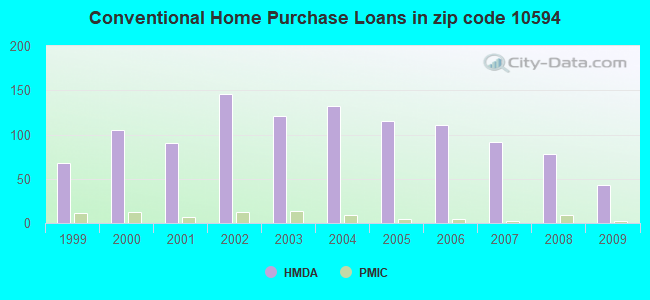
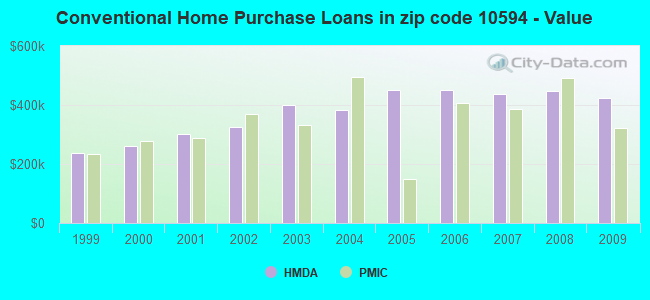
Detailed PMIC statistics for the following Tracts:0121.01
, 0121.02
2002 - 2018 National Fire Incident Reporting System (NFIRS) incidents
According to the data from the years 2002 - 2018 the average number of fire incidents per year is 24. The highest number of reported fire incidents - 47 took place in 2010, and the least - 0 in 2004. The data has an increasing trend.
When looking into fire subcategories, the most incidents belonged to: Structure Fires (65.9%), and Outside Fires (21.2%).
Fire incident types reported to NFIRS in Zip Code 10594

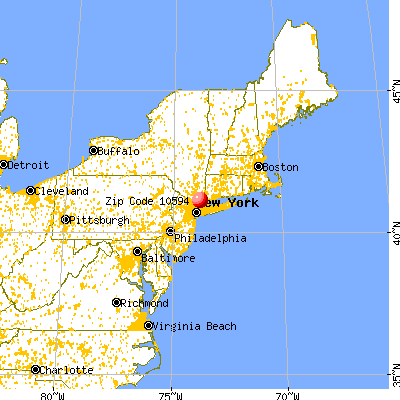


 Nearest zip codes: 10570, 10595, 10532, 10604, 10514, 10603.
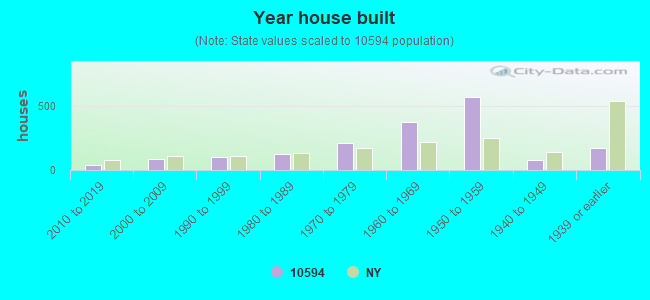


 According to the data from the years 2002 - 2018 the average number of fire incidents per year is 24. The highest number of reported fire incidents - 47 took place in 2010, and the least - 0 in 2004. The data has an increasing trend.
 When looking into fire subcategories, the most incidents belonged to: Structure Fires (65.9%), and Outside Fires (21.2%).