Estimated zip code population in 2022: 2,350 Zip code population in 2010: 2,126 Zip code population in 2000: 1,887
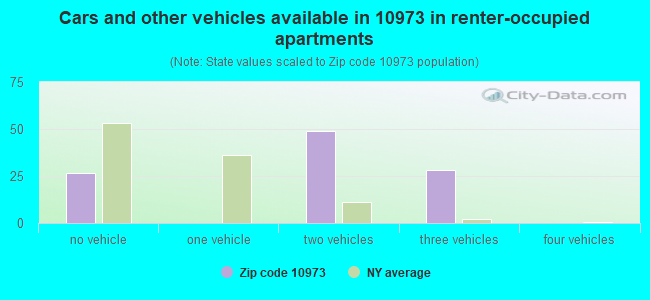
Houses and condos: 876 Renter-occupied apartments: 106
% of renters here:
13%
State:
46%
March 2022 cost of living index in zip code 10973: 116.4 (more than average, U.S. average is 100)
Land area: 8.4 sq. mi. Water area: 0.1 sq. mi.
Population density: 280 people per square mile
(very low).
OSM Map
General Map
Google Map
MSN Map
OSM Map
General Map
Google Map
MSN Map
OSM Map
General Map
Google Map
MSN Map
OSM Map
General Map
Google Map
MSN Map
Please wait while loading the map...
Real estate property taxes paid for housing units in 2022:
This zip code:
2.1% ($8,305)
New York:
1.5% ($6,180)
Median real estate property taxes paid for housing units with mortgages in 2022: $7,366 (2.0%) Median real estate property taxes paid for housing units with no mortgage in 2022: $9,755 (2.2%)
Business Search- 14 Million verified businesses
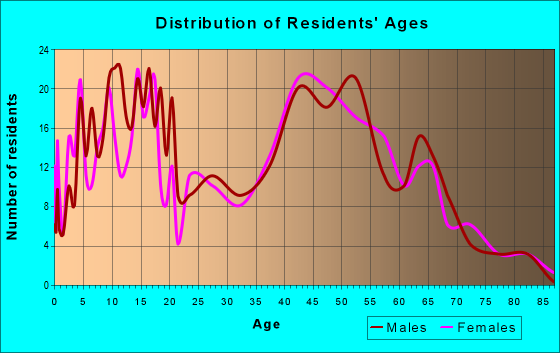
Males: 1,251
(53.2%)
Females: 1,098
(46.8%)
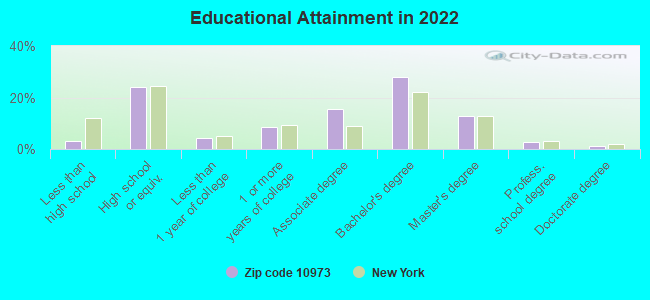
For population 25 years and over in 10973:
High school or higher: 97.1%
Bachelor's degree or higher: 44.5%
Graduate or professional degree: 16.7%
Unemployed: 8.3%
Mean travel time to work (commute): 35.5 minutes
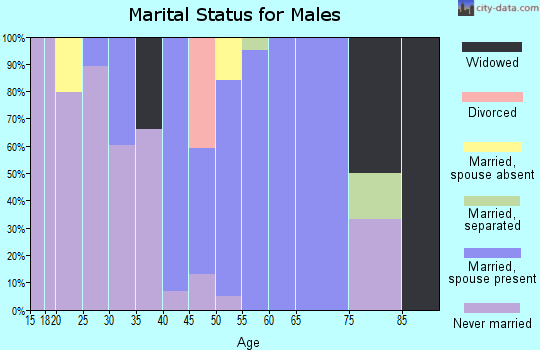
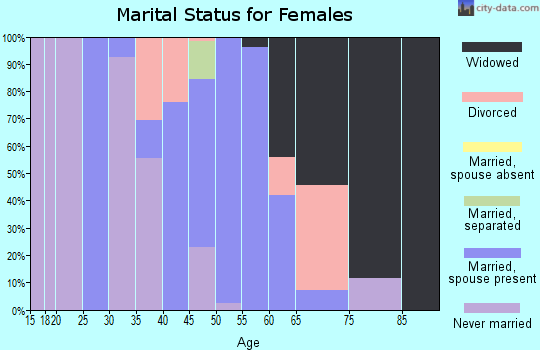
For population 15 years and over in 10973:
Never married: 32.7%
Now married: 58.8%
Separated: 2.3%
Widowed: 3.6%
Divorced: 2.6%
Zip code 10973 compared to state average:
Median household income above state average.
Black race population percentage below state average.
Foreign-born population percentage significantly below state average.
Renting percentage significantly below state average.
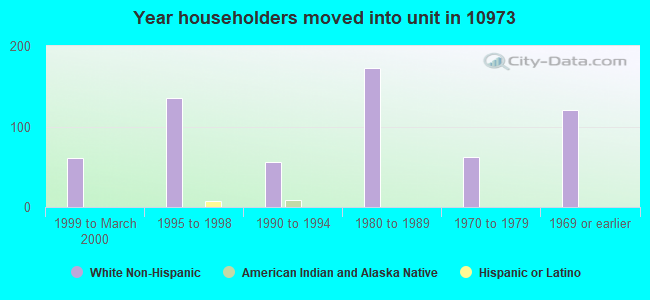
Length of stay since moving in significantly above state average.
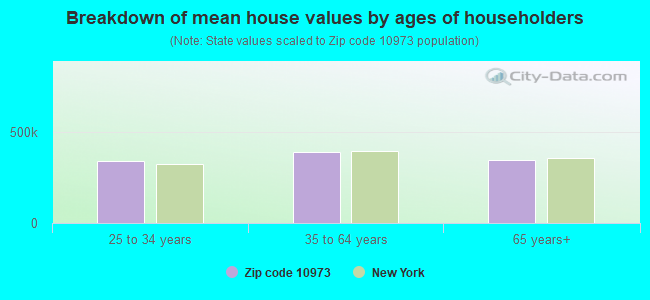
Estimated median house/condo value in 2022: $390,288
10973:
$390,288
New York:
$400,400
Median resident age:
This zip code:
40.4 years
New York median age:
40.0 years
Average household size:
This zip code:
2.8 people
New York:
2.5 people
Averages for the 2020 tax year for zip code 10973, filed in 2021:
Average Adjusted Gross Income (AGI) in 2020: $89,253 (Individual Income Tax Returns)
Here:
$89,253
State:
$90,930
Salary/wage: $75,990 (reported on 82.8% of returns)
Here:
$75,990
State:
$72,104
(% of AGI for various income ranges: 1314.7% for AGIs below $25k, 3681.3% for AGIs $25k-50k, 6442.5% for AGIs $50k-75k, 8169.0% for AGIs $75k-100k, 17383.1% for AGIs $100k-200k, 53700.0% for AGIs over 200k)
Taxable interest for individuals: $933 (reported on 41.4% of returns)
This zip code:
$933
New York:
$3,075
(% of AGI for various income ranges: 13.5% for AGIs below $25k, 11.3% for AGIs $25k-50k, 37.5% for AGIs $50k-75k, 43.0% for AGIs $75k-100k, 103.1% for AGIs $100k-200k, 387.5% for AGIs over 200k)
Ordinary dividends: $4,638 (reported on 25.0% of returns)
Here:
$4,638
State:
$11,095
(% of AGI for various income ranges: 26.5% for AGIs below $25k, 16.0% for AGIs $25k-50k, 123.3% for AGIs $50k-75k, 249.0% for AGIs $75k-100k, 247.5% for AGIs $100k-200k, 1207.5% for AGIs over 200k)
Net capital gain/loss in AGI: +$8,162 (reported on 22.4% of returns)
Here:
+$8,162
State:
+$44,925
(% of AGI for various income ranges: 74.7% for AGIs $25k-50k, 90.8% for AGIs $50k-75k, 412.0% for AGIs $75k-100k, 303.8% for AGIs $100k-200k, 2540.0% for AGIs over 200k)
Profit/loss from business: +$10,613 (reported on 12.9% of returns)
Here:
+$10,613
State:
+$14,940
(% of AGI for various income ranges: 161.8% for AGIs below $25k, 236.7% for AGIs $50k-75k, 645.6% for AGIs $100k-200k)
Taxable individual retirement arrangement distribution: $17,656 (reported on 7.8% of returns)
10973:
$17,656
New York:
$19,609
(% of AGI for various income ranges: 265.3% for AGIs $25k-50k, 440.0% for AGIs $75k-100k, 469.4% for AGIs $100k-200k)
Total itemized deductions: $28,122 (reported on 15.5% of returns)
Here:
$28,122
State:
$39,326
(% of AGI for various income ranges: 757.5% for AGIs $50k-75k, 694.0% for AGIs $75k-100k, 1158.1% for AGIs $100k-200k, 4015.0% for AGIs over 200k)
Charity contributions: $6,771 (reported on 12.1% of returns)
Here:
$6,771
State:
$15,420
(% of AGI for various income ranges: 31.8% for AGIs below $25k, 67.0% for AGIs $75k-100k, 172.5% for AGIs $100k-200k, 1377.5% for AGIs over 200k)
Taxes paid: $9,489 (reported on 15.5% of returns)
10973:
$9,489
State:
$9,183
(% of AGI for various income ranges: 259.2% for AGIs $50k-75k, 261.0% for AGIs $75k-100k, 431.9% for AGIs $100k-200k, 1112.5% for AGIs over 200k)
Earned income credit: $1,600 (reported on 8.6% of returns)
Here:
$1,600
State:
$2,138
(% of AGI for various income ranges: 51.2% for AGIs below $25k, 48.7% for AGIs $25k-50k)
Percentage of individuals using paid preparers for their 2020 taxes: 92.2%
Here:
92%
State:
95%
(% for various income ranges: 92.6% for AGIs below $25k, 95.0% for AGIs $25k-50k, 88.9% for AGIs $50k-75k, 93.3% for AGIs $75k-100k, 92.3% for AGIs $100k-200k, 90.0% for AGIs over 200k)
Averages for the 2012 tax year for zip code 10973, filed in 2013:
Average Adjusted Gross Income (AGI) in 2012: $69,703 (Individual Income Tax Returns)
Here:
$69,703
State:
$77,088
Salary/wage: $62,404 (reported on 87.3% of returns)
Here:
$62,404
State:
$60,593
(% of AGI for various income ranges: 81.4% for AGIs below $25k, 78.3% for AGIs $25k-50k, 76.7% for AGIs $50k-75k, 74.2% for AGIs $75k-100k, 83.8% for AGIs $100k-200k, 70.6% for AGIs over 200k)
Taxable interest for individuals: $610 (reported on 46.4% of returns)
This zip code:
$610
New York:
$3,125
(% of AGI for various income ranges: 1.3% for AGIs below $25k, 0.4% for AGIs $25k-50k, 0.4% for AGIs $50k-75k, 0.3% for AGIs $75k-100k, 0.3% for AGIs $100k-200k, 0.5% for AGIs over 200k)
Ordinary dividends: $2,313 (reported on 27.3% of returns)
Here:
$2,313
State:
$10,299
(% of AGI for various income ranges: 1.1% for AGIs below $25k, 0.4% for AGIs $25k-50k, 1.1% for AGIs $50k-75k, 1.2% for AGIs $75k-100k, 0.7% for AGIs $100k-200k, 1.3% for AGIs over 200k)
Net capital gain/loss in AGI: +$737 (reported on 17.3% of returns)
Here:
+$737
State:
+$42,474
(% of AGI for various income ranges: 0.6% for AGIs $100k-200k, 0.1% for AGIs over 200k)
Profit/loss from business: +$7,231 (reported on 11.8% of returns)
Here:
+$7,231
State:
+$16,168
(% of AGI for various income ranges: 3.2% for AGIs below $25k, 2.7% for AGIs $25k-50k, 4.4% for AGIs $50k-75k, 0.6% for AGIs $100k-200k)
Taxable individual retirement arrangement distribution: $10,490 (reported on 9.1% of returns)
10973:
$10,490
New York:
$17,621
(% of AGI for various income ranges: 4.8% for AGIs below $25k, 2.2% for AGIs $50k-75k, 2.0% for AGIs $75k-100k, 1.4% for AGIs $100k-200k)
Total itemized deductions: $26,879 (24% of AGI, reported on 47.3% of returns)
Here:
$26,879
State:
$34,985
Here:
23.7% of AGI
State:
21.3% of AGI
(% of AGI for various income ranges: 17.1% for AGIs below $25k, 13.6% for AGIs $25k-50k, 18.7% for AGIs $50k-75k, 19.1% for AGIs $75k-100k, 21.1% for AGIs $100k-200k, 14.6% for AGIs over 200k)
Charity contributions: $2,323 (reported on 42.7% of returns)
Here:
$2,323
State:
$5,572
(% of AGI for various income ranges: 0.9% for AGIs below $25k, 1.0% for AGIs $25k-50k, 1.3% for AGIs $50k-75k, 1.6% for AGIs $75k-100k, 1.7% for AGIs $100k-200k, 1.3% for AGIs over 200k)
Taxes paid: $13,550 (reported on 47.3% of returns)
10973:
$13,550
State:
$18,656
(% of AGI for various income ranges: 4.7% for AGIs below $25k, 5.3% for AGIs $25k-50k, 7.5% for AGIs $50k-75k, 9.4% for AGIs $75k-100k, 10.9% for AGIs $100k-200k, 10.1% for AGIs over 200k)
Earned income credit: $1,945 (reported on 10.0% of returns)
Here:
$1,945
State:
$2,230
(% of AGI for various income ranges: 3.5% for AGIs below $25k, 0.9% for AGIs $25k-50k)
Percentage of individuals using paid preparers for their 2012 taxes: 65.5%
Here:
65%
State:
66%
(% for various income ranges: 57.1% for AGIs below $25k, 52.4% for AGIs $25k-50k, 68.8% for AGIs $50k-75k, 76.9% for AGIs $75k-100k, 76.2% for AGIs $100k-200k, 100.0% for AGIs over 200k)
Averages for the 2004 tax year for zip code 10973, filed in 2005:
Average Adjusted Gross Income (AGI) in 2004: $54,147 (Individual Income Tax Returns)
Here:
$54,147
State:
$59,519
Salary/wage: $49,295 (reported on 86.7% of returns)
Here:
$49,295
State:
$50,673
(% of AGI for various income ranges: 144.4% for AGIs below $10k, 75.9% for AGIs $10k-25k, 82.0% for AGIs $25k-50k, 80.8% for AGIs $50k-75k, 84.8% for AGIs $75k-100k, 74.3% for AGIs over 100k)
Taxable interest for individuals: $733 (reported on 57.2% of returns)
This zip code:
$733
New York:
$2,377
(% of AGI for various income ranges: 6.1% for AGIs below $10k, 2.0% for AGIs $10k-25k, 0.7% for AGIs $25k-50k, 0.6% for AGIs $50k-75k, 0.5% for AGIs $75k-100k, 0.7% for AGIs over 100k)
Taxable dividends: $1,172 (reported on 31.6% of returns)
Here:
$1,172
State:
$5,394
(% of AGI for various income ranges: 7.8% for AGIs below $10k, 0.9% for AGIs $10k-25k, 0.8% for AGIs $25k-50k, 0.5% for AGIs $50k-75k, 0.3% for AGIs $75k-100k, 0.7% for AGIs over 100k)
Net capital gain/loss: +$4,627 (reported on 22.2% of returns)
Here:
+$4,627
State:
+$23,581
(% of AGI for various income ranges: -3.9% for AGIs below $10k, 0.7% for AGIs $10k-25k, 0.4% for AGIs $25k-50k, -0.0% for AGIs $50k-75k, 0.4% for AGIs $75k-100k, 4.0% for AGIs over 100k)
Profit/loss from business: +$18,212 (reported on 15.0% of returns)
Here:
+$18,212
State:
+$13,809
(% of AGI for various income ranges: 7.4% for AGIs below $10k, 6.4% for AGIs $10k-25k, 3.4% for AGIs $25k-50k, 3.4% for AGIs $50k-75k, 0.5% for AGIs $75k-100k, 7.6% for AGIs over 100k)
IRA payment deduction: $3,024 (reported on 3.7% of returns)
10973:
$3,024
New York:
$3,115
Self-employed pension: $15,917 (reported on 1.1% of returns)
Here:
$15,917
New York:
$19,016
Total itemized deductions: $21,988 (24% of AGI, reported on 45.7% of returns)
Here:
$21,988
State:
$25,864
Here:
24.2% of AGI
State:
21.9% of AGI
(% of AGI for various income ranges: 12.2% for AGIs $10k-25k, 14.5% for AGIs $25k-50k, 22.0% for AGIs $50k-75k, 21.6% for AGIs $75k-100k, 18.6% for AGIs over 100k)
Charity contributions deductions: $2,243 (2% of AGI, reported on 42.7% of returns)
Here:
$2,243
State:
$4,439
Here:
2.4% of AGI
State:
3.6% of AGI
(% of AGI for various income ranges: 0.5% for AGIs $10k-25k, 1.5% for AGIs $25k-50k, 1.9% for AGIs $50k-75k, 2.1% for AGIs $75k-100k, 1.9% for AGIs over 100k)
Total tax: $7,778 (reported on 79.1% of returns)
10973:
$7,778
State:
$11,730
(% of AGI for various income ranges: 4.1% for AGIs below $10k, 4.8% for AGIs $10k-25k, 7.2% for AGIs $25k-50k, 7.5% for AGIs $50k-75k, 9.5% for AGIs $75k-100k, 15.9% for AGIs over 100k)
Earned income credit: $1,611 (reported on 9.8% of returns)
Here:
$1,611
State:
$1,757
Percentage of individuals using paid preparers for their 2004 taxes: 69.0%
Here:
69%
State:
67%
(% for various income ranges: 61.9% for AGIs below $10k, 68.1% for AGIs $10k-25k, 67.5% for AGIs $25k-50k, 70.2% for AGIs $50k-75k, 76.7% for AGIs $75k-100k, 74.9% for AGIs over 100k)
Household received Food Stamps/SNAP in the past 12 months: 62 Household did not receive Food Stamps/SNAP in the past 12 months: 746
Women who did not have a birth in the past 12 months: 488 (273 now married, 209 unmarried)
Housing units in zip code 10973 with a mortgage: 557 (87 second mortgage, 11 home equity loan, 57 both second mortgage and home equity loan) Houses without a mortgage: 65
Median monthly owner costs for units with a mortgage: $2,615 Median monthly owner costs for units without a mortgage: $1,487
Residents with income below the poverty level in 2022:
This zip code:
8.6%
Whole state:
14.3%
Residents with income below 50% of the poverty level in 2022:
This zip code:
7.1%
Whole state:
6.8%
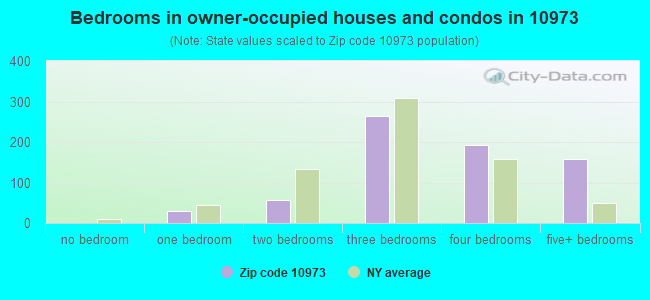
Median number of rooms in houses and condos:
Here:
7.4
State:
6.3
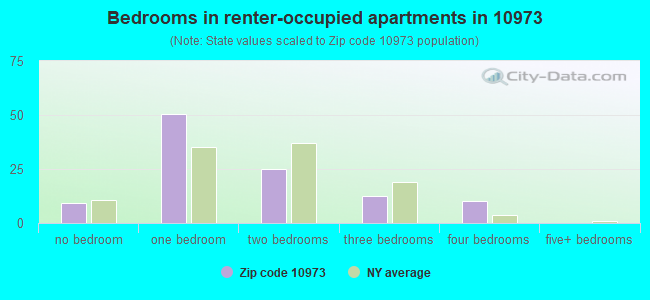
Median number of rooms in apartments:
Here:
2.4
State:
3.8
Notable locations in this zip code not listed on our city pages
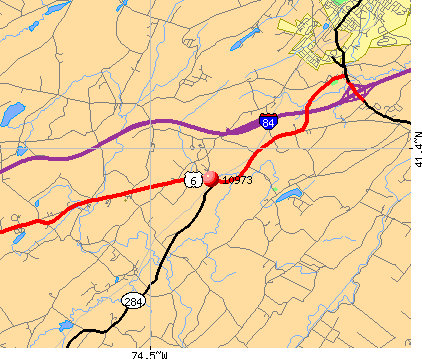
Notable locations in zip code 10973: Slate Hill Orchards (A), The Pines Museum (B), Wawayanda Town Hall (C), Slate Hill Fire Volunteer Department (D). Display/hide their locations on the map
Churches in zip code 10973 include: Church of Slate Hill (A), The Church at Ridgebury (B), Grace United Methodist Church (C). Display/hide their locations on the map
In group quarters: 44 (-1 institutionalized population)
Size of family households: 249 2-persons, 168 3-persons, 113 4-persons, 90 5-persons, 15 6-persons, 15 7-or-more-persons
Size of nonfamily households: 76 1-person, 80 2-persons
429 married couples with children.
74 single-parent households (44 men, 30 women).
92.1% of residents of 10973 zip code speak English at home.
5.4% of residents speak Spanish at home (100% very well).
0.7% of residents speak other Indo-European language at home (94% very well, 6% well).
1.3% of residents speak Asian or Pacific Island language at home (29% very well, 19% well, 52% not well).
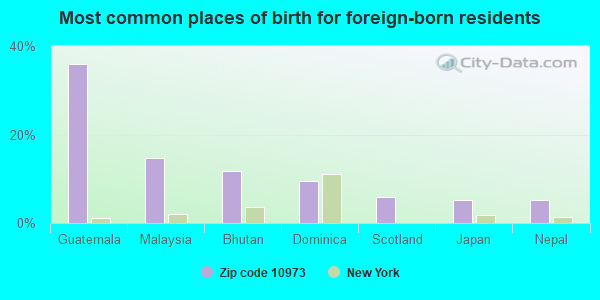
Foreign born population: 135 (5.8%) (44.8% of them are naturalized citizens)
This zip code:
5.8%
Whole state:
22.7%
36%Guatemala
15%Malaysia
12%Bhutan
10%Dominica
6%Scotland
5%Japan
5%Nepal
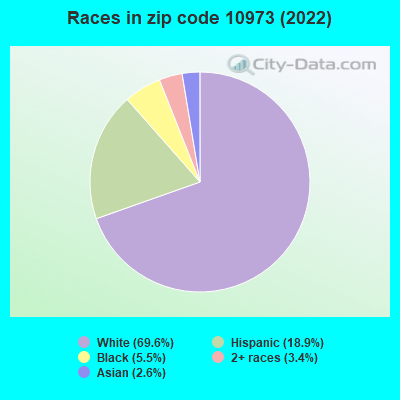
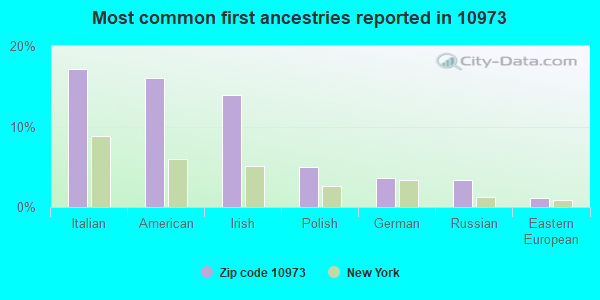
17%Italian
16%American
14%Irish
5%Polish
4%German
3%Russian
1%Eastern European
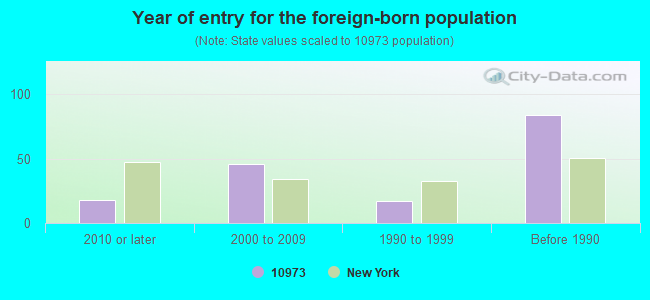
Year of entry for the foreign-born population
182010 or later
462000 to 2009
171990 to 1999
84Before 1990
Facilities with environmental interests located in this zip code:
GREEN S AUTO BODY SHOP (RT 6 in SLATE HILL, NY)
STATE MASTER (New York facility tracking) - AIR PROGRAM, Conditionally Exempt Small Quantity Generators, less than 100 kg/month of hazardous waste (Resource Conservation and Recovery Act (tracking hazardous waste)) Business SIC classification: DIRECT MAIL ADVERTISING SERVICES Alternative names: GREENS BODY SHOP
CITICORP MORTGAGE (44A HORAN RD in SLATE HILL, NY)
(Resource Conservation and Recovery Act (tracking hazardous waste))
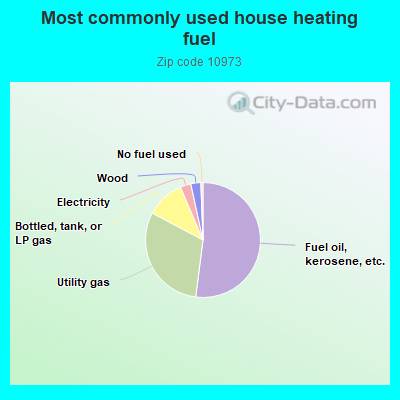
52.2%Fuel oil, kerosene, etc.
30.8%Utility gas
10.9%Bottled, tank, or LP gas
3.0%Electricity
2.8%Wood
0.6%No fuel used
Population in 1990: 2,127.
Place of birth for U.S.-born residents:
This state: 1,744
Northeast: 290
Midwest: 29
South: 42
West: 69
67% of the 10973 zip code residents lived in the same house 5 years ago. Out of people who lived in different houses, 76% lived in this county. Out of people who lived in different counties, 50% lived in New York.
96% of the 10973 zip code residents lived in the same house 1 year ago. Out of people who lived in different houses, 12% moved from this county. Out of people who lived in different houses, 53% moved from different county within same state. Out of people who lived in different houses, 35% moved from different state.
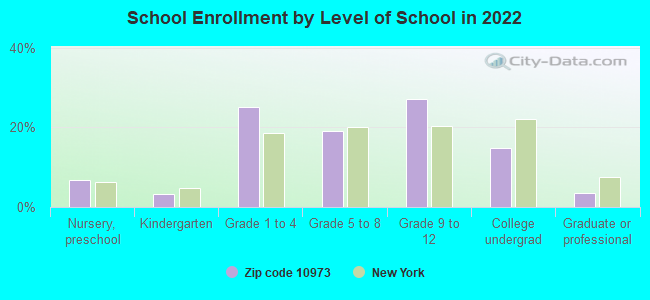
Private vs. public school enrollment:
Students in private schools in grades 1 to 8 (elementary and middle school): 36
Here:
12.2%
New York:
15.6%
Students in private schools in grades 9 to 12 (high school):
Here:
0.0%
New York:
15.0%
Students in private undergraduate colleges: 52
Here:
52.3%
New York:
39.2%
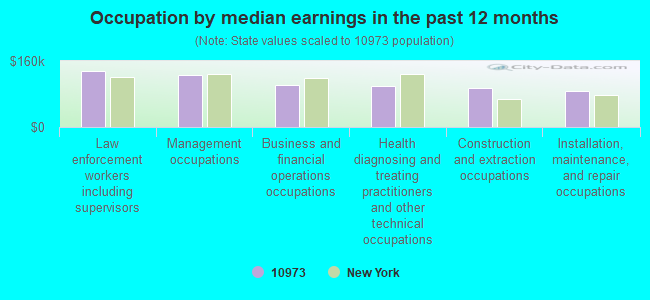
Occupation by median earnings in the past 12 months ($)
136,725Law enforcement workers including supervisors
126,313Management occupations
101,329Business and financial operations occupations
99,466Health diagnosing and treating practitioners and other technical occupations
93,374Construction and extraction occupations
86,239Installation, maintenance, and repair occupations
Top industries in this zip code by the number of employees in 2005:
Accommodation and Food Services: Food Service Contractors (20-49 employees: 1 establishment, 1-4 employees: 1 establishment)
Construction: Electrical Contractors (20-49: 1)
Administrative and Support and Waste Management and Remediation Services: Other Waste Collection (20-49: 1)
Health Care and Social Assistance: Offices of Chiropractors (20-49: 1)
Administrative and Support and Waste Management and Remediation Services: Solid Waste Collection (10-19: 1, 5-9: 1)
Construction: All Other Specialty Trade Contractors (10-19: 1)
Health Care and Social Assistance: Services for the Elderly and Persons with Disabilities (10-19: 1)
Health Care and Social Assistance: Residential Mental Retardation Facilities (5-9: 2)
People in group quarters in 2010:
27 people in group homes intended for adults
People in group quarters in 2000:
21 people in homes for the mentally retarded
Fatal accident statistics in 2011:
Fatal accident count: 1
Vehicles involved in fatal accidents: 2
Fatal accidents caused by drunken drivers: 0
Fatalities: 1
Persons involved in fatal accidents: 4
Pedestrians involved in fatal accidents: 0
Home Mortgage Disclosure Act Aggregated Statistics For Year 2009 (Based on 2 partial tracts)
A) FHA, FSA/RHS & VA Home Purchase Loans
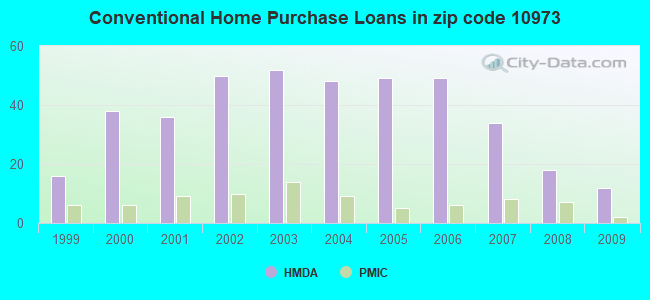
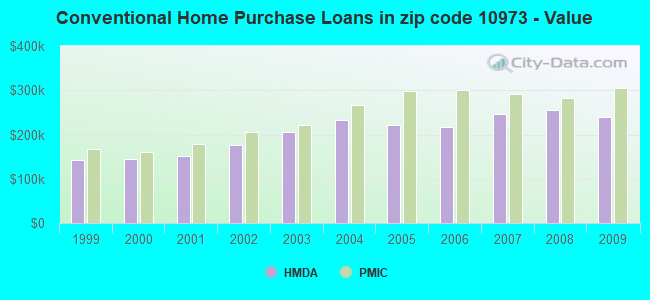
B) Conventional Home Purchase Loans
C) Refinancings
D) Home Improvement Loans
F) Non-occupant Loans on < 5 Family Dwellings (A B C & D)
Number
Average Value
Number
Average Value
Number
Average Value
Number
Average Value
Number
Average Value
LOANS ORIGINATED
7
$269,417
12
$239,247
28
$207,216
2
$157,375
1
$103,060
APPLICATIONS APPROVED, NOT ACCEPTED
1
$281,690
2
$199,025
6
$189,150
1
$14,600
0
$0
APPLICATIONS DENIED
2
$228,010
2
$191,725
24
$277,858
6
$95,542
1
$163,170
APPLICATIONS WITHDRAWN
1
$355,970
1
$167,470
11
$226,528
1
$207,830
0
$0
FILES CLOSED FOR INCOMPLETENESS
0
$0
0
$0
2
$273,100
0
$0
0
$0
Aggregated Statistics For Year 2008 (Based on 2 partial tracts)
A) FHA, FSA/RHS & VA Home Purchase Loans
B) Conventional Home Purchase Loans
C) Refinancings
D) Home Improvement Loans
F) Non-occupant Loans on < 5 Family Dwellings (A B C & D)
Number
Average Value
Number
Average Value
Number
Average Value
Number
Average Value
Number
Average Value
LOANS ORIGINATED
3
$269,090
18
$255,851
27
$220,569
8
$57,218
1
$212,980
APPLICATIONS APPROVED, NOT ACCEPTED
0
$0
4
$311,852
6
$153,367
2
$35,855
0
$0
APPLICATIONS DENIED
0
$0
4
$245,940
26
$246,393
6
$47,807
0
$0
APPLICATIONS WITHDRAWN
1
$401,490
3
$343,377
12
$263,973
2
$190,440
0
$0
FILES CLOSED FOR INCOMPLETENESS
0
$0
1
$353,830
4
$225,650
0
$0
0
$0
Aggregated Statistics For Year 2007 (Based on 2 partial tracts)
A) FHA, FSA/RHS & VA Home Purchase Loans
B) Conventional Home Purchase Loans
C) Refinancings
D) Home Improvement Loans
F) Non-occupant Loans on < 5 Family Dwellings (A B C & D)
G) Loans On Manufactured Home Dwelling (A B C & D)
Number
Average Value
Number
Average Value
Number
Average Value
Number
Average Value
Number
Average Value
Number
Average Value
LOANS ORIGINATED
2
$246,260
34
$245,415
46
$219,946
10
$61,533
3
$220,427
0
$0
APPLICATIONS APPROVED, NOT ACCEPTED
0
$0
6
$276,748
12
$244,436
1
$167,900
0
$0
0
$0
APPLICATIONS DENIED
0
$0
9
$278,251
41
$268,595
7
$62,999
3
$154,727
1
$95,330
APPLICATIONS WITHDRAWN
0
$0
3
$317,040
17
$284,616
1
$223,290
1
$380,880
0
$0
FILES CLOSED FOR INCOMPLETENESS
0
$0
3
$217,563
6
$233,165
1
$64,840
1
$156,730
0
$0
Aggregated Statistics For Year 2006 (Based on 2 partial tracts)
B) Conventional Home Purchase Loans
C) Refinancings
D) Home Improvement Loans
F) Non-occupant Loans on < 5 Family Dwellings (A B C & D)
Number
Average Value
Number
Average Value
Number
Average Value
Number
Average Value
LOANS ORIGINATED
49
$216,461
55
$194,901
18
$77,888
5
$157,074
APPLICATIONS APPROVED, NOT ACCEPTED
6
$190,295
14
$208,167
3
$63,550
0
$0
APPLICATIONS DENIED
14
$241,844
45
$242,611
15
$80,040
4
$242,502
APPLICATIONS WITHDRAWN
7
$246,721
39
$225,864
2
$128,820
0
$0
FILES CLOSED FOR INCOMPLETENESS
1
$230,160
10
$255,922
1
$174,770
0
$0
Aggregated Statistics For Year 2005 (Based on 2 partial tracts)
B) Conventional Home Purchase Loans
C) Refinancings
D) Home Improvement Loans
F) Non-occupant Loans on < 5 Family Dwellings (A B C & D)
Number
Average Value
Number
Average Value
Number
Average Value
Number
Average Value
LOANS ORIGINATED
49
$220,545
71
$197,899
15
$81,672
3
$211,550
APPLICATIONS APPROVED, NOT ACCEPTED
5
$188,248
17
$192,169
6
$63,050
0
$0
APPLICATIONS DENIED
9
$199,528
53
$248,452
13
$65,962
1
$182,500
APPLICATIONS WITHDRAWN
7
$224,760
48
$219,057
9
$160,548
0
$0
FILES CLOSED FOR INCOMPLETENESS
2
$257,210
11
$225,240
2
$87,600
0
$0
Aggregated Statistics For Year 2004 (Based on 2 partial tracts)
B) Conventional Home Purchase Loans
C) Refinancings
D) Home Improvement Loans
F) Non-occupant Loans on < 5 Family Dwellings (A B C & D)
G) Loans On Manufactured Home Dwelling (A B C & D)
Number
Average Value
Number
Average Value
Number
Average Value
Number
Average Value
Number
Average Value
LOANS ORIGINATED
48
$232,475
75
$180,611
15
$90,289
4
$174,230
0
$0
APPLICATIONS APPROVED, NOT ACCEPTED
8
$279,861
15
$158,849
3
$22,330
1
$695,630
0
$0
APPLICATIONS DENIED
7
$202,124
37
$195,122
13
$66,358
0
$0
2
$73,215
APPLICATIONS WITHDRAWN
4
$273,850
39
$175,217
3
$29,487
0
$0
0
$0
FILES CLOSED FOR INCOMPLETENESS
3
$307,593
9
$204,681
2
$60,330
0
$0
0
$0
Aggregated Statistics For Year 2003 (Based on 2 partial tracts)
A) FHA, FSA/RHS & VA Home Purchase Loans
B) Conventional Home Purchase Loans
C) Refinancings
D) Home Improvement Loans
E) Loans on Dwellings For 5+ Families
F) Non-occupant Loans on < 5 Family Dwellings (A B C & D)
Number
Average Value
Number
Average Value
Number
Average Value
Number
Average Value
Number
Average Value
Number
Average Value
LOANS ORIGINATED
1
$201,390
52
$204,799
135
$156,362
7
$50,730
1
$687,040
4
$111,965
APPLICATIONS APPROVED, NOT ACCEPTED
0
$0
6
$220,425
27
$134,784
3
$42,510
0
$0
1
$106,490
APPLICATIONS DENIED
0
$0
3
$165,890
54
$139,849
7
$39,689
0
$0
1
$150,290
APPLICATIONS WITHDRAWN
0
$0
5
$169,870
34
$169,146
4
$57,432
0
$0
1
$197,950
FILES CLOSED FOR INCOMPLETENESS
0
$0
2
$197,525
5
$164,632
0
$0
0
$0
0
$0
Aggregated Statistics For Year 2002 (Based on 2 partial tracts)
A) FHA, FSA/RHS & VA Home Purchase Loans
B) Conventional Home Purchase Loans
C) Refinancings
D) Home Improvement Loans
F) Non-occupant Loans on < 5 Family Dwellings (A B C & D)
Number
Average Value
Number
Average Value
Number
Average Value
Number
Average Value
Number
Average Value
LOANS ORIGINATED
1
$97,470
50
$177,231
81
$137,980
13
$33,559
2
$153,295
APPLICATIONS APPROVED, NOT ACCEPTED
0
$0
4
$187,862
14
$126,734
2
$47,880
0
$0
APPLICATIONS DENIED
0
$0
6
$155,658
25
$146,477
10
$29,714
1
$8,590
APPLICATIONS WITHDRAWN
0
$0
7
$210,406
27
$121,329
3
$24,047
1
$97,040
FILES CLOSED FOR INCOMPLETENESS
0
$0
1
$347,380
6
$111,430
0
$0
0
$0
Aggregated Statistics For Year 2001 (Based on 2 partial tracts)
A) FHA, FSA/RHS & VA Home Purchase Loans
B) Conventional Home Purchase Loans
C) Refinancings
D) Home Improvement Loans
F) Non-occupant Loans on < 5 Family Dwellings (A B C & D)
Number
Average Value
Number
Average Value
Number
Average Value
Number
Average Value
Number
Average Value
LOANS ORIGINATED
6
$138,052
36
$151,542
56
$124,281
8
$28,878
2
$118,945
APPLICATIONS APPROVED, NOT ACCEPTED
0
$0
1
$229,730
9
$132,971
2
$30,060
0
$0
APPLICATIONS DENIED
0
$0
8
$112,718
24
$109,944
7
$23,126
2
$56,250
APPLICATIONS WITHDRAWN
0
$0
5
$161,798
24
$101,911
6
$35,140
0
$0
FILES CLOSED FOR INCOMPLETENESS
0
$0
0
$0
3
$79,870
0
$0
0
$0
Aggregated Statistics For Year 2000 (Based on 2 partial tracts)
A) FHA, FSA/RHS & VA Home Purchase Loans
B) Conventional Home Purchase Loans
C) Refinancings
D) Home Improvement Loans
F) Non-occupant Loans on < 5 Family Dwellings (A B C & D)
Number
Average Value
Number
Average Value
Number
Average Value
Number
Average Value
Number
Average Value
LOANS ORIGINATED
4
$140,092
38
$145,114
22
$100,031
12
$22,902
2
$124,525
APPLICATIONS APPROVED, NOT ACCEPTED
0
$0
4
$182,602
6
$63,265
5
$26,280
0
$0
APPLICATIONS DENIED
1
$100,480
7
$121,704
12
$67,952
8
$22,919
0
$0
APPLICATIONS WITHDRAWN
1
$161,880
5
$112,588
18
$81,896
1
$22,330
0
$0
FILES CLOSED FOR INCOMPLETENESS
0
$0
2
$109,925
4
$125,170
0
$0
0
$0
Aggregated Statistics For Year 1999 (Based on 1 partial tract)
Detailed PMIC statistics for the following Tracts:0118.00
2005 - 2018 National Fire Incident Reporting System (NFIRS) incidents
Based on the data from the years 2005 - 2018 the average number of fires per year is 19. The highest number of fire incidents - 33 took place in 2010, and the least - 6 in 2006. The data has a declining trend.
When looking into fire subcategories, the most reports belonged to: Structure Fires (45.0%), and Outside Fires (31.4%).
Fire incident types reported to NFIRS in Zip Code 10973
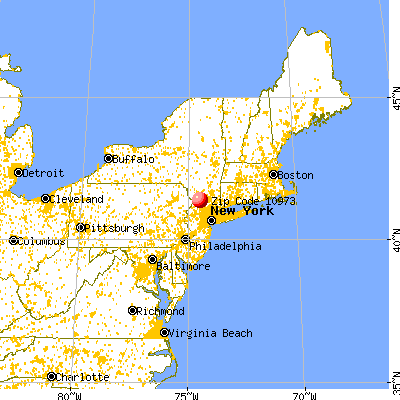


 Nearest zip codes: 10933, 10958, 10940, 10998, 10969, 10932.
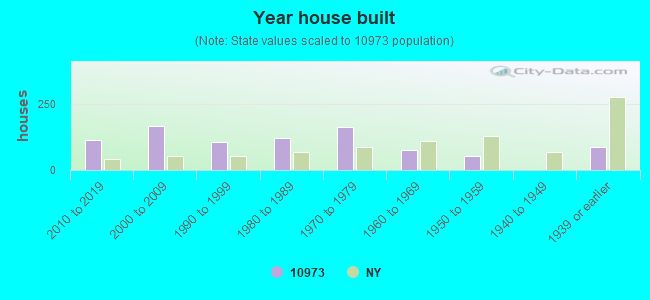


 Based on the data from the years 2005 - 2018 the average number of fires per year is 19. The highest number of fire incidents - 33 took place in 2010, and the least - 6 in 2006. The data has a declining trend.
 When looking into fire subcategories, the most reports belonged to: Structure Fires (45.0%), and Outside Fires (31.4%).