Estimated zip code population in 2022: 3,748 Zip code population in 2010: 3,395 Zip code population in 2000: 3,148
Houses and condos: 1,650 Renter-occupied apartments: 276
% of renters here:
19%
State:
46%
March 2022 cost of living index in zip code 10987: 116.7 (more than average, U.S. average is 100)
Land area: 37.1 sq. mi. Water area: 1.7 sq. mi.
Population density: 101 people per square mile
(very low).
OSM Map
General Map
Google Map
MSN Map
OSM Map
General Map
Google Map
MSN Map
OSM Map
General Map
Google Map
MSN Map
OSM Map
General Map
Google Map
MSN Map
Please wait while loading the map...
Real estate property taxes paid for housing units in 2022:
This zip code:
1.4% ($9,805)
New York:
1.5% ($6,180)
Median real estate property taxes paid for housing units with mortgages in 2022: $9,858 (1.5%) Median real estate property taxes paid for housing units with no mortgage in 2022: $9,755 (1.3%)
Business Search- 14 Million verified businesses
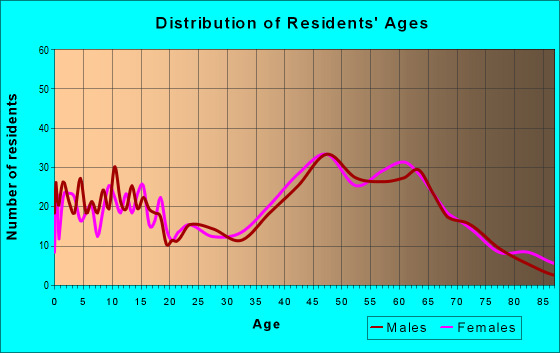
Males: 1,845
(49.2%)
Females: 1,902
(50.8%)
For population 25 years and over in 10987:
High school or higher: 95.8%
Bachelor's degree or higher: 53.1%
Graduate or professional degree: 26.3%
Unemployed: 1.8%
Mean travel time to work (commute): 42.3 minutes
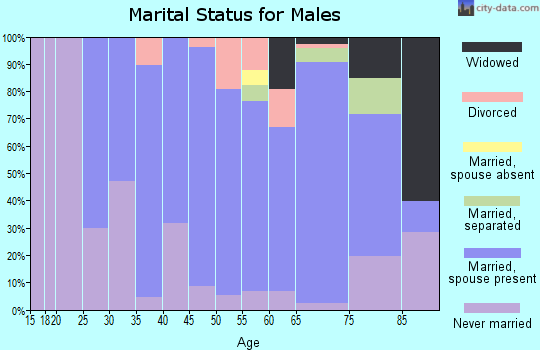
For population 15 years and over in 10987:
Never married: 25.7%
Now married: 58.3%
Separated: 0.3%
Widowed: 7.3%
Divorced: 8.4%
Zip code 10987 compared to state average:
Median household income above state average.
Median house value above state average.
Unemployed percentage significantly below state average.
Black race population percentage below state average.
Median age significantly above state average.
Foreign-born population percentage below state average.
Renting percentage significantly below state average.
Length of stay since moving in above state average.
Number of rooms per house significantly above state average.
Estimated median house/condo value in 2022: $683,005
10987:
$683,005
New York:
$400,400
Median resident age:
This zip code:
51.4 years
New York median age:
40.0 years
Average household size:
This zip code:
2.3 people
New York:
2.5 people
Averages for the 2020 tax year for zip code 10987, filed in 2021:
Average Adjusted Gross Income (AGI) in 2020: $182,915 (Individual Income Tax Returns)
Here:
$182,915
State:
$90,930
Salary/wage: $119,391 (reported on 69.1% of returns)
Here:
$119,391
State:
$72,104
(% of AGI for various income ranges: 894.2% for AGIs below $25k, 3172.1% for AGIs $25k-50k, 6580.0% for AGIs $50k-75k, 8818.2% for AGIs $75k-100k, 17810.0% for AGIs $100k-200k, 118656.7% for AGIs over 200k)
Taxable interest for individuals: $4,830 (reported on 51.0% of returns)
This zip code:
$4,830
New York:
$3,075
(% of AGI for various income ranges: 41.6% for AGIs below $25k, 54.2% for AGIs $25k-50k, 64.3% for AGIs $50k-75k, 88.2% for AGIs $75k-100k, 277.9% for AGIs $100k-200k, 4528.9% for AGIs over 200k)
Ordinary dividends: $14,570 (reported on 37.3% of returns)
Here:
$14,570
State:
$11,095
(% of AGI for various income ranges: 64.8% for AGIs below $25k, 205.3% for AGIs $25k-50k, 277.1% for AGIs $50k-75k, 320.9% for AGIs $75k-100k, 746.8% for AGIs $100k-200k, 9246.7% for AGIs over 200k)
Net capital gain/loss in AGI: +$21,465 (reported on 33.8% of returns)
Here:
+$21,465
State:
+$44,925
(% of AGI for various income ranges: 69.4% for AGIs below $25k, 155.3% for AGIs $25k-50k, 269.3% for AGIs $50k-75k, 424.5% for AGIs $75k-100k, 790.5% for AGIs $100k-200k, 13283.3% for AGIs over 200k)
Profit/loss from business: +$22,859 (reported on 20.1% of returns)
Here:
+$22,859
State:
+$14,940
(% of AGI for various income ranges: 155.5% for AGIs below $25k, 443.7% for AGIs $25k-50k, 287.1% for AGIs $50k-75k, 467.3% for AGIs $75k-100k, 967.9% for AGIs $100k-200k, 5880.0% for AGIs over 200k)
Taxable individual retirement arrangement distribution: $28,267 (reported on 11.8% of returns)
10987:
$28,267
New York:
$19,609
(% of AGI for various income ranges: 60.0% for AGIs below $25k, 168.4% for AGIs $25k-50k, 292.9% for AGIs $50k-75k, 636.4% for AGIs $75k-100k, 1064.2% for AGIs $100k-200k, 3495.6% for AGIs over 200k)
Self-employed (Keogh) retirement plans: $41,967 (reported on 1.5% of returns)
10987:
$41,967
New York:
$32,497
(% of AGI for various income ranges: 662.6% for AGIs $100k-200k)
Total itemized deductions: $45,089 (reported on 18.6% of returns)
Here:
$45,089
State:
$39,326
(% of AGI for various income ranges: 477.9% for AGIs $25k-50k, 424.3% for AGIs $50k-75k, 1251.8% for AGIs $75k-100k, 1649.5% for AGIs $100k-200k, 12356.7% for AGIs over 200k)
Charity contributions: $14,700 (reported on 17.2% of returns)
Here:
$14,700
State:
$15,420
(% of AGI for various income ranges: 39.5% for AGIs $25k-50k, 198.2% for AGIs $75k-100k, 286.3% for AGIs $100k-200k, 4786.7% for AGIs over 200k)
Taxes paid: $9,895 (reported on 18.6% of returns)
10987:
$9,895
State:
$9,183
(% of AGI for various income ranges: 148.4% for AGIs $25k-50k, 151.4% for AGIs $50k-75k, 342.7% for AGIs $75k-100k, 590.5% for AGIs $100k-200k, 1963.3% for AGIs over 200k)
Earned income credit: $910 (reported on 10.3% of returns)
Here:
$910
State:
$2,138
(% of AGI for various income ranges: 41.9% for AGIs below $25k, 32.1% for AGIs $25k-50k)
Percentage of individuals using paid preparers for their 2020 taxes: 94.6%
Here:
95%
State:
95%
(% for various income ranges: 95.3% for AGIs below $25k, 96.4% for AGIs $25k-50k, 95.5% for AGIs $50k-75k, 94.4% for AGIs $75k-100k, 92.1% for AGIs $100k-200k, 94.1% for AGIs over 200k)
Averages for the 2012 tax year for zip code 10987, filed in 2013:
Average Adjusted Gross Income (AGI) in 2012: $202,331 (Individual Income Tax Returns)
Here:
$202,331
State:
$77,088
Salary/wage: $115,673 (reported on 78.8% of returns)
Here:
$115,673
State:
$60,593
(% of AGI for various income ranges: 59.7% for AGIs below $25k, 66.1% for AGIs $25k-50k, 73.2% for AGIs $50k-75k, 61.8% for AGIs $75k-100k, 72.0% for AGIs $100k-200k, 35.4% for AGIs over 200k)
Taxable interest for individuals: $3,876 (reported on 57.0% of returns)
This zip code:
$3,876
New York:
$3,125
(% of AGI for various income ranges: 3.6% for AGIs below $25k, 1.4% for AGIs $25k-50k, 0.9% for AGIs $50k-75k, 1.3% for AGIs $75k-100k, 1.3% for AGIs $100k-200k, 1.0% for AGIs over 200k)
Ordinary dividends: $13,735 (reported on 41.2% of returns)
Here:
$13,735
State:
$10,299
(% of AGI for various income ranges: 4.0% for AGIs below $25k, 2.5% for AGIs $25k-50k, 2.7% for AGIs $50k-75k, 2.3% for AGIs $75k-100k, 2.0% for AGIs $100k-200k, 3.0% for AGIs over 200k)
Net capital gain/loss in AGI: +$66,439 (reported on 34.5% of returns)
Here:
+$66,439
State:
+$42,474
(% of AGI for various income ranges: 1.4% for AGIs $100k-200k, 15.5% for AGIs over 200k)
Profit/loss from business: +$24,458 (reported on 18.8% of returns)
Here:
+$24,458
State:
+$16,168
(% of AGI for various income ranges: 12.1% for AGIs below $25k, 6.1% for AGIs $25k-50k, 3.9% for AGIs $50k-75k, 4.8% for AGIs $75k-100k, 3.6% for AGIs $100k-200k, 1.4% for AGIs over 200k)
Taxable individual retirement arrangement distribution: $32,543 (reported on 13.9% of returns)
10987:
$32,543
New York:
$17,621
(% of AGI for various income ranges: 4.5% for AGIs below $25k, 4.9% for AGIs $25k-50k, 2.3% for AGIs $50k-75k, 3.8% for AGIs $75k-100k, 3.2% for AGIs $100k-200k, 1.8% for AGIs over 200k)
Self-employment retirement plans: $27,725 (reported on 2.4% of returns)
10987:
$27,725
New York:
$27,330
Total itemized deductions: $63,642 (20% of AGI, reported on 60.0% of returns)
Here:
$63,642
State:
$34,985
Here:
20.1% of AGI
State:
21.3% of AGI
(% of AGI for various income ranges: 35.3% for AGIs below $25k, 21.9% for AGIs $25k-50k, 20.9% for AGIs $50k-75k, 22.7% for AGIs $75k-100k, 22.7% for AGIs $100k-200k, 17.3% for AGIs over 200k)
Charity contributions: $5,899 (reported on 53.9% of returns)
Here:
$5,899
State:
$5,572
(% of AGI for various income ranges: 1.0% for AGIs below $25k, 1.3% for AGIs $25k-50k, 1.9% for AGIs $50k-75k, 1.9% for AGIs $75k-100k, 1.8% for AGIs $100k-200k, 1.5% for AGIs over 200k)
Taxes paid: $42,063 (reported on 60.0% of returns)
10987:
$42,063
State:
$18,656
(% of AGI for various income ranges: 16.1% for AGIs below $25k, 9.4% for AGIs $25k-50k, 9.9% for AGIs $50k-75k, 11.9% for AGIs $75k-100k, 12.4% for AGIs $100k-200k, 12.7% for AGIs over 200k)
Earned income credit: $1,350 (reported on 4.8% of returns)
Here:
$1,350
State:
$2,230
(% of AGI for various income ranges: 2.5% for AGIs below $25k)
Percentage of individuals using paid preparers for their 2012 taxes: 72.7%
Here:
73%
State:
66%
(% for various income ranges: 63.4% for AGIs below $25k, 68.0% for AGIs $25k-50k, 71.4% for AGIs $50k-75k, 80.0% for AGIs $75k-100k, 76.3% for AGIs $100k-200k, 84.0% for AGIs over 200k)
Averages for the 2004 tax year for zip code 10987, filed in 2005:
Average Adjusted Gross Income (AGI) in 2004: $194,379 (Individual Income Tax Returns)
Here:
$194,379
State:
$59,519
Salary/wage: $129,802 (reported on 79.4% of returns)
Here:
$129,802
State:
$50,673
(% of AGI for various income ranges: 55.2% for AGIs $10k-25k, 76.0% for AGIs $25k-50k, 68.6% for AGIs $50k-75k, 75.8% for AGIs $75k-100k, 49.4% for AGIs over 100k)
Taxable interest for individuals: $3,485 (reported on 70.2% of returns)
This zip code:
$3,485
New York:
$2,377
(% of AGI for various income ranges: 6.4% for AGIs $10k-25k, 1.3% for AGIs $25k-50k, 1.7% for AGIs $50k-75k, 1.2% for AGIs $75k-100k, 1.1% for AGIs over 100k)
Taxable dividends: $9,393 (reported on 50.3% of returns)
Here:
$9,393
State:
$5,394
(% of AGI for various income ranges: 3.8% for AGIs $10k-25k, 2.4% for AGIs $25k-50k, 2.0% for AGIs $50k-75k, 1.5% for AGIs $75k-100k, 2.3% for AGIs over 100k)
Net capital gain/loss: +$65,343 (reported on 43.5% of returns)
Here:
+$65,343
State:
+$23,581
(% of AGI for various income ranges: 3.6% for AGIs $10k-25k, -0.2% for AGIs $25k-50k, 0.8% for AGIs $50k-75k, -0.1% for AGIs $75k-100k, 16.6% for AGIs over 100k)
Profit/loss from business: +$42,241 (reported on 17.4% of returns)
Here:
+$42,241
State:
+$13,809
(% of AGI for various income ranges: 6.1% for AGIs $10k-25k, 5.7% for AGIs $25k-50k, 6.5% for AGIs $50k-75k, 5.8% for AGIs $75k-100k, 3.4% for AGIs over 100k)
IRA payment deduction: $3,973 (reported on 4.4% of returns)
10987:
$3,973
New York:
$3,115
Self-employed pension: $29,902 (reported on 2.5% of returns)
Here:
$29,902
New York:
$19,016
Total itemized deductions: $47,402 (16% of AGI, reported on 60.4% of returns)
Here:
$47,402
State:
$25,864
Here:
16.5% of AGI
State:
21.9% of AGI
(% of AGI for various income ranges: 25.1% for AGIs $10k-25k, 22.5% for AGIs $25k-50k, 28.0% for AGIs $50k-75k, 23.0% for AGIs $75k-100k, 13.1% for AGIs over 100k)
Charity contributions deductions: $5,909 (2% of AGI, reported on 56.6% of returns)
Here:
$5,909
State:
$4,439
Here:
2.2% of AGI
State:
3.6% of AGI
(% of AGI for various income ranges: 1.4% for AGIs $10k-25k, 1.9% for AGIs $25k-50k, 2.8% for AGIs $50k-75k, 2.5% for AGIs $75k-100k, 1.6% for AGIs over 100k)
Total tax: $63,560 (reported on 82.8% of returns)
10987:
$63,560
State:
$11,730
(% of AGI for various income ranges: 4.7% for AGIs $10k-25k, 8.1% for AGIs $25k-50k, 8.5% for AGIs $50k-75k, 10.6% for AGIs $75k-100k, 29.4% for AGIs over 100k)
Earned income credit: $1,118 (reported on 4.1% of returns)
Here:
$1,118
State:
$1,757
Percentage of individuals using paid preparers for their 2004 taxes: 74.1%
Here:
74%
State:
67%
(% for various income ranges: 70.2% for AGIs below $10k, 67.3% for AGIs $10k-25k, 68.9% for AGIs $25k-50k, 78.9% for AGIs $50k-75k, 72.6% for AGIs $75k-100k, 80.0% for AGIs over 100k)
Likely homosexual households (counted as self-reported same-sex unmarried-partner households)
Lesbian couples: 0.0% of all households
Gay men: 0.6% of all households
Household received Food Stamps/SNAP in the past 12 months: 20 Household did not receive Food Stamps/SNAP in the past 12 months: 1,435
Women who had a birth in the past 12 months: 15 (15 now married, 0 unmarried) Women who did not have a birth in the past 12 months: 761 (370 now married, 386 unmarried)
Housing units in zip code 10987 with a mortgage: 636 (85 second mortgage, 80 both second mortgage and home equity loan) Median monthly owner costs for units with a mortgage: $3,592 Median monthly owner costs for units without a mortgage: $1,487
Residents with income below the poverty level in 2022:
This zip code:
14.6%
Whole state:
14.3%
Residents with income below 50% of the poverty level in 2022:
This zip code:
1.6%
Whole state:
6.8%
Median number of rooms in houses and condos:
Here:
8.3
State:
6.3
Median number of rooms in apartments:
Here:
4.4
State:
3.8
Notable locations in this zip code not listed on our city pages
Notable locations in zip code 10987: Tuxedo Park Golf Course (A), Metro-North Tuxedo Station (B), Tuxedo Park Library (C), Sterling Volunteer Forest Fire Company 2 (D), Tuxedo Park Fire Department (E), Eagle Valley Volunteer Fire Company 3 (F). Display/hide their locations on the map
Lakes, reservoirs, and swamps: Kloibers Pond (A), Little Cedar Pond (B), Mountain Lake (C), Sterling Lake (D), We-Wah Lake (E), Sterling Forest Lake (F), Tuxedo Lake (G), Eagle Lake (H). Display/hide their locations on the map
In group quarters: 341 (-1 institutionalized population)
Size of family households: 498 2-persons, 175 3-persons, 208 4-persons, 57 5-persons, 25 6-persons, 6 7-or-more-persons
Size of nonfamily households: 417 1-person, 93 2-persons
486 married couples with children.
28 single-parent households (28 women).
83.1% of residents of 10987 zip code speak English at home.
7.8% of residents speak Spanish at home (82% very well, 17% well, 1% not well).
7.9% of residents speak other Indo-European language at home (79% very well, 15% well, 6% not at all).
0.8% of residents speak Asian or Pacific Island language at home (75% very well, 25% well).
0.5% of residents speak other language at home (100% very well).
Foreign born population: 506 (13.5%) (63.6% of them are naturalized citizens)
This zip code:
13.5%
Whole state:
22.7%
21%Denmark
14%Grenada
13%Chile
7%St. Vincent and the Grenadines
4%Sweden
3%Honduras
3%Malaysia
25%American
20%Italian
10%Irish
4%English
4%Haitian
4%European
3%German
Year of entry for the foreign-born population
1412010 or later
1442000 to 2009
601990 to 1999
257Before 1990
Facilities with environmental interests located in this zip code:
INTERNATIONAL PAPER CORP RESEARCH CENTER (1422 LONG MEADOW ROAD in TUXEDO, NY)
AIR SYNTHETIC MINOR (AIRS/AFS) STATE MASTER (New York facility tracking) - National Pollutant Discharge Elimination System Permit, AIR PROGRAM, National Pollutant Discharge Elimination System Permit, HAZARDOUS WASTE PROGRAM Small Quantity Generators, between 100 kg and 1000 kg of hazardous waste/month (Resource Conservation and Recovery Act (tracking hazardous waste)) - notification Business SIC classification: NONCLASSIFIABLE ESTABLISHMENTS Organizations: OWNERNAME (CONTACT/OWNER)
Alternative names: INTERNATIONAL PAPER COMPANY, INTERNATIONAL PAPER CO TUXEDO PARK
GEORGE F. BAKER HS ( in TUXEDO PARK, NY)
(National Center for Education Statistics) - STATE ID-441903020001 Organizations: TUXEDO UFSD (SCHOOL DISTRICT)
GEORGE GRANT MASON ES ( in TUXEDO PARK, NY)
(National Center for Education Statistics) - STATE ID-441903020002 Organizations: TUXEDO UFSD (SCHOOL DISTRICT)
HAMLET WWTP (PO BOX 725 in TUXEDO PARK, NY)
National Pollutant Discharge Elimination System NON-MAJOR (Tracking pollutant discharge elimination systems) - permit Business SIC classification: SEWERAGE SYSTEMS Organizations: TUXEDO PARK (V) (CONTACT/OWNER)
Alternative names: TUXEDO (T)
1422 LONG MEADOW ROAD ( in TUXEDO, NY)
National Pollutant Discharge Elimination System NON-MAJOR (Tracking pollutant discharge elimination systems) - permit Business SIC classification: COMMERCIAL PHYSICAL AND BIOLOGICAL RESEARCH Organizations: INTERNATIONAL PAPER CORP (CONTACT/OWNER)
Alternative names: INTERNATIONAL PAPER RESEARCH
CINTICHEM INCORPORATED (1553 LONG MEADOW ROAD in TUXEDO, NY)
HAZARDOUS WASTE BIENNIAL REPORTER (Resource Conservation and Recovery Act (tracking hazardous waste)) Large Quantity Generators, more that 1000 kg of hazardous waste/month (Resource Conservation and Recovery Act (tracking hazardous waste))
Housing units lacking complete plumbing facilities: 1.0% Housing units lacking complete kitchen facilities: 7.4%
44.3%Fuel oil, kerosene, etc.
25.1%Utility gas
16.2%Bottled, tank, or LP gas
12.7%Electricity
0.6%Other fuel
Population in 1990: 2,481. Population change in the 1990s: +667 (+26.9%).
Place of birth for U.S.-born residents:
This state: 1,712
Northeast: 851
Midwest: 80
South: 204
West: 312
64% of the 10987 zip code residents lived in the same house 5 years ago. Out of people who lived in different houses, 28% lived in this county. Out of people who lived in different counties, 50% lived in New York.
94% of the 10987 zip code residents lived in the same house 1 year ago. Out of people who lived in different houses, 37% moved from this county. Out of people who lived in different houses, 25% moved from different county within same state. Out of people who lived in different houses, 38% moved from different state. Out of people who lived in different houses, 1% moved from abroad.
Private vs. public school enrollment:
Students in private schools in grades 1 to 8 (elementary and middle school): 37
Here:
13.1%
New York:
15.6%
Students in private schools in grades 9 to 12 (high school): 53
Here:
32.4%
New York:
15.0%
Students in private undergraduate colleges: 144
Here:
66.6%
New York:
39.2%
Occupation by median earnings in the past 12 months ($)
201,803Management occupations
137,285Health diagnosing and treating practitioners and other technical occupations
123,638Legal occupations
112,602Sales and related occupations
96,558Construction and extraction occupations
87,355Computer and mathematical occupations
Companies with federal contracts located in this zip code:
M SPIEGEL & SONS OIL CORP (10 E VILLAGE RD in TUXEDO PARK, NY; small business) : $10,420 in 2 contractsin 2004
$6,912 with Defense Logistics Agency for Fuel Oils. Signed on 2004-10-20. Completion date: 2004-10-20.
$3,508, same as above.Signed on 2004-12-01. Completion date: 2004-12-01.
Top industries in this zip code by the number of employees in 2005:
Arts, Entertainment, and Recreation: Other Performing Arts Companies (100-249 employees: 1 establishment)
Arts, Entertainment, and Recreation: Golf Courses and Country Clubs (50-99: 1)
Finance and Insurance: Real Estate Credit (20-49: 1)
Management of Companies and Enterprises: Corporate, Subsidiary, and Regional Managing Offices (20-49: 1)
Construction: Land Subdivision (10-19: 2)
Health Care and Social Assistance: Nursing Care Facilities (10-19: 1)
Information: Libraries and Archives (10-19: 1)
Professional, Scientific, and Technical Services: Testing Laboratories (10-19: 1)
Construction: Roofing Contractors (10-19: 1)
People in group quarters in 2010:
34 people in group homes intended for adults
2 people in other noninstitutional facilities
Fatal accident statistics in 2014:
Fatal accident count: 1
Vehicles involved in fatal accidents: 1
Fatal accidents caused by drunken drivers: 0
Fatalities: 1
Persons involved in fatal accidents: 1
Pedestrians involved in fatal accidents: 0
Fatal accident statistics in 2012:
Fatal accident count: 1
Vehicles involved in fatal accidents: 2
Fatal accidents caused by drunken drivers: 0
Fatalities: 1
Persons involved in fatal accidents: 3
Pedestrians involved in fatal accidents: 0
Home Mortgage Disclosure Act Aggregated Statistics For Year 2009 (Based on 4 partial tracts)
A) FHA, FSA/RHS & VA Home Purchase Loans
B) Conventional Home Purchase Loans
C) Refinancings
D) Home Improvement Loans
F) Non-occupant Loans on < 5 Family Dwellings (A B C & D)
Number
Average Value
Number
Average Value
Number
Average Value
Number
Average Value
Number
Average Value
LOANS ORIGINATED
19
$251,475
60
$324,268
170
$267,664
11
$118,074
17
$333,994
APPLICATIONS APPROVED, NOT ACCEPTED
3
$227,610
8
$254,858
25
$228,644
2
$17,180
2
$178,545
APPLICATIONS DENIED
2
$311,340
13
$285,988
137
$315,192
23
$137,710
11
$458,546
APPLICATIONS WITHDRAWN
2
$262,645
8
$270,611
53
$298,862
4
$143,832
6
$456,905
FILES CLOSED FOR INCOMPLETENESS
3
$241,417
4
$475,370
24
$339,675
0
$0
2
$379,475
Aggregated Statistics For Year 2008 (Based on 4 partial tracts)
A) FHA, FSA/RHS & VA Home Purchase Loans
B) Conventional Home Purchase Loans
C) Refinancings
D) Home Improvement Loans
E) Loans on Dwellings For 5+ Families
F) Non-occupant Loans on < 5 Family Dwellings (A B C & D)
Number
Average Value
Number
Average Value
Number
Average Value
Number
Average Value
Number
Average Value
Number
Average Value
LOANS ORIGINATED
10
$260,947
89
$356,751
117
$275,187
22
$88,609
3
$335,820
23
$422,842
APPLICATIONS APPROVED, NOT ACCEPTED
3
$342,910
16
$309,620
40
$372,681
7
$105,396
1
$335,820
8
$226,539
APPLICATIONS DENIED
5
$195,588
31
$383,095
142
$302,665
38
$86,533
0
$0
16
$296,492
APPLICATIONS WITHDRAWN
0
$0
15
$371,773
67
$318,231
7
$79,477
0
$0
7
$231,467
FILES CLOSED FOR INCOMPLETENESS
1
$580,570
4
$160,380
14
$530,283
4
$229,128
0
$0
1
$61,570
Aggregated Statistics For Year 2007 (Based on 4 partial tracts)
A) FHA, FSA/RHS & VA Home Purchase Loans
B) Conventional Home Purchase Loans
C) Refinancings
D) Home Improvement Loans
E) Loans on Dwellings For 5+ Families
F) Non-occupant Loans on < 5 Family Dwellings (A B C & D)
G) Loans On Manufactured Home Dwelling (A B C & D)
Number
Average Value
Number
Average Value
Number
Average Value
Number
Average Value
Number
Average Value
Number
Average Value
Number
Average Value
LOANS ORIGINATED
4
$287,405
159
$314,191
215
$327,060
45
$102,006
0
$0
26
$362,377
0
$0
APPLICATIONS APPROVED, NOT ACCEPTED
2
$297,760
33
$209,756
49
$353,993
9
$200,440
0
$0
9
$103,856
1
$203,260
APPLICATIONS DENIED
0
$0
57
$274,853
198
$310,568
39
$131,370
1
$792,730
32
$341,669
0
$0
APPLICATIONS WITHDRAWN
0
$0
27
$280,722
99
$304,861
14
$169,787
1
$447,760
8
$158,815
0
$0
FILES CLOSED FOR INCOMPLETENESS
0
$0
8
$433,834
34
$241,387
3
$89,927
0
$0
5
$281,568
0
$0
Aggregated Statistics For Year 2006 (Based on 4 partial tracts)
A) FHA, FSA/RHS & VA Home Purchase Loans
B) Conventional Home Purchase Loans
C) Refinancings
D) Home Improvement Loans
E) Loans on Dwellings For 5+ Families
F) Non-occupant Loans on < 5 Family Dwellings (A B C & D)
G) Loans On Manufactured Home Dwelling (A B C & D)
Number
Average Value
Number
Average Value
Number
Average Value
Number
Average Value
Number
Average Value
Number
Average Value
Number
Average Value
LOANS ORIGINATED
5
$239,346
252
$279,599
307
$246,940
46
$138,511
3
$461,580
51
$298,978
0
$0
APPLICATIONS APPROVED, NOT ACCEPTED
1
$316,790
41
$283,255
67
$218,192
17
$106,205
0
$0
6
$759,205
0
$0
APPLICATIONS DENIED
0
$0
36
$271,126
175
$262,598
57
$85,058
0
$0
15
$672,205
0
$0
APPLICATIONS WITHDRAWN
1
$336,940
41
$288,150
158
$247,314
22
$113,099
1
$467,910
9
$261,750
1
$41,420
FILES CLOSED FOR INCOMPLETENESS
0
$0
7
$312,953
38
$267,542
3
$133,953
0
$0
1
$123,130
0
$0
Aggregated Statistics For Year 2005 (Based on 4 partial tracts)
A) FHA, FSA/RHS & VA Home Purchase Loans
B) Conventional Home Purchase Loans
C) Refinancings
D) Home Improvement Loans
F) Non-occupant Loans on < 5 Family Dwellings (A B C & D)
Number
Average Value
Number
Average Value
Number
Average Value
Number
Average Value
Number
Average Value
LOANS ORIGINATED
1
$284,330
276
$303,982
304
$249,244
59
$75,727
44
$360,198
APPLICATIONS APPROVED, NOT ACCEPTED
0
$0
22
$345,527
86
$251,575
25
$101,307
4
$240,112
APPLICATIONS DENIED
0
$0
67
$252,799
150
$235,937
46
$109,730
20
$198,022
APPLICATIONS WITHDRAWN
2
$249,625
54
$235,014
209
$207,856
25
$109,905
12
$180,031
FILES CLOSED FOR INCOMPLETENESS
0
$0
9
$279,319
34
$207,476
3
$61,567
2
$332,220
Aggregated Statistics For Year 2004 (Based on 4 partial tracts)
A) FHA, FSA/RHS & VA Home Purchase Loans
B) Conventional Home Purchase Loans
C) Refinancings
D) Home Improvement Loans
E) Loans on Dwellings For 5+ Families
F) Non-occupant Loans on < 5 Family Dwellings (A B C & D)
G) Loans On Manufactured Home Dwelling (A B C & D)
Number
Average Value
Number
Average Value
Number
Average Value
Number
Average Value
Number
Average Value
Number
Average Value
Number
Average Value
LOANS ORIGINATED
10
$180,874
245
$257,701
377
$211,664
70
$88,668
1
$559,700
42
$222,753
0
$0
APPLICATIONS APPROVED, NOT ACCEPTED
1
$260,820
38
$335,830
76
$171,225
23
$65,333
0
$0
6
$650,228
0
$0
APPLICATIONS DENIED
2
$292,725
68
$266,226
204
$194,661
68
$81,764
0
$0
19
$175,432
2
$44,710
APPLICATIONS WITHDRAWN
0
$0
33
$206,950
237
$185,043
23
$72,629
0
$0
9
$167,136
0
$0
FILES CLOSED FOR INCOMPLETENESS
0
$0
7
$229,483
34
$195,703
6
$161,945
1
$246,270
0
$0
0
$0
Aggregated Statistics For Year 2003 (Based on 4 partial tracts)
A) FHA, FSA/RHS & VA Home Purchase Loans
B) Conventional Home Purchase Loans
C) Refinancings
D) Home Improvement Loans
F) Non-occupant Loans on < 5 Family Dwellings (A B C & D)
Number
Average Value
Number
Average Value
Number
Average Value
Number
Average Value
Number
Average Value
LOANS ORIGINATED
8
$161,629
226
$255,234
776
$204,902
30
$51,281
50
$177,321
APPLICATIONS APPROVED, NOT ACCEPTED
1
$172,390
42
$254,776
161
$243,691
11
$126,471
18
$194,008
APPLICATIONS DENIED
2
$155,595
40
$302,850
263
$200,922
42
$48,541
12
$165,398
APPLICATIONS WITHDRAWN
3
$169,403
21
$223,209
208
$180,075
7
$44,567
7
$143,283
FILES CLOSED FOR INCOMPLETENESS
1
$162,310
6
$130,783
35
$202,599
8
$54,352
3
$136,193
Aggregated Statistics For Year 2002 (Based on 4 partial tracts)
A) FHA, FSA/RHS & VA Home Purchase Loans
B) Conventional Home Purchase Loans
C) Refinancings
D) Home Improvement Loans
E) Loans on Dwellings For 5+ Families
F) Non-occupant Loans on < 5 Family Dwellings (A B C & D)
Number
Average Value
Number
Average Value
Number
Average Value
Number
Average Value
Number
Average Value
Number
Average Value
LOANS ORIGINATED
14
$127,428
250
$220,784
453
$217,386
58
$52,478
0
$0
38
$232,325
APPLICATIONS APPROVED, NOT ACCEPTED
1
$151,120
26
$195,327
104
$242,960
14
$47,821
0
$0
10
$201,410
APPLICATIONS DENIED
1
$175,750
31
$153,529
160
$178,230
40
$27,368
1
$16,790
14
$236,979
APPLICATIONS WITHDRAWN
6
$143,470
42
$274,061
138
$184,479
15
$40,435
0
$0
4
$58,815
FILES CLOSED FOR INCOMPLETENESS
0
$0
7
$280,990
52
$214,981
2
$79,935
0
$0
4
$129,295
Aggregated Statistics For Year 2001 (Based on 4 partial tracts)
A) FHA, FSA/RHS & VA Home Purchase Loans
B) Conventional Home Purchase Loans
C) Refinancings
D) Home Improvement Loans
E) Loans on Dwellings For 5+ Families
F) Non-occupant Loans on < 5 Family Dwellings (A B C & D)
Number
Average Value
Number
Average Value
Number
Average Value
Number
Average Value
Number
Average Value
Number
Average Value
LOANS ORIGINATED
24
$134,238
251
$191,883
266
$172,470
37
$38,315
1
$190,300
29
$176,168
APPLICATIONS APPROVED, NOT ACCEPTED
1
$201,990
51
$199,136
61
$109,641
12
$50,644
1
$235,070
4
$100,188
APPLICATIONS DENIED
0
$0
39
$302,965
153
$154,445
40
$33,663
0
$0
4
$100,900
APPLICATIONS WITHDRAWN
7
$132,660
35
$309,810
128
$123,827
22
$30,555
0
$0
1
$223,880
FILES CLOSED FOR INCOMPLETENESS
0
$0
6
$140,158
27
$160,793
1
$22,390
0
$0
5
$120,952
Aggregated Statistics For Year 2000 (Based on 4 partial tracts)
A) FHA, FSA/RHS & VA Home Purchase Loans
B) Conventional Home Purchase Loans
C) Refinancings
D) Home Improvement Loans
E) Loans on Dwellings For 5+ Families
F) Non-occupant Loans on < 5 Family Dwellings (A B C & D)
Number
Average Value
Number
Average Value
Number
Average Value
Number
Average Value
Number
Average Value
Number
Average Value
LOANS ORIGINATED
40
$121,241
242
$192,942
76
$126,189
40
$53,816
1
$48,130
28
$188,824
APPLICATIONS APPROVED, NOT ACCEPTED
1
$82,840
24
$190,747
30
$208,349
12
$25,387
0
$0
3
$187,687
APPLICATIONS DENIED
2
$115,300
42
$184,423
87
$146,643
30
$31,829
0
$0
6
$68,843
APPLICATIONS WITHDRAWN
6
$97,580
32
$273,394
75
$139,503
10
$41,816
0
$0
6
$499,067
FILES CLOSED FOR INCOMPLETENESS
0
$0
4
$112,672
24
$126,430
1
$31,760
0
$0
0
$0
Aggregated Statistics For Year 1999 (Based on 2 partial tracts)
A) FHA, FSA/RHS & VA Home Purchase Loans
B) Conventional Home Purchase Loans
C) Refinancings
D) Home Improvement Loans
F) Non-occupant Loans on < 5 Family Dwellings (A B C & D)
Detailed PMIC statistics for the following Tracts:0148.00
, 0149.00
2002 - 2018 National Fire Incident Reporting System (NFIRS) incidents
According to the data from the years 2002 - 2018 the average number of fire incidents per year is 27. The highest number of reported fires - 57 took place in 2010, and the least - 0 in 2005. The data has a declining trend.
When looking into fire subcategories, the most incidents belonged to: Outside Fires (40.0%), and Mobile Property/Vehicle Fires (35.9%).
Fire incident types reported to NFIRS in Zip Code 10987
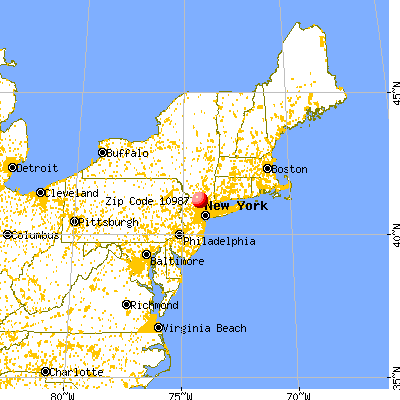


 Nearest zip codes: 10974, 10979, 10925, 10931, 07456, 10975.


 According to the data from the years 2002 - 2018 the average number of fire incidents per year is 27. The highest number of reported fires - 57 took place in 2010, and the least - 0 in 2005. The data has a declining trend.
 When looking into fire subcategories, the most incidents belonged to: Outside Fires (40.0%), and Mobile Property/Vehicle Fires (35.9%).