Estimated zip code population in 2022: 3,463 Zip code population in 2010: 3,589 Zip code population in 2000: 2,965
Houses and condos: 1,229 Renter-occupied apartments: 259
% of renters here:
23%
State:
46%
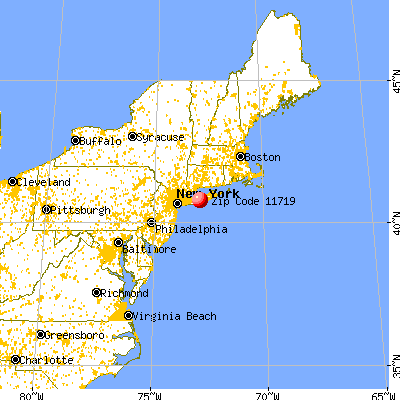
March 2022 cost of living index in zip code 11719: 147.8 (very high, U.S. average is 100)
Land area: 6.0 sq. mi. Water area: 0.1 sq. mi.
Population density: 576 people per square mile
(low).
OSM Map
General Map
Google Map
MSN Map
OSM Map
General Map
Google Map
MSN Map
OSM Map
General Map
Google Map
MSN Map
OSM Map
General Map
Google Map
MSN Map
Please wait while loading the map...
Real estate property taxes paid for housing units in 2022:
This zip code:
1.8% ($9,805)
New York:
1.5% ($6,180)
Median real estate property taxes paid for housing units with mortgages in 2022: $9,858 (1.7%) Median real estate property taxes paid for housing units with no mortgage in 2022: $8,936 (1.7%)
Business Search- 14 Million verified businesses
Males: 1,731
(50.0%)
Females: 1,731
(50.0%)
For population 25 years and over in 11719:
High school or higher: 92.9%
Bachelor's degree or higher: 35.4%
Graduate or professional degree: 17.3%
Unemployed: 8.4%
Mean travel time to work (commute): 30.6 minutes
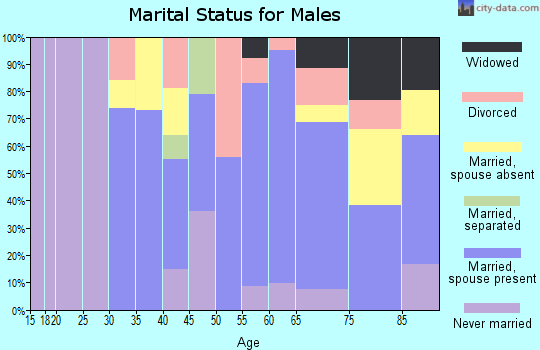
For population 15 years and over in 11719:
Never married: 33.4%
Now married: 49.7%
Separated: 1.0%
Widowed: 4.7%
Divorced: 11.3%
Zip code 11719 compared to state average:
Black race population percentage below state average.
Hispanic race population percentage below state average.
Median age above state average.
Foreign-born population percentage significantly below state average.
Renting percentage below state average.
Length of stay since moving in significantly above state average.
Estimated median house/condo value in 2022: $543,839
11719:
$543,839
New York:
$400,400
According to our research of New York and other state lists, there were 2 registered sex offenders living in 11719 zip code as of May 28, 2024. The ratio of all residents to sex offenders in zip code 11719 is 1,921 to 1. The ratio of registered sex offenders to all residents in this zip code is lower than the state average.
Median resident age:
This zip code:
45.4 years
New York median age:
40.0 years
Average household size:
This zip code:
2.5 people
New York:
2.5 people
Averages for the 2020 tax year for zip code 11719, filed in 2021:
Average Adjusted Gross Income (AGI) in 2020: $114,886 (Individual Income Tax Returns)
Here:
$114,886
State:
$90,930
Salary/wage: $84,215 (reported on 78.6% of returns)
Here:
$84,215
State:
$72,104
(% of AGI for various income ranges: 1338.7% for AGIs below $25k, 3716.4% for AGIs $25k-50k, 6598.1% for AGIs $50k-75k, 9439.1% for AGIs $75k-100k, 14671.7% for AGIs $100k-200k, 90448.0% for AGIs over 200k)
Taxable interest for individuals: $1,833 (reported on 51.8% of returns)
This zip code:
$1,833
New York:
$3,075
(% of AGI for various income ranges: 41.3% for AGIs below $25k, 40.0% for AGIs $25k-50k, 106.2% for AGIs $50k-75k, 132.7% for AGIs $75k-100k, 175.2% for AGIs $100k-200k, 1386.0% for AGIs over 200k)
Ordinary dividends: $6,367 (reported on 30.4% of returns)
Here:
$6,367
State:
$11,095
(% of AGI for various income ranges: 63.0% for AGIs below $25k, 65.5% for AGIs $25k-50k, 268.8% for AGIs $50k-75k, 252.7% for AGIs $75k-100k, 327.0% for AGIs $100k-200k, 2996.0% for AGIs over 200k)
Net capital gain/loss in AGI: +$13,751 (reported on 26.8% of returns)
Here:
+$13,751
State:
+$44,925
(% of AGI for various income ranges: 3.9% for AGIs below $25k, 40.5% for AGIs $25k-50k, 136.9% for AGIs $50k-75k, 250.0% for AGIs $75k-100k, 341.3% for AGIs $100k-200k, 9622.0% for AGIs over 200k)
Profit/loss from business: +$10,036 (reported on 14.9% of returns)
Here:
+$10,036
State:
+$14,940
(% of AGI for various income ranges: 191.3% for AGIs below $25k, 126.8% for AGIs $25k-50k, 219.4% for AGIs $50k-75k, 49.1% for AGIs $75k-100k, 311.7% for AGIs $100k-200k, 1336.0% for AGIs over 200k)
Taxable individual retirement arrangement distribution: $18,248 (reported on 13.7% of returns)
11719:
$18,248
New York:
$19,609
(% of AGI for various income ranges: 80.9% for AGIs below $25k, 127.7% for AGIs $25k-50k, 210.0% for AGIs $50k-75k, 406.4% for AGIs $75k-100k, 756.1% for AGIs $100k-200k, 2416.0% for AGIs over 200k)
Total itemized deductions: $27,626 (reported on 18.5% of returns)
Here:
$27,626
State:
$39,326
(% of AGI for various income ranges: 419.1% for AGIs $25k-50k, 706.9% for AGIs $50k-75k, 969.1% for AGIs $75k-100k, 1221.3% for AGIs $100k-200k, 5272.0% for AGIs over 200k)
Charity contributions: $5,039 (reported on 16.7% of returns)
Here:
$5,039
State:
$15,420
(% of AGI for various income ranges: 26.4% for AGIs $25k-50k, 87.5% for AGIs $50k-75k, 98.2% for AGIs $75k-100k, 147.8% for AGIs $100k-200k, 1530.0% for AGIs over 200k)
Taxes paid: $9,519 (reported on 18.5% of returns)
11719:
$9,519
State:
$9,183
(% of AGI for various income ranges: 161.4% for AGIs $25k-50k, 228.8% for AGIs $50k-75k, 426.4% for AGIs $75k-100k, 441.3% for AGIs $100k-200k, 1492.0% for AGIs over 200k)
Earned income credit: $1,440 (reported on 6.0% of returns)
Here:
$1,440
State:
$2,138
(% of AGI for various income ranges: 28.7% for AGIs below $25k, 35.5% for AGIs $25k-50k)
Percentage of individuals using paid preparers for their 2020 taxes: 95.8%
Here:
96%
State:
95%
(% for various income ranges: 95.0% for AGIs below $25k, 96.7% for AGIs $25k-50k, 96.0% for AGIs $50k-75k, 94.4% for AGIs $75k-100k, 94.6% for AGIs $100k-200k, 100.0% for AGIs over 200k)
Averages for the 2012 tax year for zip code 11719, filed in 2013:
Average Adjusted Gross Income (AGI) in 2012: $84,369 (Individual Income Tax Returns)
Here:
$84,369
State:
$77,088
Salary/wage: $66,456 (reported on 79.8% of returns)
Here:
$66,456
State:
$60,593
(% of AGI for various income ranges: 70.2% for AGIs below $25k, 70.5% for AGIs $25k-50k, 69.6% for AGIs $50k-75k, 69.7% for AGIs $75k-100k, 71.3% for AGIs $100k-200k, 45.1% for AGIs over 200k)
Taxable interest for individuals: $1,528 (reported on 50.9% of returns)
This zip code:
$1,528
New York:
$3,125
(% of AGI for various income ranges: 1.9% for AGIs below $25k, 1.9% for AGIs $25k-50k, 1.2% for AGIs $50k-75k, 1.1% for AGIs $75k-100k, 0.5% for AGIs $100k-200k, 0.9% for AGIs over 200k)
Ordinary dividends: $6,500 (reported on 30.1% of returns)
Here:
$6,500
State:
$10,299
(% of AGI for various income ranges: 2.8% for AGIs below $25k, 2.2% for AGIs $25k-50k, 1.3% for AGIs $50k-75k, 2.0% for AGIs $75k-100k, 1.2% for AGIs $100k-200k, 4.1% for AGIs over 200k)
Net capital gain/loss in AGI: +$8,815 (reported on 23.9% of returns)
Here:
+$8,815
State:
+$42,474
(% of AGI for various income ranges: 0.7% for AGIs $25k-50k, 1.6% for AGIs $75k-100k, 0.7% for AGIs $100k-200k, 6.8% for AGIs over 200k)
Profit/loss from business: +$17,310 (reported on 17.8% of returns)
Here:
+$17,310
State:
+$16,168
(% of AGI for various income ranges: 11.4% for AGIs below $25k, 5.0% for AGIs $25k-50k, 2.0% for AGIs $50k-75k, 2.3% for AGIs $75k-100k, 3.1% for AGIs $100k-200k, 4.1% for AGIs over 200k)
Taxable individual retirement arrangement distribution: $15,362 (reported on 12.9% of returns)
11719:
$15,362
New York:
$17,621
(% of AGI for various income ranges: 1.9% for AGIs below $25k, 2.2% for AGIs $25k-50k, 3.4% for AGIs $50k-75k, 2.1% for AGIs $75k-100k, 4.3% for AGIs $100k-200k)
Total itemized deductions: $30,296 (25% of AGI, reported on 57.7% of returns)
Here:
$30,296
State:
$34,985
Here:
24.6% of AGI
State:
21.3% of AGI
(% of AGI for various income ranges: 23.9% for AGIs below $25k, 19.2% for AGIs $25k-50k, 23.9% for AGIs $50k-75k, 25.2% for AGIs $75k-100k, 21.4% for AGIs $100k-200k, 17.1% for AGIs over 200k)
Charity contributions: $2,840 (reported on 52.8% of returns)
Here:
$2,840
State:
$5,572
(% of AGI for various income ranges: 1.0% for AGIs below $25k, 1.7% for AGIs $25k-50k, 1.7% for AGIs $50k-75k, 2.1% for AGIs $75k-100k, 1.8% for AGIs $100k-200k, 1.7% for AGIs over 200k)
Taxes paid: $15,909 (reported on 57.7% of returns)
11719:
$15,909
State:
$18,656
(% of AGI for various income ranges: 8.9% for AGIs below $25k, 8.4% for AGIs $25k-50k, 10.7% for AGIs $50k-75k, 12.4% for AGIs $75k-100k, 11.0% for AGIs $100k-200k, 11.1% for AGIs over 200k)
Earned income credit: $1,946 (reported on 8.0% of returns)
Here:
$1,946
State:
$2,230
(% of AGI for various income ranges: 3.6% for AGIs below $25k, 0.6% for AGIs $25k-50k)
Percentage of individuals using paid preparers for their 2012 taxes: 74.8%
Here:
75%
State:
66%
(% for various income ranges: 65.9% for AGIs below $25k, 72.7% for AGIs $25k-50k, 78.3% for AGIs $50k-75k, 75.0% for AGIs $75k-100k, 82.4% for AGIs $100k-200k, 88.9% for AGIs over 200k)
Averages for the 2004 tax year for zip code 11719, filed in 2005:
Average Adjusted Gross Income (AGI) in 2004: $71,514 (Individual Income Tax Returns)
Here:
$71,514
State:
$59,519
Salary/wage: $62,758 (reported on 81.4% of returns)
Here:
$62,758
State:
$50,673
(% of AGI for various income ranges: 166.0% for AGIs below $10k, 67.7% for AGIs $10k-25k, 76.0% for AGIs $25k-50k, 73.7% for AGIs $50k-75k, 79.4% for AGIs $75k-100k, 67.4% for AGIs over 100k)
Taxable interest for individuals: $1,349 (reported on 70.8% of returns)
This zip code:
$1,349
New York:
$2,377
(% of AGI for various income ranges: 8.9% for AGIs below $10k, 3.2% for AGIs $10k-25k, 2.0% for AGIs $25k-50k, 2.1% for AGIs $50k-75k, 0.9% for AGIs $75k-100k, 0.9% for AGIs over 100k)
Taxable dividends: $3,462 (reported on 36.5% of returns)
Here:
$3,462
State:
$5,394
(% of AGI for various income ranges: 8.9% for AGIs below $10k, 2.7% for AGIs $10k-25k, 1.7% for AGIs $25k-50k, 1.9% for AGIs $50k-75k, 0.8% for AGIs $75k-100k, 1.9% for AGIs over 100k)
Net capital gain/loss: +$8,361 (reported on 28.5% of returns)
Here:
+$8,361
State:
+$23,581
(% of AGI for various income ranges: -0.9% for AGIs below $10k, -0.1% for AGIs $10k-25k, 0.1% for AGIs $25k-50k, 1.1% for AGIs $50k-75k, 0.0% for AGIs $75k-100k, 5.5% for AGIs over 100k)
Profit/loss from business: +$12,908 (reported on 18.5% of returns)
Here:
+$12,908
State:
+$13,809
(% of AGI for various income ranges: 26.0% for AGIs below $10k, 9.4% for AGIs $10k-25k, 4.1% for AGIs $25k-50k, 3.6% for AGIs $50k-75k, 0.6% for AGIs $75k-100k, 3.2% for AGIs over 100k)
IRA payment deduction: $3,782 (reported on 4.9% of returns)
11719:
$3,782
New York:
$3,115
(% of AGI for various income ranges: 0.9% for AGIs $10k-25k, 0.6% for AGIs $25k-50k, 0.5% for AGIs $50k-75k, 0.2% for AGIs over 100k)
Self-employed pension: $12,375 (reported on 1.0% of returns)
Here:
$12,375
New York:
$19,016
Total itemized deductions: $24,358 (23% of AGI, reported on 58.9% of returns)
Here:
$24,358
State:
$25,864
Here:
23.1% of AGI
State:
21.9% of AGI
(% of AGI for various income ranges: 28.5% for AGIs below $10k, 25.1% for AGIs $10k-25k, 22.2% for AGIs $25k-50k, 24.2% for AGIs $50k-75k, 23.9% for AGIs $75k-100k, 17.3% for AGIs over 100k)
Charity contributions deductions: $2,641 (2% of AGI, reported on 55.8% of returns)
Here:
$2,641
State:
$4,439
Here:
2.4% of AGI
State:
3.6% of AGI
(% of AGI for various income ranges: 1.7% for AGIs $10k-25k, 2.0% for AGIs $25k-50k, 2.5% for AGIs $50k-75k, 2.2% for AGIs $75k-100k, 2.0% for AGIs over 100k)
Total tax: $12,650 (reported on 82.9% of returns)
11719:
$12,650
State:
$11,730
(% of AGI for various income ranges: 5.5% for AGIs below $10k, 4.7% for AGIs $10k-25k, 7.7% for AGIs $25k-50k, 9.1% for AGIs $50k-75k, 9.6% for AGIs $75k-100k, 19.3% for AGIs over 100k)
Earned income credit: $1,105 (reported on 6.0% of returns)
Here:
$1,105
State:
$1,757
Percentage of individuals using paid preparers for their 2004 taxes: 73.8%
Here:
74%
State:
67%
(% for various income ranges: 67.5% for AGIs below $10k, 71.7% for AGIs $10k-25k, 68.3% for AGIs $25k-50k, 80.6% for AGIs $50k-75k, 78.0% for AGIs $75k-100k, 78.8% for AGIs over 100k)
Likely homosexual households (counted as self-reported same-sex unmarried-partner households)
Lesbian couples: 0.0% of all households
Gay men: 0.5% of all households
Household received Food Stamps/SNAP in the past 12 months: 77 Household did not receive Food Stamps/SNAP in the past 12 months: 1,044
Women who had a birth in the past 12 months: 14 (0 now married, 14 unmarried) Women who did not have a birth in the past 12 months: 633 (216 now married, 417 unmarried)
Housing units in zip code 11719 with a mortgage: 498 (25 second mortgage, 17 both second mortgage and home equity loan) Houses without a mortgage: 15
Median monthly owner costs for units with a mortgage: $3,003 Median monthly owner costs for units without a mortgage: $1,204
Residents with income below the poverty level in 2022:
This zip code:
14.7%
Whole state:
14.3%
Residents with income below 50% of the poverty level in 2022:
This zip code:
3.0%
Whole state:
6.8%
Median number of rooms in houses and condos:
Here:
6.7
State:
6.3
Median number of rooms in apartments:
Here:
3.4
State:
3.8
Notable locations in this zip code not listed on our city pages
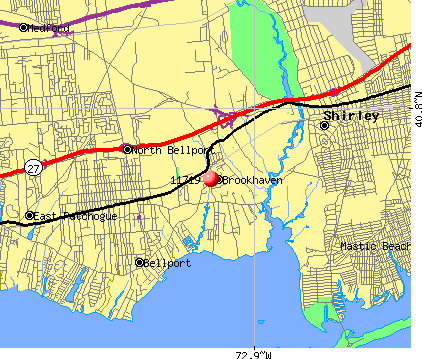
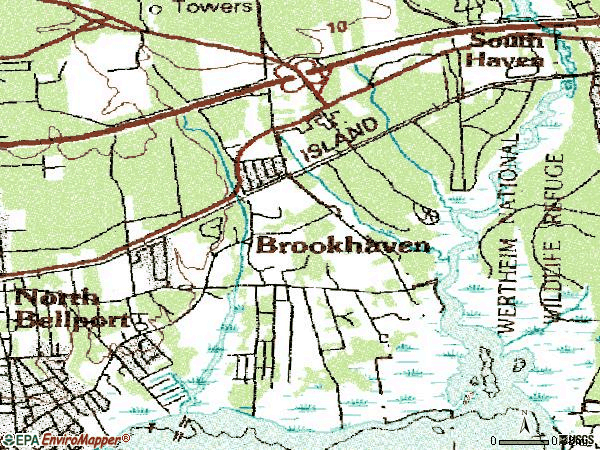
Notable locations in zip code 11719: Squassux Landing (A), Snow's Corner (B), Brookhaven Free Library (C), Bellhaven Center for Geriatric and Rehabilitative Care (D), Brookhaven Fire Department (E). Display/hide their locations on the map
Churches in zip code 11719 include: Saint James Episcopal Church (A), Old South Haven Church (B), Kingdom Hall of Jehovah's Witnesses (C). Display/hide their locations on the map
Cemeteries: David Hawkins Private Cemetery (1), Corwin Private Cemetery (2), Nathaniel Hawkins Cemetery (3), South Haven Presbyterian Cemetery (4), Samuel Carman and Nathaniel Miller Cemetery (5), Woodland Cemetery (6), Barteau Private Graveyard (7). Display/hide their locations on the map
In group quarters: 604 (-1 institutionalized population)
Size of family households: 390 2-persons, 86 3-persons, 117 4-persons, 70 5-persons, 22 6-persons, 49 7-or-more-persons
Size of nonfamily households: 329 1-person, 72 2-persons
385 married couples with children.
110 single-parent households (110 women).
92.0% of residents of 11719 zip code speak English at home.
4.6% of residents speak Spanish at home (55% very well, 16% well, 13% not well, 17% not at all).
2.3% of residents speak other Indo-European language at home (95% very well, 5% not well).
1.2% of residents speak other language at home (100% very well).
Foreign born population: 153 (4.4%) (63.1% of them are naturalized citizens)
This zip code:
4.4%
Whole state:
22.7%
25%Latvia
17%St. Vincent and the Grenadines
14%Haiti
12%Costa Rica
7%Iraq
7%Dominica
6%United Kingdom, excluding England and Scotland
26%Italian
15%Irish
11%German
3%Lithuanian
3%Norwegian
3%English
2%Turkish
Year of entry for the foreign-born population
252010 or later
532000 to 2009
591990 to 1999
65Before 1990
Facilities with environmental interests located in this zip code:
ISLAND VIEW APARTMENTS (BICYCLE PATH in BROOKHAVEN, NY)
STATE MASTER (New York facility tracking) - National Pollutant Discharge Elimination System Permit National Pollutant Discharge Elimination System NON-MAJOR (Tracking pollutant discharge elimination systems) - permit Business SIC classification: SERVICES Organizations: NYS APT BUILDERS V & VI, LTD (CONTACT/OWNER)
, CED CONSTRUCTION INC (LEGALLY RESPONSIBLE PARTY)
Alternative names: W.A.S.T.E., INC
BELLHAVEN NURSING CENTER (100 BEAVER DAM ROAD in BROOKHAVEN, NY)
STATE MASTER (New York facility tracking) - GROUNDWATER PROGRAM, National Pollutant Discharge Elimination System Permit, National Pollutant Discharge Elimination System NON-MAJOR (Tracking pollutant discharge elimination systems) - permit Business SIC classification: SERVICES Organizations: BELLHAVEN NURSING CENTER/CLARA DAVIS (LEGALLY RESPONSIBLE PARTY)
BELLPORT SHS ( in BROOKHAVEN, NY)
(National Center for Education Statistics) - STATE ID-580235060006 Organizations: SOUTH COUNTRY CSD (SCHOOL DISTRICT)
APEX AUTO BODY (2549 MONTAUK HWY in BROOKHAVEN, NY)
(Resource Conservation and Recovery Act (tracking hazardous waste))
ARNOLD (2461 MONTAUK HWY in BROOKHAVEN, NY)
(Resource Conservation and Recovery Act (tracking hazardous waste))
INTERPHARM INC (50 HORSEBLOCK RD - MAIN FLOOR in BROOKHAVEN, NY)
Small Quantity Generators, between 100 kg and 1000 kg of hazardous waste/month (Resource Conservation and Recovery Act (tracking hazardous waste)) Organizations: INTERPHARM HOLDINGS (CONTACT/OPERATOR)
AMOCO SERVICE STATION (S COUNTRY RD & OLD COUNTRY RD in SOUTH HAVEN, NY)
Conditionally Exempt Small Quantity Generators, less than 100 kg/month of hazardous waste (Resource Conservation and Recovery Act (tracking hazardous waste)) - notification Organizations: TARTON OIL (CONTACT/OWNER)
ARROW MILITARY KITTING (50 HORSEBLOCK RD in BROOKHAVEN, NY)
Small Quantity Generators, between 100 kg and 1000 kg of hazardous waste/month (Resource Conservation and Recovery Act (tracking hazardous waste)) - notification Organizations: STEVEN KAUFMAN CEO (CONTACT/OWNER)
BELLPORT SENIOR HIGH SCHOOL (205 BEAVER DAM ROAD in BROOKHAVEN, NY)
Small Quantity Generators, between 100 kg and 1000 kg of hazardous waste/month (Resource Conservation and Recovery Act (tracking hazardous waste)) Alternative names: BELLPORT HIGH SCHOOL
Housing units lacking complete plumbing facilities: 1.4%
71.3%Fuel oil, kerosene, etc.
19.1%Utility gas
4.2%Electricity
2.7%Bottled, tank, or LP gas
2.1%Other fuel
0.9%Wood
Population in 1990: 7,493.
Place of birth for U.S.-born residents:
This state: 2,816
Northeast: 147
Midwest: 73
South: 162
West: 43
66% of the 11719 zip code residents lived in the same house 5 years ago. Out of people who lived in different houses, 77% lived in this county. Out of people who lived in different counties, 50% lived in New York.
93% of the 11719 zip code residents lived in the same house 1 year ago. Out of people who lived in different houses, 85% moved from this county. Out of people who lived in different houses, 6% moved from different county within same state. Out of people who lived in different houses, 4% moved from abroad.
Private vs. public school enrollment:
Students in private schools in grades 1 to 8 (elementary and middle school): 15
Here:
3.8%
New York:
15.6%
Students in private schools in grades 9 to 12 (high school):
Here:
0.0%
New York:
15.0%
Students in private undergraduate colleges: 62
Here:
39.3%
New York:
39.2%
Occupation by median earnings in the past 12 months ($)
153,224Fire fighting and prevention, and other protective service workers including supervisors
121,332Health diagnosing and treating practitioners and other technical occupations
111,962Computer and mathematical occupations
110,643Arts, design, entertainment, sports, and media occupations
79,212Business and financial operations occupations
74,002Management occupations
Companies with federal contracts located in this zip code:
FIREWORKS BY GRUCCI INC (1 GRUCCI LN in BROOKHAVEN, NY; small business) : $1,206,505 in 3 contractsfrom 2000 to 2004
$1,134,200 with Army for Pyrotechnics. Signed on 2000-08-29. Completion date: 2002-05-30.
$39,305, same as above.Signed on 2001-01-22. Completion date: 2002-07-31.
$33,000 with Air Force for Explosive and Pyrotechnic Components, Nuclear Ordnance. Taking place in HI. Signed on 2004-05-17. Completion date: 2004-07-05.
Top industries in this zip code by the number of employees in 2005:
Health Care and Social Assistance: Nursing Care Facilities (250-499 employees: 2 establishments)
Health Care and Social Assistance: Home Health Care Services (50-99: 1)
Construction: All Other Specialty Trade Contractors (20-49: 1, 5-9: 1, 1-4: 1)
Professional, Scientific, and Technical Services: Engineering Services (20-49: 1)
Wholesale Trade: Fish and Seafood Merchant Wholesalers (20-49: 1)
Health Care and Social Assistance: Homes for the Elderly (20-49: 1)
Health Care and Social Assistance: Residential Mental Retardation Facilities (20-49: 1)
Administrative and Support and Waste Management and Remediation Services: Other Nonhazardous Waste Treatment and Disposal (20-49: 1)
People in group quarters in 2010:
236 people in nursing facilities/skilled-nursing facilities
209 people in emergency and transitional shelters (with sleeping facilities) for people experiencing homelessness
11 people in group homes intended for adults
People in group quarters in 2000:
238 people in nursing homes
Fatal accident statistics in 2013:
Fatal accident count: 3
Vehicles involved in fatal accidents: 5
Fatal accidents caused by drunken drivers: 0
Fatalities: 3
Persons involved in fatal accidents: 6
Pedestrians involved in fatal accidents: 1
Fatal accident statistics in 2010:
Fatal accident count: 1
Vehicles involved in fatal accidents: 2
Fatal accidents caused by drunken drivers: 1
Fatalities: 1
Persons involved in fatal accidents: 2
Pedestrians involved in fatal accidents: 0
Home Mortgage Disclosure Act Aggregated Statistics For Year 2009 (Based on 4 partial tracts)
A) FHA, FSA/RHS & VA Home Purchase Loans
B) Conventional Home Purchase Loans
C) Refinancings
D) Home Improvement Loans
F) Non-occupant Loans on < 5 Family Dwellings (A B C & D)
Number
Average Value
Number
Average Value
Number
Average Value
Number
Average Value
Number
Average Value
LOANS ORIGINATED
23
$217,565
31
$314,147
116
$248,580
5
$31,842
8
$485,349
APPLICATIONS APPROVED, NOT ACCEPTED
2
$271,285
2
$206,550
16
$256,008
0
$0
2
$68,590
APPLICATIONS DENIED
6
$175,228
15
$240,074
75
$250,339
4
$169,802
14
$167,561
APPLICATIONS WITHDRAWN
8
$239,275
3
$179,830
65
$252,991
2
$177,065
4
$174,485
FILES CLOSED FOR INCOMPLETENESS
0
$0
0
$0
10
$243,379
0
$0
1
$91,700
Aggregated Statistics For Year 2008 (Based on 4 partial tracts)
A) FHA, FSA/RHS & VA Home Purchase Loans
B) Conventional Home Purchase Loans
C) Refinancings
D) Home Improvement Loans
F) Non-occupant Loans on < 5 Family Dwellings (A B C & D)
Number
Average Value
Number
Average Value
Number
Average Value
Number
Average Value
Number
Average Value
LOANS ORIGINATED
21
$297,831
50
$219,414
97
$239,528
14
$111,062
18
$187,282
APPLICATIONS APPROVED, NOT ACCEPTED
4
$253,852
5
$285,876
18
$253,983
6
$205,313
6
$240,680
APPLICATIONS DENIED
5
$193,472
16
$239,435
92
$305,213
41
$87,306
16
$200,243
APPLICATIONS WITHDRAWN
6
$192,112
16
$264,198
42
$294,537
5
$101,978
2
$137,550
FILES CLOSED FOR INCOMPLETENESS
1
$320,950
4
$368,300
15
$227,282
0
$0
1
$171,480
Aggregated Statistics For Year 2007 (Based on 4 partial tracts)
A) FHA, FSA/RHS & VA Home Purchase Loans
B) Conventional Home Purchase Loans
C) Refinancings
D) Home Improvement Loans
F) Non-occupant Loans on < 5 Family Dwellings (A B C & D)
G) Loans On Manufactured Home Dwelling (A B C & D)
Number
Average Value
Number
Average Value
Number
Average Value
Number
Average Value
Number
Average Value
Number
Average Value
LOANS ORIGINATED
3
$257,983
156
$262,086
174
$230,682
68
$100,071
39
$203,836
2
$3,855
APPLICATIONS APPROVED, NOT ACCEPTED
0
$0
37
$203,421
69
$230,507
14
$139,983
14
$184,511
0
$0
APPLICATIONS DENIED
3
$175,453
100
$245,614
212
$246,053
66
$100,981
41
$205,347
0
$0
APPLICATIONS WITHDRAWN
0
$0
43
$236,917
79
$203,728
11
$112,625
19
$215,506
0
$0
FILES CLOSED FOR INCOMPLETENESS
0
$0
10
$327,043
37
$246,671
0
$0
10
$268,229
0
$0
Aggregated Statistics For Year 2006 (Based on 4 partial tracts)
A) FHA, FSA/RHS & VA Home Purchase Loans
B) Conventional Home Purchase Loans
C) Refinancings
D) Home Improvement Loans
F) Non-occupant Loans on < 5 Family Dwellings (A B C & D)
G) Loans On Manufactured Home Dwelling (A B C & D)
Number
Average Value
Number
Average Value
Number
Average Value
Number
Average Value
Number
Average Value
Number
Average Value
LOANS ORIGINATED
2
$289,315
326
$194,790
344
$222,330
56
$132,814
63
$175,110
3
$116,153
APPLICATIONS APPROVED, NOT ACCEPTED
2
$218,110
46
$169,383
69
$250,553
9
$30,646
22
$169,316
0
$0
APPLICATIONS DENIED
1
$315,450
163
$218,046
199
$237,130
68
$65,299
28
$232,739
0
$0
APPLICATIONS WITHDRAWN
2
$185,740
87
$196,009
125
$237,459
18
$110,613
17
$221,581
0
$0
FILES CLOSED FOR INCOMPLETENESS
0
$0
15
$294,163
48
$265,620
2
$52,310
4
$151,075
0
$0
Aggregated Statistics For Year 2005 (Based on 4 partial tracts)
A) FHA, FSA/RHS & VA Home Purchase Loans
B) Conventional Home Purchase Loans
C) Refinancings
D) Home Improvement Loans
F) Non-occupant Loans on < 5 Family Dwellings (A B C & D)
G) Loans On Manufactured Home Dwelling (A B C & D)
Number
Average Value
Number
Average Value
Number
Average Value
Number
Average Value
Number
Average Value
Number
Average Value
LOANS ORIGINATED
6
$225,607
253
$210,475
369
$215,596
68
$91,453
90
$205,034
0
$0
APPLICATIONS APPROVED, NOT ACCEPTED
1
$234,750
44
$189,426
86
$215,047
12
$124,118
21
$319,577
0
$0
APPLICATIONS DENIED
0
$0
75
$199,774
192
$234,314
56
$108,949
25
$165,788
2
$40,845
APPLICATIONS WITHDRAWN
1
$265,930
43
$246,489
133
$231,556
22
$131,328
14
$253,246
0
$0
FILES CLOSED FOR INCOMPLETENESS
0
$0
29
$243,665
89
$222,982
0
$0
6
$200,387
0
$0
Aggregated Statistics For Year 2004 (Based on 4 partial tracts)
A) FHA, FSA/RHS & VA Home Purchase Loans
B) Conventional Home Purchase Loans
C) Refinancings
D) Home Improvement Loans
F) Non-occupant Loans on < 5 Family Dwellings (A B C & D)
G) Loans On Manufactured Home Dwelling (A B C & D)
Number
Average Value
Number
Average Value
Number
Average Value
Number
Average Value
Number
Average Value
Number
Average Value
LOANS ORIGINATED
18
$204,643
212
$208,466
436
$180,344
74
$66,496
101
$149,701
5
$43,310
APPLICATIONS APPROVED, NOT ACCEPTED
0
$0
48
$233,527
80
$184,762
14
$45,980
29
$229,396
2
$40,845
APPLICATIONS DENIED
6
$213,718
47
$199,807
189
$193,618
84
$108,944
42
$156,081
0
$0
APPLICATIONS WITHDRAWN
2
$269,410
40
$204,217
179
$177,518
16
$133,969
29
$163,330
0
$0
FILES CLOSED FOR INCOMPLETENESS
0
$0
13
$202,765
65
$223,839
7
$131,456
7
$167,341
0
$0
Aggregated Statistics For Year 2003 (Based on 4 partial tracts)
A) FHA, FSA/RHS & VA Home Purchase Loans
B) Conventional Home Purchase Loans
C) Refinancings
D) Home Improvement Loans
F) Non-occupant Loans on < 5 Family Dwellings (A B C & D)
Number
Average Value
Number
Average Value
Number
Average Value
Number
Average Value
Number
Average Value
LOANS ORIGINATED
25
$181,023
167
$189,276
643
$169,575
58
$41,128
71
$115,725
APPLICATIONS APPROVED, NOT ACCEPTED
2
$215,375
33
$191,001
108
$153,477
10
$41,908
7
$117,121
APPLICATIONS DENIED
3
$106,067
45
$157,394
216
$156,699
56
$38,485
39
$140,233
APPLICATIONS WITHDRAWN
3
$155,183
28
$187,090
205
$165,189
12
$55,802
12
$175,793
FILES CLOSED FOR INCOMPLETENESS
0
$0
12
$194,911
33
$169,917
3
$82,207
2
$244,400
Aggregated Statistics For Year 2002 (Based on 4 partial tracts)
A) FHA, FSA/RHS & VA Home Purchase Loans
B) Conventional Home Purchase Loans
C) Refinancings
D) Home Improvement Loans
F) Non-occupant Loans on < 5 Family Dwellings (A B C & D)
Number
Average Value
Number
Average Value
Number
Average Value
Number
Average Value
Number
Average Value
LOANS ORIGINATED
36
$151,580
173
$173,634
381
$148,668
77
$25,086
56
$123,758
APPLICATIONS APPROVED, NOT ACCEPTED
1
$84,360
23
$209,905
72
$151,852
13
$25,855
6
$155,440
APPLICATIONS DENIED
7
$107,664
41
$138,632
178
$150,497
56
$31,789
20
$119,328
APPLICATIONS WITHDRAWN
6
$132,660
17
$204,569
155
$145,082
30
$44,291
15
$88,630
FILES CLOSED FOR INCOMPLETENESS
2
$131,590
7
$158,659
49
$144,592
2
$13,100
0
$0
Aggregated Statistics For Year 2001 (Based on 4 partial tracts)
A) FHA, FSA/RHS & VA Home Purchase Loans
B) Conventional Home Purchase Loans
C) Refinancings
D) Home Improvement Loans
F) Non-occupant Loans on < 5 Family Dwellings (A B C & D)
Number
Average Value
Number
Average Value
Number
Average Value
Number
Average Value
Number
Average Value
LOANS ORIGINATED
43
$123,745
157
$161,904
250
$135,475
51
$43,935
27
$92,237
APPLICATIONS APPROVED, NOT ACCEPTED
1
$69,690
24
$154,317
69
$112,129
12
$57,747
8
$123,212
APPLICATIONS DENIED
5
$117,010
28
$132,136
165
$117,233
44
$25,311
12
$102,917
APPLICATIONS WITHDRAWN
6
$99,133
7
$154,840
125
$109,192
17
$37,216
5
$126,212
FILES CLOSED FOR INCOMPLETENESS
1
$102,700
4
$93,992
25
$117,599
1
$34,850
2
$79,780
Aggregated Statistics For Year 2000 (Based on 4 partial tracts)
A) FHA, FSA/RHS & VA Home Purchase Loans
B) Conventional Home Purchase Loans
C) Refinancings
D) Home Improvement Loans
F) Non-occupant Loans on < 5 Family Dwellings (A B C & D)
Number
Average Value
Number
Average Value
Number
Average Value
Number
Average Value
Number
Average Value
LOANS ORIGINATED
23
$119,351
126
$131,228
120
$90,152
40
$23,744
37
$73,779
APPLICATIONS APPROVED, NOT ACCEPTED
4
$97,288
18
$110,254
29
$78,082
14
$20,722
5
$67,464
APPLICATIONS DENIED
7
$110,591
60
$98,666
121
$80,530
43
$27,952
25
$98,032
APPLICATIONS WITHDRAWN
8
$114,871
12
$94,163
137
$94,194
8
$24,040
8
$71,940
FILES CLOSED FOR INCOMPLETENESS
2
$50,095
3
$87,020
20
$110,533
2
$15,415
1
$96,290
Aggregated Statistics For Year 1999 (Based on 2 partial tracts)
A) FHA, FSA/RHS & VA Home Purchase Loans
B) Conventional Home Purchase Loans
C) Refinancings
D) Home Improvement Loans
F) Non-occupant Loans on < 5 Family Dwellings (A B C & D)
Detailed PMIC statistics for the following Tracts:1591.03
, 1592.04
2002 - 2018 National Fire Incident Reporting System (NFIRS) incidents
According to the data from the years 2002 - 2018 the average number of fire incidents per year is 8. The highest number of reported fire incidents - 22 took place in 2016, and the least - 0 in 2005. The data has a rising trend.
When looking into fire subcategories, the most reports belonged to: Structure Fires (40.4%), and Outside Fires (36.9%).
Fire incident types reported to NFIRS in Zip Code 11719


 Nearest zip codes: 11713, 11967, 11980, 11950, 11772, 11951.


 According to the data from the years 2002 - 2018 the average number of fire incidents per year is 8. The highest number of reported fire incidents - 22 took place in 2016, and the least - 0 in 2005. The data has a rising trend.
 When looking into fire subcategories, the most reports belonged to: Structure Fires (40.4%), and Outside Fires (36.9%).