Estimated zip code population in 2022: 6,464 Zip code population in 2010: 6,292 Zip code population in 2000: 6,218
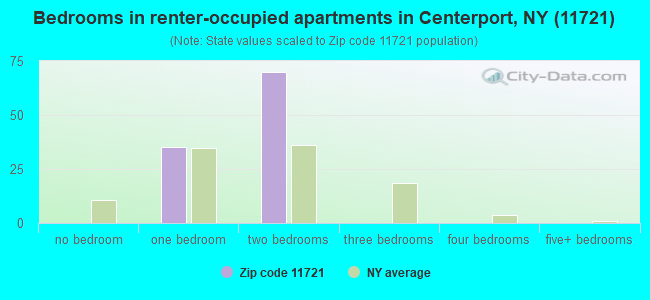
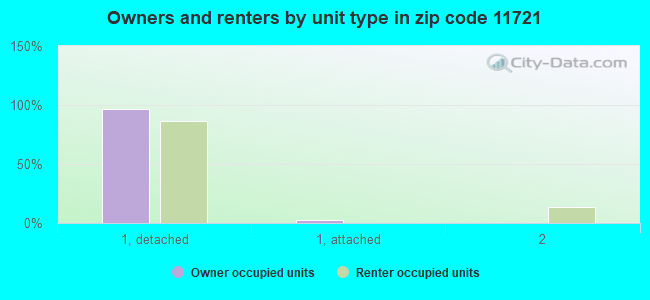
Houses and condos: 2,488 Renter-occupied apartments: 106
% of renters here:
4%
State:
46%
March 2022 cost of living index in zip code 11721: 151.2 (very high, U.S. average is 100)
Land area: 2.5 sq. mi. Water area: 1.4 sq. mi.
Population density: 2,596 people per square mile
(average).
OSM Map
General Map
Google Map
MSN Map
OSM Map
General Map
Google Map
MSN Map
OSM Map
General Map
Google Map
MSN Map
OSM Map
General Map
Google Map
MSN Map
Please wait while loading the map...
Real estate property taxes paid for housing units in 2022:
This zip code:
1.3% ($9,805)
New York:
1.5% ($6,180)
Median real estate property taxes paid for housing units with mortgages in 2022: $9,858 (1.3%) Median real estate property taxes paid for housing units with no mortgage in 2022: $9,755 (1.2%)
Business Search- 14 Million verified businesses
Males: 3,202
(49.5%)
Females: 3,262
(50.5%)
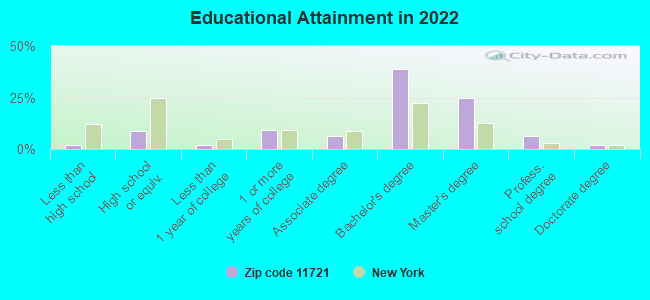
For population 25 years and over in 11721:
High school or higher: 99.1%
Bachelor's degree or higher: 72.9%
Graduate or professional degree: 33.8%
Unemployed: 8.1%
Mean travel time to work (commute): 35.6 minutes
For population 15 years and over in 11721:
Never married: 28.1%
Now married: 62.0%
Separated: 0.5%
Widowed: 3.7%
Divorced: 5.7%
Zip code 11721 compared to state average:
Median household income significantly above state average.
Median house value above state average.
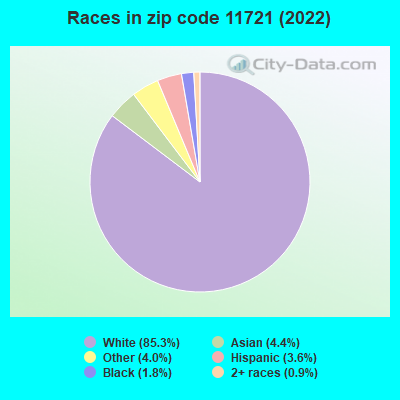
Black race population percentage significantly below state average.
Hispanic race population percentage significantly below state average.
Median age significantly above state average.
Foreign-born population percentage significantly below state average.
Renting percentage significantly below state average.
Length of stay since moving in significantly above state average.
Number of rooms per house significantly above state average.
Percentage of population with a bachelor's degree or higher above state average.
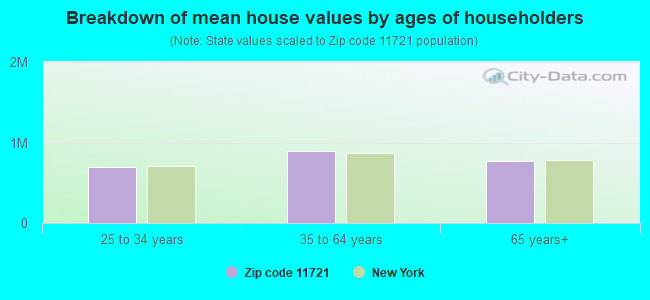
Estimated median house/condo value in 2022: $750,555
11721:
$750,555
New York:
$400,400
According to our research of New York and other state lists, there were 2 registered sex offenders living in 11721 zip code as of May 28, 2024. The ratio of all residents to sex offenders in zip code 11721 is 3,040 to 1. The ratio of registered sex offenders to all residents in this zip code is much lower than the state average.
Median resident age:
This zip code:
50.2 years
New York median age:
40.0 years
Average household size:
This zip code:
2.6 people
New York:
2.5 people
Averages for the 2020 tax year for zip code 11721, filed in 2021:
Average Adjusted Gross Income (AGI) in 2020: $166,170 (Individual Income Tax Returns)
Here:
$166,170
State:
$90,930
Salary/wage: $130,434 (reported on 77.6% of returns)
Here:
$130,434
State:
$72,104
(% of AGI for various income ranges: 1268.1% for AGIs below $25k, 3729.2% for AGIs $25k-50k, 7498.8% for AGIs $50k-75k, 10062.2% for AGIs $75k-100k, 19456.2% for AGIs $100k-200k, 94250.4% for AGIs over 200k)
Taxable interest for individuals: $2,311 (reported on 62.1% of returns)
This zip code:
$2,311
New York:
$3,075
(% of AGI for various income ranges: 34.1% for AGIs below $25k, 72.4% for AGIs $25k-50k, 252.9% for AGIs $50k-75k, 202.8% for AGIs $75k-100k, 275.6% for AGIs $100k-200k, 1144.2% for AGIs over 200k)
Ordinary dividends: $9,486 (reported on 48.7% of returns)
Here:
$9,486
State:
$11,095
(% of AGI for various income ranges: 102.7% for AGIs below $25k, 158.4% for AGIs $25k-50k, 454.7% for AGIs $50k-75k, 473.3% for AGIs $75k-100k, 1002.6% for AGIs $100k-200k, 3971.2% for AGIs over 200k)
Net capital gain/loss in AGI: +$27,897 (reported on 44.9% of returns)
Here:
+$27,897
State:
+$44,925
(% of AGI for various income ranges: 81.4% for AGIs below $25k, 185.6% for AGIs $25k-50k, 360.6% for AGIs $50k-75k, 443.9% for AGIs $75k-100k, 792.1% for AGIs $100k-200k, 15706.2% for AGIs over 200k)
Profit/loss from business: +$32,394 (reported on 18.1% of returns)
Here:
+$32,394
State:
+$14,940
(% of AGI for various income ranges: 165.7% for AGIs below $25k, 273.6% for AGIs $25k-50k, 481.8% for AGIs $50k-75k, 681.1% for AGIs $75k-100k, 1125.9% for AGIs $100k-200k, 5146.2% for AGIs over 200k)
Taxable individual retirement arrangement distribution: $23,048 (reported on 14.6% of returns)
11721:
$23,048
New York:
$19,609
(% of AGI for various income ranges: 97.6% for AGIs below $25k, 252.0% for AGIs $25k-50k, 532.9% for AGIs $50k-75k, 625.6% for AGIs $75k-100k, 1145.9% for AGIs $100k-200k, 1680.0% for AGIs over 200k)
Self-employed (Keogh) retirement plans: $30,750 (reported on 2.9% of returns)
11721:
$30,750
New York:
$32,497
(% of AGI for various income ranges: 104.1% for AGIs $100k-200k, 1112.1% for AGIs over 200k)
Total itemized deductions: $33,163 (reported on 27.4% of returns)
Here:
$33,163
State:
$39,326
(% of AGI for various income ranges: 265.4% for AGIs below $25k, 404.4% for AGIs $25k-50k, 1278.8% for AGIs $50k-75k, 1551.1% for AGIs $75k-100k, 1999.5% for AGIs $100k-200k, 6840.0% for AGIs over 200k)
Charity contributions: $5,379 (reported on 25.4% of returns)
Here:
$5,379
State:
$15,420
(% of AGI for various income ranges: 8.4% for AGIs below $25k, 37.2% for AGIs $25k-50k, 109.4% for AGIs $50k-75k, 129.4% for AGIs $75k-100k, 246.7% for AGIs $100k-200k, 1322.9% for AGIs over 200k)
Taxes paid: $9,560 (reported on 27.4% of returns)
11721:
$9,560
State:
$9,183
(% of AGI for various income ranges: 73.2% for AGIs below $25k, 147.6% for AGIs $25k-50k, 425.3% for AGIs $50k-75k, 530.0% for AGIs $75k-100k, 662.1% for AGIs $100k-200k, 1702.9% for AGIs over 200k)
Earned income credit: $1,450 (reported on 3.5% of returns)
Here:
$1,450
State:
$2,138
(% of AGI for various income ranges: 47.0% for AGIs below $25k)
Percentage of individuals using paid preparers for their 2020 taxes: 96.2%
Here:
96%
State:
95%
(% for various income ranges: 97.4% for AGIs below $25k, 94.9% for AGIs $25k-50k, 93.9% for AGIs $50k-75k, 97.1% for AGIs $75k-100k, 95.2% for AGIs $100k-200k, 97.4% for AGIs over 200k)
Averages for the 2012 tax year for zip code 11721, filed in 2013:
Average Adjusted Gross Income (AGI) in 2012: $141,126 (Individual Income Tax Returns)
Here:
$141,126
State:
$77,088
Salary/wage: $112,108 (reported on 80.9% of returns)
Here:
$112,108
State:
$60,593
(% of AGI for various income ranges: 64.2% for AGIs below $25k, 67.2% for AGIs $25k-50k, 63.1% for AGIs $50k-75k, 61.6% for AGIs $75k-100k, 73.5% for AGIs $100k-200k, 60.7% for AGIs over 200k)
Taxable interest for individuals: $1,767 (reported on 65.8% of returns)
This zip code:
$1,767
New York:
$3,125
(% of AGI for various income ranges: 2.8% for AGIs below $25k, 1.5% for AGIs $25k-50k, 1.7% for AGIs $50k-75k, 1.4% for AGIs $75k-100k, 0.7% for AGIs $100k-200k, 0.6% for AGIs over 200k)
Ordinary dividends: $6,335 (reported on 48.0% of returns)
Here:
$6,335
State:
$10,299
(% of AGI for various income ranges: 6.1% for AGIs below $25k, 4.4% for AGIs $25k-50k, 3.3% for AGIs $50k-75k, 2.8% for AGIs $75k-100k, 1.9% for AGIs $100k-200k, 1.9% for AGIs over 200k)
Net capital gain/loss in AGI: +$14,019 (reported on 40.6% of returns)
Here:
+$14,019
State:
+$42,474
(% of AGI for various income ranges: 0.3% for AGIs $25k-50k, 0.9% for AGIs $50k-75k, 1.5% for AGIs $75k-100k, 0.5% for AGIs $100k-200k, 6.4% for AGIs over 200k)
Profit/loss from business: +$31,998 (reported on 18.2% of returns)
Here:
+$31,998
State:
+$16,168
(% of AGI for various income ranges: 11.5% for AGIs below $25k, 2.8% for AGIs $25k-50k, 4.5% for AGIs $50k-75k, 3.1% for AGIs $75k-100k, 4.4% for AGIs $100k-200k, 3.9% for AGIs over 200k)
Taxable individual retirement arrangement distribution: $19,525 (reported on 16.0% of returns)
11721:
$19,525
New York:
$17,621
(% of AGI for various income ranges: 4.9% for AGIs below $25k, 4.6% for AGIs $25k-50k, 5.3% for AGIs $50k-75k, 4.4% for AGIs $75k-100k, 3.0% for AGIs $100k-200k, 1.2% for AGIs over 200k)
Self-employment retirement plans: $23,045 (reported on 3.4% of returns)
11721:
$23,045
New York:
$27,330
Total itemized deductions: $41,336 (21% of AGI, reported on 65.2% of returns)
Here:
$41,336
State:
$34,985
Here:
20.6% of AGI
State:
21.3% of AGI
(% of AGI for various income ranges: 32.2% for AGIs below $25k, 26.8% for AGIs $25k-50k, 24.2% for AGIs $50k-75k, 25.3% for AGIs $75k-100k, 22.6% for AGIs $100k-200k, 15.8% for AGIs over 200k)
Charity contributions: $3,295 (reported on 60.0% of returns)
Here:
$3,295
State:
$5,572
(% of AGI for various income ranges: 1.5% for AGIs below $25k, 1.8% for AGIs $25k-50k, 1.8% for AGIs $50k-75k, 2.0% for AGIs $75k-100k, 1.5% for AGIs $100k-200k, 1.2% for AGIs over 200k)
Taxes paid: $25,208 (reported on 64.9% of returns)
11721:
$25,208
State:
$18,656
(% of AGI for various income ranges: 12.1% for AGIs below $25k, 10.6% for AGIs $25k-50k, 11.5% for AGIs $50k-75k, 12.7% for AGIs $75k-100k, 12.4% for AGIs $100k-200k, 11.2% for AGIs over 200k)
Earned income credit: $1,546 (reported on 4.0% of returns)
Here:
$1,546
State:
$2,230
(% of AGI for various income ranges: 2.5% for AGIs below $25k)
Percentage of individuals using paid preparers for their 2012 taxes: 72.9%
Here:
73%
State:
66%
(% for various income ranges: 64.6% for AGIs below $25k, 66.7% for AGIs $25k-50k, 70.6% for AGIs $50k-75k, 78.1% for AGIs $75k-100k, 77.2% for AGIs $100k-200k, 82.1% for AGIs over 200k)
Averages for the 2004 tax year for zip code 11721, filed in 2005:
Average Adjusted Gross Income (AGI) in 2004: $105,572 (Individual Income Tax Returns)
Here:
$105,572
State:
$59,519
Salary/wage: $94,946 (reported on 77.1% of returns)
Here:
$94,946
State:
$50,673
(% of AGI for various income ranges: 122.2% for AGIs below $10k, 60.5% for AGIs $10k-25k, 67.2% for AGIs $25k-50k, 63.1% for AGIs $50k-75k, 71.9% for AGIs $75k-100k, 69.8% for AGIs over 100k)
Taxable interest for individuals: $2,511 (reported on 77.6% of returns)
This zip code:
$2,511
New York:
$2,377
(% of AGI for various income ranges: 19.6% for AGIs below $10k, 4.4% for AGIs $10k-25k, 3.0% for AGIs $25k-50k, 3.5% for AGIs $50k-75k, 1.8% for AGIs $75k-100k, 1.5% for AGIs over 100k)
Taxable dividends: $3,515 (reported on 54.8% of returns)
Here:
$3,515
State:
$5,394
(% of AGI for various income ranges: 20.2% for AGIs below $10k, 5.5% for AGIs $10k-25k, 3.2% for AGIs $25k-50k, 2.1% for AGIs $50k-75k, 1.7% for AGIs $75k-100k, 1.5% for AGIs over 100k)
Net capital gain/loss: +$11,139 (reported on 47.3% of returns)
Here:
+$11,139
State:
+$23,581
(% of AGI for various income ranges: -12.2% for AGIs below $10k, -0.8% for AGIs $10k-25k, 1.2% for AGIs $25k-50k, 0.9% for AGIs $50k-75k, 1.5% for AGIs $75k-100k, 6.3% for AGIs over 100k)
Profit/loss from business: +$23,309 (reported on 20.5% of returns)
Here:
+$23,309
State:
+$13,809
(% of AGI for various income ranges: 13.9% for AGIs below $10k, 10.4% for AGIs $10k-25k, 7.2% for AGIs $25k-50k, 7.6% for AGIs $50k-75k, 3.7% for AGIs $75k-100k, 3.9% for AGIs over 100k)
IRA payment deduction: $3,815 (reported on 4.0% of returns)
11721:
$3,815
New York:
$3,115
(% of AGI for various income ranges: 0.4% for AGIs $25k-50k, 0.4% for AGIs $50k-75k, 0.2% for AGIs $75k-100k, 0.1% for AGIs over 100k)
Self-employed pension: $15,221 (reported on 3.9% of returns)
Here:
$15,221
New York:
$19,016
(% of AGI for various income ranges: 0.7% for AGIs $50k-75k, 0.5% for AGIs $75k-100k, 0.6% for AGIs over 100k)
Total itemized deductions: $31,624 (21% of AGI, reported on 65.6% of returns)
Here:
$31,624
State:
$25,864
Here:
21.2% of AGI
State:
21.9% of AGI
(% of AGI for various income ranges: 59.8% for AGIs below $10k, 28.1% for AGIs $10k-25k, 24.0% for AGIs $25k-50k, 27.4% for AGIs $50k-75k, 24.6% for AGIs $75k-100k, 17.7% for AGIs over 100k)
Charity contributions deductions: $3,025 (2% of AGI, reported on 63.1% of returns)
Here:
$3,025
State:
$4,439
Here:
2.0% of AGI
State:
3.6% of AGI
(% of AGI for various income ranges: 1.7% for AGIs below $10k, 2.0% for AGIs $10k-25k, 2.1% for AGIs $25k-50k, 2.2% for AGIs $50k-75k, 2.5% for AGIs $75k-100k, 1.7% for AGIs over 100k)
Total tax: $22,095 (reported on 84.3% of returns)
11721:
$22,095
State:
$11,730
(% of AGI for various income ranges: 6.3% for AGIs below $10k, 5.2% for AGIs $10k-25k, 8.5% for AGIs $25k-50k, 9.4% for AGIs $50k-75k, 10.6% for AGIs $75k-100k, 20.2% for AGIs over 100k)
Earned income credit: $1,028 (reported on 3.4% of returns)
Here:
$1,028
State:
$1,757
Percentage of individuals using paid preparers for their 2004 taxes: 74.9%
Here:
75%
State:
67%
(% for various income ranges: 68.1% for AGIs below $10k, 69.4% for AGIs $10k-25k, 70.4% for AGIs $25k-50k, 76.6% for AGIs $50k-75k, 73.2% for AGIs $75k-100k, 81.8% for AGIs over 100k)
Household received Food Stamps/SNAP in the past 12 months: 56 Household did not receive Food Stamps/SNAP in the past 12 months: 2,344
Women who had a birth in the past 12 months: 72 (71 now married, 0 unmarried) Women who did not have a birth in the past 12 months: 1,336 (583 now married, 748 unmarried)
Housing units in zip code 11721 with a mortgage: 1,507 (373 second mortgage, 8 home equity loan, 322 both second mortgage and home equity loan) Median monthly owner costs for units with a mortgage: $3,857 Median monthly owner costs for units without a mortgage: $1,487
Residents with income below the poverty level in 2022:
This zip code:
9.3%
Whole state:
14.3%
Residents with income below 50% of the poverty level in 2022:
This zip code:
3.8%
Whole state:
6.8%
Median number of rooms in houses and condos:
Here:
7.4
State:
6.3
Median number of rooms in apartments:
Here:
4.0
State:
3.8
Notable locations in this zip code not listed on our city pages
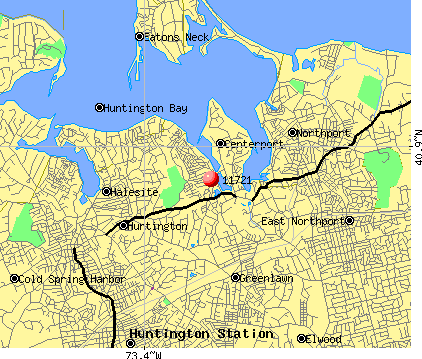
Churches in zip code 11721 include: Congregational Church of Huntington (A), Our Lady Queen of Martyrs Church (B), Centerport Methodist Church (C). Display/hide their locations on the map
Size of family households: 846 2-persons, 480 3-persons, 384 4-persons, 148 5-persons, 7 6-persons
Size of nonfamily households: 467 1-person, 66 2-persons, 17 3-persons
1,162 married couples with children.
121 single-parent households (121 women).
93.2% of residents of 11721 zip code speak English at home.
2.0% of residents speak Spanish at home (50% very well, 37% well, 12% not well).
2.3% of residents speak other Indo-European language at home (41% very well, 59% well).
1.6% of residents speak Asian or Pacific Island language at home (66% very well, 24% well, 9% not well).
0.7% of residents speak other language at home (82% very well, 18% well).
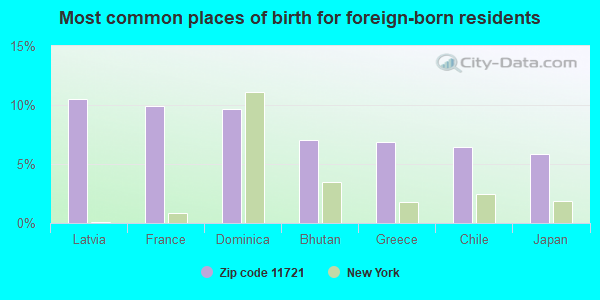
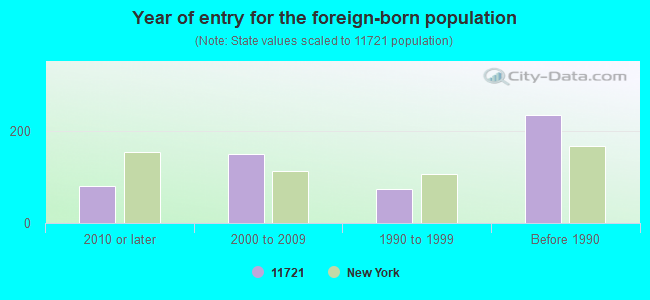
Foreign born population: 499 (7.7%) (77.2% of them are naturalized citizens)
This zip code:
7.7%
Whole state:
22.7%
11%Latvia
10%France
10%Dominica
7%Bhutan
7%Greece
6%Chile
6%Japan
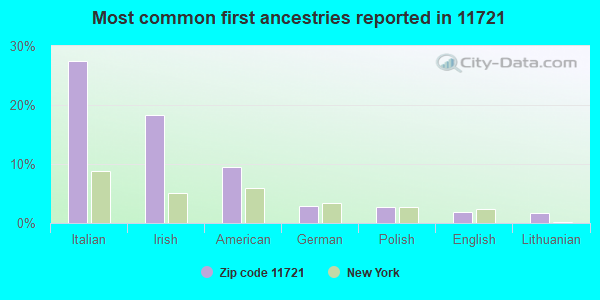
27%Italian
18%Irish
9%American
3%German
3%Polish
2%English
2%Lithuanian
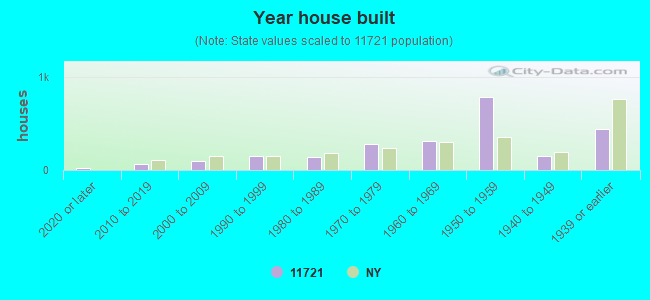
Year of entry for the foreign-born population
812010 or later
1512000 to 2009
751990 to 1999
235Before 1990
Facilities with environmental interests located in this zip code:
APPLIED VISIONS INC (75 LAUREL HILL RD in CENTERPORT, NY)
GREENLAWN WATER DISTRICT (STONY HOLLOW RD - 1500 FT N in CENTERPORT, NY)
(Resource Conservation and Recovery Act (tracking hazardous waste))
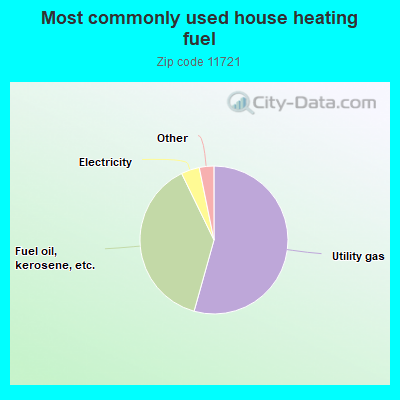
54.4%Utility gas
38.5%Fuel oil, kerosene, etc.
4.0%Electricity
0.9%Bottled, tank, or LP gas
0.8%Coal or coke
0.8%Wood
Population in 1990: 5,770. Population change in the 1990s: +448 (+7.8%).
Place of birth for U.S.-born residents:
This state: 5,227
Northeast: 318
Midwest: 85
South: 201
West: 55
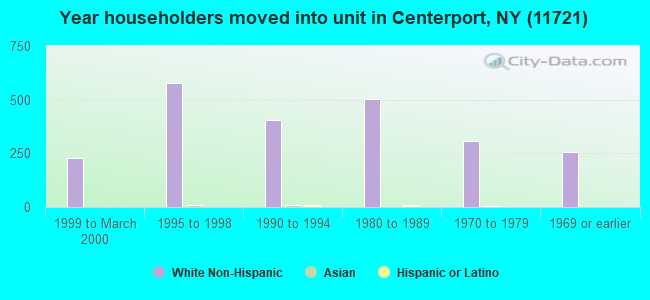
70% of the 11721 zip code residents lived in the same house 5 years ago. Out of people who lived in different houses, 61% lived in this county. Out of people who lived in different counties, 50% lived in New York.
93% of the 11721 zip code residents lived in the same house 1 year ago. Out of people who lived in different houses, 46% moved from this county. Out of people who lived in different houses, 37% moved from different county within same state. Out of people who lived in different houses, 10% moved from different state. Out of people who lived in different houses, 6% moved from abroad.
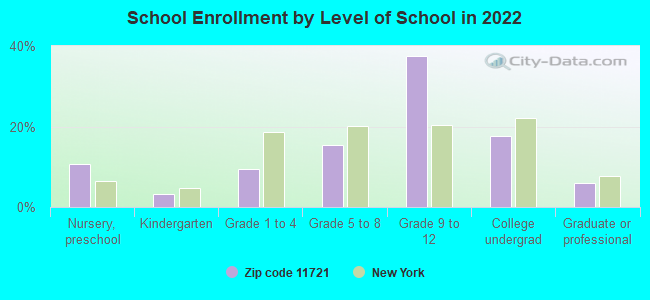
Private vs. public school enrollment:
Students in private schools in grades 1 to 8 (elementary and middle school): 18
Here:
4.8%
New York:
15.6%
Students in private schools in grades 9 to 12 (high school): 130
Here:
22.1%
New York:
15.0%
Students in private undergraduate colleges: 86
Here:
31.8%
New York:
39.2%
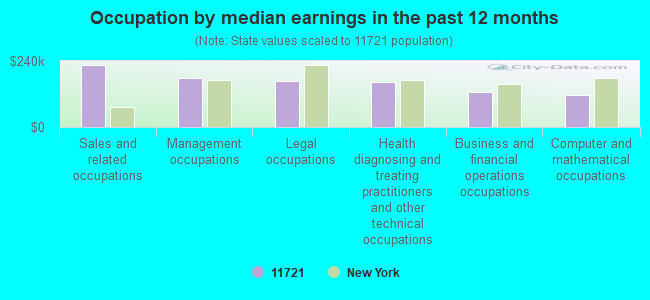
Occupation by median earnings in the past 12 months ($)
224,745Sales and related occupations
176,807Management occupations
168,184Legal occupations
163,209Health diagnosing and treating practitioners and other technical occupations
128,609Business and financial operations occupations
117,314Computer and mathematical occupations
Top industries in this zip code by the number of employees in 2005:
Other Services (except Public Administration): Religious Organizations (20-49 employees: 2 establishments, 10-19 employees: 1 establishment)
Arts, Entertainment, and Recreation: Museums (50-99: 1)
Accommodation and Food Services: Full-Service Restaurants (20-49: 1, 10-19: 1)
Arts, Entertainment, and Recreation: Marinas (20-49: 1, 1-4: 1)
Accommodation and Food Services: Caterers (20-49: 1)
Construction: Commercial and Institutional Building Construction (10-19: 1, 5-9: 1, 1-4: 1)
Finance and Insurance: Insurance Agencies and Brokerages (10-19: 1, 1-4: 2)
Professional, Scientific, and Technical Services: Administrative Management and General Management Consulting Services (5-9: 2, 1-4: 1)
Accommodation and Food Services: Hotels (except Casino Hotels) and Motels (10-19: 1)
Wholesale Trade: Stationery and Office Supplies Merchant Wholesalers (10-19: 1)
People in group quarters in 2000:
29 people in other noninstitutional group quarters
Fatal accident statistics in 2010:
Fatal accident count: 1
Vehicles involved in fatal accidents: 2
Fatal accidents caused by drunken drivers: 0
Fatalities: 1
Persons involved in fatal accidents: 2
Pedestrians involved in fatal accidents: 0
Home Mortgage Disclosure Act Aggregated Statistics For Year 2009 (Based on 4 partial tracts)
A) FHA, FSA/RHS & VA Home Purchase Loans
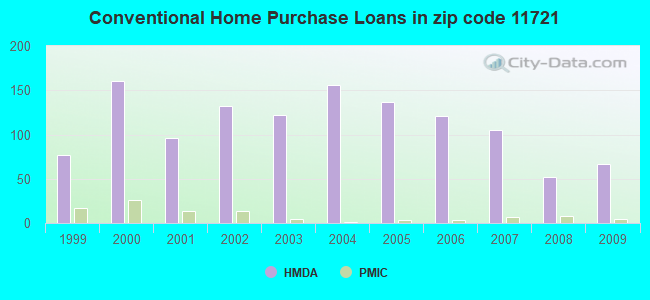
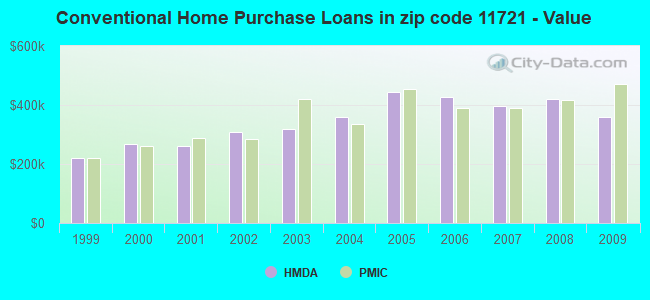
B) Conventional Home Purchase Loans
C) Refinancings
D) Home Improvement Loans
F) Non-occupant Loans on < 5 Family Dwellings (A B C & D)
Number
Average Value
Number
Average Value
Number
Average Value
Number
Average Value
Number
Average Value
LOANS ORIGINATED
12
$445,858
67
$360,353
170
$320,575
9
$259,790
1
$338,480
APPLICATIONS APPROVED, NOT ACCEPTED
2
$637,350
7
$461,901
25
$355,806
4
$9,778
0
$0
APPLICATIONS DENIED
2
$313,095
9
$368,886
56
$387,743
4
$318,805
2
$364,200
APPLICATIONS WITHDRAWN
2
$643,725
6
$520,287
44
$419,261
5
$218,884
1
$317,330
FILES CLOSED FOR INCOMPLETENESS
0
$0
1
$504,340
10
$320,841
1
$338,480
0
$0
Aggregated Statistics For Year 2008 (Based on 4 partial tracts)
A) FHA, FSA/RHS & VA Home Purchase Loans
B) Conventional Home Purchase Loans
C) Refinancings
D) Home Improvement Loans
F) Non-occupant Loans on < 5 Family Dwellings (A B C & D)
Number
Average Value
Number
Average Value
Number
Average Value
Number
Average Value
Number
Average Value
LOANS ORIGINATED
7
$425,123
52
$419,199
65
$310,124
12
$101,063
2
$276,790
APPLICATIONS APPROVED, NOT ACCEPTED
2
$321,405
18
$438,985
12
$281,473
0
$0
0
$0
APPLICATIONS DENIED
0
$0
17
$416,839
41
$356,990
7
$137,829
5
$330,330
APPLICATIONS WITHDRAWN
4
$373,305
11
$363,695
18
$441,437
0
$0
2
$183,920
FILES CLOSED FOR INCOMPLETENESS
0
$0
3
$378,837
6
$241,227
1
$169,240
2
$335,975
Aggregated Statistics For Year 2007 (Based on 4 partial tracts)
B) Conventional Home Purchase Loans
C) Refinancings
D) Home Improvement Loans
F) Non-occupant Loans on < 5 Family Dwellings (A B C & D)
Number
Average Value
Number
Average Value
Number
Average Value
Number
Average Value
LOANS ORIGINATED
105
$396,026
77
$315,448
25
$108,496
7
$304,964
APPLICATIONS APPROVED, NOT ACCEPTED
11
$354,403
28
$398,396
4
$60,800
3
$542,413
APPLICATIONS DENIED
19
$462,451
34
$362,574
5
$134,376
1
$534,800
APPLICATIONS WITHDRAWN
12
$401,177
22
$355,085
3
$474,163
1
$174,320
FILES CLOSED FOR INCOMPLETENESS
7
$373,837
10
$436,822
2
$136,575
2
$136,575
Aggregated Statistics For Year 2006 (Based on 4 partial tracts)
B) Conventional Home Purchase Loans
C) Refinancings
D) Home Improvement Loans
F) Non-occupant Loans on < 5 Family Dwellings (A B C & D)
Number
Average Value
Number
Average Value
Number
Average Value
Number
Average Value
LOANS ORIGINATED
121
$426,281
133
$312,642
38
$187,789
10
$359,851
APPLICATIONS APPROVED, NOT ACCEPTED
15
$413,499
27
$278,465
13
$57,774
4
$318,220
APPLICATIONS DENIED
26
$492,296
41
$502,533
13
$214,002
2
$482,565
APPLICATIONS WITHDRAWN
16
$544,509
49
$306,203
3
$274,627
0
$0
FILES CLOSED FOR INCOMPLETENESS
3
$629,083
24
$497,589
2
$165,010
0
$0
Aggregated Statistics For Year 2005 (Based on 4 partial tracts)
B) Conventional Home Purchase Loans
C) Refinancings
D) Home Improvement Loans
F) Non-occupant Loans on < 5 Family Dwellings (A B C & D)
Number
Average Value
Number
Average Value
Number
Average Value
Number
Average Value
LOANS ORIGINATED
137
$443,526
163
$301,117
36
$174,926
11
$547,740
APPLICATIONS APPROVED, NOT ACCEPTED
22
$371,973
30
$348,039
5
$218,900
4
$265,240
APPLICATIONS DENIED
14
$405,416
45
$348,788
15
$170,165
7
$349,631
APPLICATIONS WITHDRAWN
14
$461,291
58
$323,277
9
$136,087
4
$384,752
FILES CLOSED FOR INCOMPLETENESS
4
$364,788
34
$371,902
4
$177,548
0
$0
Aggregated Statistics For Year 2004 (Based on 4 partial tracts)
A) FHA, FSA/RHS & VA Home Purchase Loans
B) Conventional Home Purchase Loans
C) Refinancings
D) Home Improvement Loans
F) Non-occupant Loans on < 5 Family Dwellings (A B C & D)
G) Loans On Manufactured Home Dwelling (A B C & D)
Number
Average Value
Number
Average Value
Number
Average Value
Number
Average Value
Number
Average Value
Number
Average Value
LOANS ORIGINATED
0
$0
156
$357,792
175
$283,659
25
$126,619
11
$348,142
1
$8,460
APPLICATIONS APPROVED, NOT ACCEPTED
0
$0
20
$464,191
38
$246,820
13
$121,422
4
$259,492
0
$0
APPLICATIONS DENIED
0
$0
40
$348,003
72
$263,331
10
$60,588
7
$227,886
0
$0
APPLICATIONS WITHDRAWN
2
$217,610
15
$361,629
66
$281,666
8
$229,899
2
$158,425
0
$0
FILES CLOSED FOR INCOMPLETENESS
0
$0
4
$329,305
27
$322,646
8
$105,409
0
$0
0
$0
Aggregated Statistics For Year 2003 (Based on 4 partial tracts)
A) FHA, FSA/RHS & VA Home Purchase Loans
B) Conventional Home Purchase Loans
C) Refinancings
D) Home Improvement Loans
F) Non-occupant Loans on < 5 Family Dwellings (A B C & D)
Number
Average Value
Number
Average Value
Number
Average Value
Number
Average Value
Number
Average Value
LOANS ORIGINATED
0
$0
122
$317,094
568
$241,374
21
$76,477
20
$208,062
APPLICATIONS APPROVED, NOT ACCEPTED
1
$154,850
16
$274,964
115
$233,917
13
$62,182
3
$262,093
APPLICATIONS DENIED
0
$0
12
$371,462
106
$251,793
12
$77,700
4
$237,240
APPLICATIONS WITHDRAWN
0
$0
9
$346,616
125
$245,824
4
$19,052
1
$169,240
FILES CLOSED FOR INCOMPLETENESS
0
$0
11
$328,321
22
$257,795
2
$54,630
2
$250,385
Aggregated Statistics For Year 2002 (Based on 4 partial tracts)
A) FHA, FSA/RHS & VA Home Purchase Loans
B) Conventional Home Purchase Loans
C) Refinancings
D) Home Improvement Loans
F) Non-occupant Loans on < 5 Family Dwellings (A B C & D)
Number
Average Value
Number
Average Value
Number
Average Value
Number
Average Value
Number
Average Value
LOANS ORIGINATED
0
$0
132
$309,784
378
$395,780
73
$86,320
9
$247,439
APPLICATIONS APPROVED, NOT ACCEPTED
0
$0
16
$215,411
62
$226,861
10
$82,040
2
$227,625
APPLICATIONS DENIED
0
$0
5
$457,962
96
$259,359
13
$99,239
2
$227,625
APPLICATIONS WITHDRAWN
2
$165,710
8
$347,314
63
$217,019
7
$55,310
0
$0
FILES CLOSED FOR INCOMPLETENESS
0
$0
4
$280,830
34
$205,174
2
$9,105
4
$172,540
Aggregated Statistics For Year 2001 (Based on 4 partial tracts)
A) FHA, FSA/RHS & VA Home Purchase Loans
B) Conventional Home Purchase Loans
C) Refinancings
D) Home Improvement Loans
F) Non-occupant Loans on < 5 Family Dwellings (A B C & D)
Number
Average Value
Number
Average Value
Number
Average Value
Number
Average Value
Number
Average Value
LOANS ORIGINATED
2
$171,355
96
$260,853
274
$193,924
33
$61,495
11
$190,198
APPLICATIONS APPROVED, NOT ACCEPTED
0
$0
11
$256,907
48
$188,648
11
$48,319
3
$174,153
APPLICATIONS DENIED
0
$0
4
$270,275
56
$238,907
16
$53,424
4
$118,365
APPLICATIONS WITHDRAWN
0
$0
8
$170,061
42
$181,726
19
$74,971
0
$0
FILES CLOSED FOR INCOMPLETENESS
0
$0
7
$279,781
18
$194,868
0
$0
0
$0
Aggregated Statistics For Year 2000 (Based on 4 partial tracts)
A) FHA, FSA/RHS & VA Home Purchase Loans
B) Conventional Home Purchase Loans
C) Refinancings
D) Home Improvement Loans
F) Non-occupant Loans on < 5 Family Dwellings (A B C & D)
Number
Average Value
Number
Average Value
Number
Average Value
Number
Average Value
Number
Average Value
LOANS ORIGINATED
4
$163,890
161
$267,568
97
$149,825
44
$49,529
14
$181,624
APPLICATIONS APPROVED, NOT ACCEPTED
0
$0
20
$193,840
39
$179,213
13
$57,210
5
$224,530
APPLICATIONS DENIED
0
$0
28
$229,367
64
$144,912
24
$87,503
5
$284,076
APPLICATIONS WITHDRAWN
2
$131,110
3
$303,840
45
$99,884
3
$71,927
1
$29,620
FILES CLOSED FOR INCOMPLETENESS
0
$0
3
$198,470
7
$312,576
2
$45,525
0
$0
Aggregated Statistics For Year 1999 (Based on 2 partial tracts)
A) FHA, FSA/RHS & VA Home Purchase Loans
B) Conventional Home Purchase Loans
C) Refinancings
D) Home Improvement Loans
F) Non-occupant Loans on < 5 Family Dwellings (A B C & D)


 Nearest zip codes: 11740, 11768, 11743, 11731, 11746, 11724.