Estimated zip code population in 2022: 3,782 Zip code population in 2010: 4,056 Zip code population in 2000: 3,835
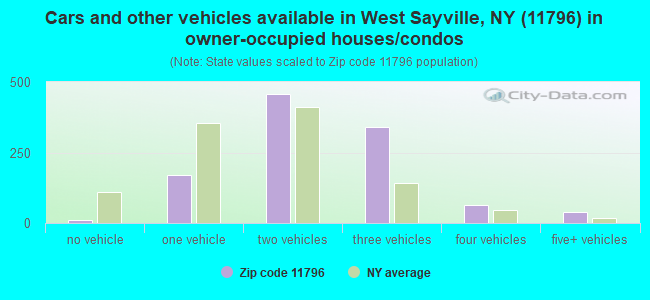
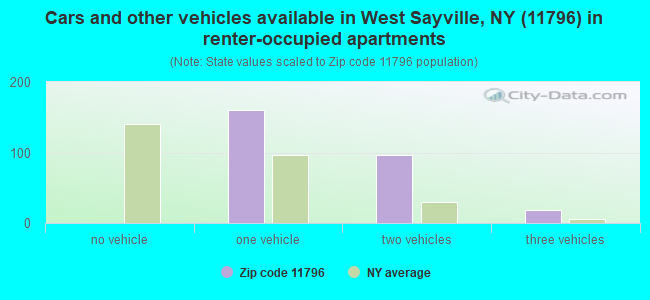
Houses and condos: 1,430 Renter-occupied apartments: 275
% of renters here:
20%
State:
46%
March 2022 cost of living index in zip code 11796: 148.5 (very high, U.S. average is 100)
Land area: 1.5 sq. mi. Water area: 0.0 sq. mi.
Population density: 2,583 people per square mile
(average).
OSM Map
General Map
Google Map
MSN Map
OSM Map
General Map
Google Map
MSN Map
OSM Map
General Map
Google Map
MSN Map
OSM Map
General Map
Google Map
MSN Map
Please wait while loading the map...
Real estate property taxes paid for housing units in 2022:
This zip code:
1.8% ($9,805)
New York:
1.5% ($6,180)
Median real estate property taxes paid for housing units with mortgages in 2022: $9,858 (1.7%) Median real estate property taxes paid for housing units with no mortgage in 2022: $9,755 (2.0%)
Business Search- 14 Million verified businesses
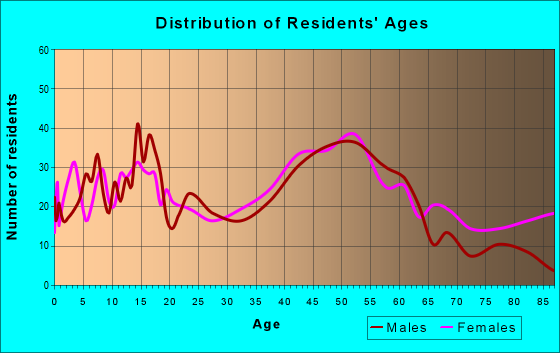
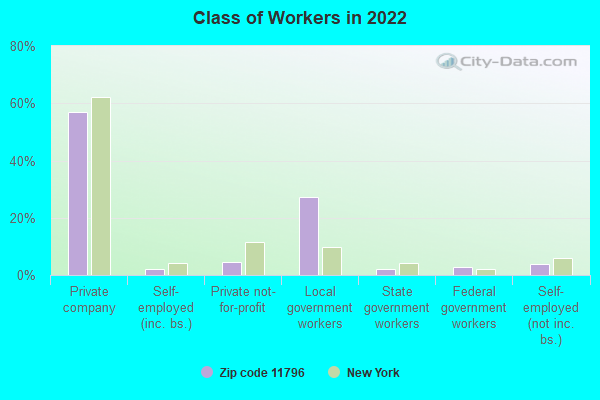
Males: 1,711
(45.3%)
Females: 2,070
(54.7%)
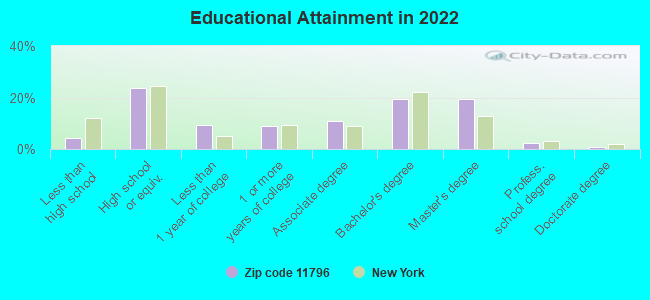
For population 25 years and over in 11796:
High school or higher: 96.0%
Bachelor's degree or higher: 42.4%
Graduate or professional degree: 22.9%
Unemployed: 4.1%
Mean travel time to work (commute): 29.8 minutes
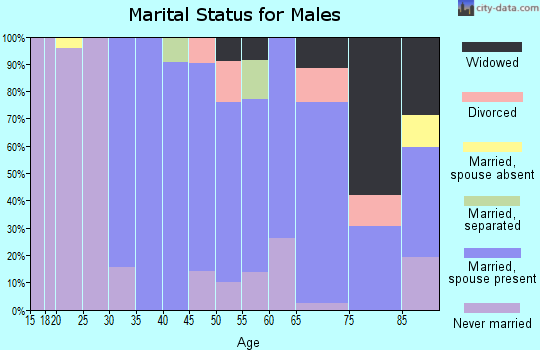
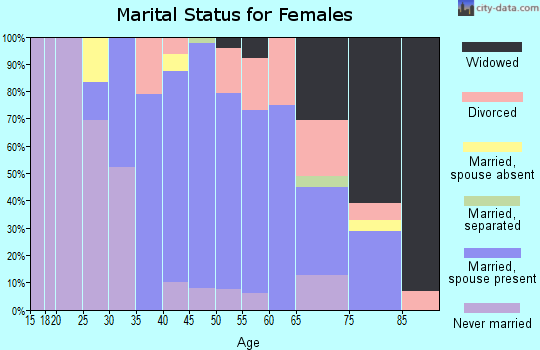
For population 15 years and over in 11796:
Never married: 31.1%
Now married: 56.2%
Separated: 0.0%
Widowed: 3.3%
Divorced: 9.5%
Zip code 11796 compared to state average:
Median household income above state average.
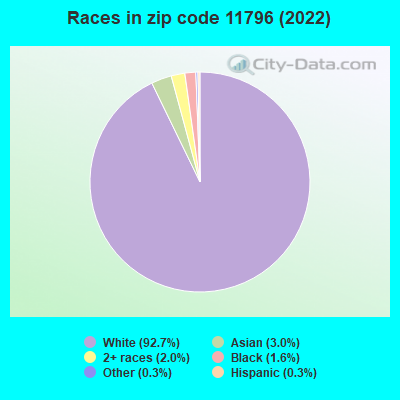
Black race population percentage significantly below state average.
Hispanic race population percentage significantly below state average.
Median age above state average.
Foreign-born population percentage significantly below state average.
Renting percentage significantly below state average.
Length of stay since moving in significantly above state average.
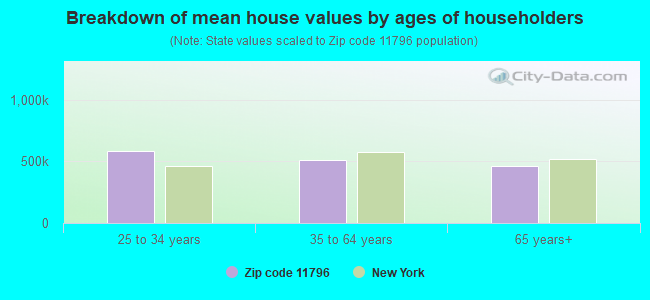
Estimated median house/condo value in 2022: $535,187
11796:
$535,187
New York:
$400,400
Median resident age:
This zip code:
46.2 years
New York median age:
40.0 years
Average household size:
This zip code:
2.7 people
New York:
2.5 people
Averages for the 2020 tax year for zip code 11796, filed in 2021:
Average Adjusted Gross Income (AGI) in 2020: $93,058 (Individual Income Tax Returns)
Here:
$93,058
State:
$90,930
Salary/wage: $84,784 (reported on 83.4% of returns)
Here:
$84,784
State:
$72,104
(% of AGI for various income ranges: 1172.6% for AGIs below $25k, 3567.3% for AGIs $25k-50k, 6217.2% for AGIs $50k-75k, 9532.7% for AGIs $75k-100k, 16068.6% for AGIs $100k-200k, 46835.6% for AGIs over 200k)
Taxable interest for individuals: $720 (reported on 53.4% of returns)
This zip code:
$720
New York:
$3,075
(% of AGI for various income ranges: 46.7% for AGIs below $25k, 50.0% for AGIs $25k-50k, 24.4% for AGIs $50k-75k, 60.7% for AGIs $75k-100k, 52.2% for AGIs $100k-200k, 203.3% for AGIs over 200k)
Ordinary dividends: $2,511 (reported on 28.0% of returns)
Here:
$2,511
State:
$11,095
(% of AGI for various income ranges: 33.0% for AGIs below $25k, 63.2% for AGIs $25k-50k, 103.9% for AGIs $50k-75k, 89.3% for AGIs $75k-100k, 127.5% for AGIs $100k-200k, 386.7% for AGIs over 200k)
Net capital gain/loss in AGI: +$7,061 (reported on 22.8% of returns)
Here:
+$7,061
State:
+$44,925
(% of AGI for various income ranges: 6.7% for AGIs below $25k, 32.7% for AGIs $25k-50k, 2.8% for AGIs $50k-75k, 81.3% for AGIs $75k-100k, 225.8% for AGIs $100k-200k, 2307.8% for AGIs over 200k)
Profit/loss from business: +$10,886 (reported on 11.4% of returns)
Here:
+$10,886
State:
+$14,940
(% of AGI for various income ranges: 37.8% for AGIs below $25k, 88.6% for AGIs $25k-50k, 324.0% for AGIs $75k-100k, 238.6% for AGIs $100k-200k, 836.7% for AGIs over 200k)
Taxable individual retirement arrangement distribution: $16,415 (reported on 10.4% of returns)
11796:
$16,415
New York:
$19,609
(% of AGI for various income ranges: 54.4% for AGIs below $25k, 127.3% for AGIs $25k-50k, 267.2% for AGIs $50k-75k, 260.7% for AGIs $75k-100k, 551.1% for AGIs $100k-200k)
Total itemized deductions: $25,057 (reported on 19.2% of returns)
Here:
$25,057
State:
$39,326
(% of AGI for various income ranges: 393.2% for AGIs $25k-50k, 710.6% for AGIs $50k-75k, 639.3% for AGIs $75k-100k, 1081.4% for AGIs $100k-200k, 2527.8% for AGIs over 200k)
Charity contributions: $3,715 (reported on 17.6% of returns)
Here:
$3,715
State:
$15,420
(% of AGI for various income ranges: 33.2% for AGIs $25k-50k, 57.2% for AGIs $50k-75k, 96.0% for AGIs $75k-100k, 135.0% for AGIs $100k-200k, 507.8% for AGIs over 200k)
Taxes paid: $9,159 (reported on 19.2% of returns)
11796:
$9,159
State:
$9,183
(% of AGI for various income ranges: 151.4% for AGIs $25k-50k, 263.9% for AGIs $50k-75k, 262.7% for AGIs $75k-100k, 408.6% for AGIs $100k-200k, 795.6% for AGIs over 200k)
Earned income credit: $1,522 (reported on 4.7% of returns)
Here:
$1,522
State:
$2,138
(% of AGI for various income ranges: 28.9% for AGIs below $25k, 26.8% for AGIs $25k-50k)
Percentage of individuals using paid preparers for their 2020 taxes: 95.9%
Here:
96%
State:
95%
(% for various income ranges: 93.0% for AGIs below $25k, 96.7% for AGIs $25k-50k, 96.0% for AGIs $50k-75k, 100.0% for AGIs $75k-100k, 96.3% for AGIs $100k-200k, 94.7% for AGIs over 200k)
Averages for the 2012 tax year for zip code 11796, filed in 2013:
Average Adjusted Gross Income (AGI) in 2012: $74,679 (Individual Income Tax Returns)
Here:
$74,679
State:
$77,088
Salary/wage: $71,558 (reported on 84.2% of returns)
Here:
$71,558
State:
$60,593
(% of AGI for various income ranges: 69.1% for AGIs below $25k, 73.9% for AGIs $25k-50k, 74.3% for AGIs $50k-75k, 72.5% for AGIs $75k-100k, 83.8% for AGIs $100k-200k, 89.0% for AGIs over 200k)
Taxable interest for individuals: $495 (reported on 54.3% of returns)
This zip code:
$495
New York:
$3,125
(% of AGI for various income ranges: 1.9% for AGIs below $25k, 0.5% for AGIs $25k-50k, 0.4% for AGIs $50k-75k, 0.4% for AGIs $75k-100k, 0.2% for AGIs $100k-200k, 0.1% for AGIs over 200k)
Ordinary dividends: $1,596 (reported on 26.6% of returns)
Here:
$1,596
State:
$10,299
(% of AGI for various income ranges: 1.7% for AGIs below $25k, 0.8% for AGIs $25k-50k, 0.5% for AGIs $50k-75k, 0.5% for AGIs $75k-100k, 0.3% for AGIs $100k-200k, 0.8% for AGIs over 200k)
Profit/loss from business: +$8,382 (reported on 12.0% of returns)
Here:
+$8,382
State:
+$16,168
(% of AGI for various income ranges: 2.6% for AGIs below $25k, 3.6% for AGIs $25k-50k, 1.2% for AGIs $50k-75k, 1.4% for AGIs $75k-100k, 1.3% for AGIs $100k-200k)
Taxable individual retirement arrangement distribution: $9,840 (reported on 10.9% of returns)
11796:
$9,840
New York:
$17,621
(% of AGI for various income ranges: 4.6% for AGIs below $25k, 3.2% for AGIs $25k-50k, 1.0% for AGIs $50k-75k, 1.5% for AGIs $75k-100k, 1.5% for AGIs $100k-200k)
Total itemized deductions: $27,792 (24% of AGI, reported on 53.8% of returns)
Here:
$27,792
State:
$34,985
Here:
24.3% of AGI
State:
21.3% of AGI
(% of AGI for various income ranges: 19.2% for AGIs below $25k, 14.4% for AGIs $25k-50k, 20.6% for AGIs $50k-75k, 21.6% for AGIs $75k-100k, 21.3% for AGIs $100k-200k, 18.3% for AGIs over 200k)
Charity contributions: $2,476 (reported on 50.5% of returns)
Here:
$2,476
State:
$5,572
(% of AGI for various income ranges: 1.5% for AGIs below $25k, 1.5% for AGIs $25k-50k, 1.8% for AGIs $50k-75k, 1.9% for AGIs $75k-100k, 1.7% for AGIs $100k-200k, 1.6% for AGIs over 200k)
Taxes paid: $13,945 (reported on 53.8% of returns)
11796:
$13,945
State:
$18,656
(% of AGI for various income ranges: 8.3% for AGIs below $25k, 5.7% for AGIs $25k-50k, 9.5% for AGIs $50k-75k, 10.9% for AGIs $75k-100k, 10.9% for AGIs $100k-200k, 10.2% for AGIs over 200k)
Earned income credit: $1,533 (reported on 6.5% of returns)
Here:
$1,533
State:
$2,230
(% of AGI for various income ranges: 2.5% for AGIs below $25k, 0.3% for AGIs $25k-50k)
Percentage of individuals using paid preparers for their 2012 taxes: 72.3%
Here:
72%
State:
66%
(% for various income ranges: 62.3% for AGIs below $25k, 66.7% for AGIs $25k-50k, 82.6% for AGIs $50k-75k, 76.2% for AGIs $75k-100k, 79.5% for AGIs $100k-200k, 80.0% for AGIs over 200k)
Averages for the 2004 tax year for zip code 11796, filed in 2005:
Average Adjusted Gross Income (AGI) in 2004: $59,052 (Individual Income Tax Returns)
Here:
$59,052
State:
$59,519
Salary/wage: $57,577 (reported on 84.6% of returns)
Here:
$57,577
State:
$50,673
(% of AGI for various income ranges: 83.4% for AGIs below $10k, 68.2% for AGIs $10k-25k, 75.9% for AGIs $25k-50k, 80.2% for AGIs $50k-75k, 85.6% for AGIs $75k-100k, 85.0% for AGIs over 100k)
Taxable interest for individuals: $769 (reported on 69.1% of returns)
This zip code:
$769
New York:
$2,377
(% of AGI for various income ranges: 5.8% for AGIs below $10k, 3.9% for AGIs $10k-25k, 1.5% for AGIs $25k-50k, 1.0% for AGIs $50k-75k, 0.5% for AGIs $75k-100k, 0.5% for AGIs over 100k)
Taxable dividends: $1,173 (reported on 31.7% of returns)
Here:
$1,173
State:
$5,394
(% of AGI for various income ranges: 4.8% for AGIs below $10k, 2.2% for AGIs $10k-25k, 1.2% for AGIs $25k-50k, 0.5% for AGIs $50k-75k, 0.4% for AGIs $75k-100k, 0.4% for AGIs over 100k)
Net capital gain/loss: +$1,112 (reported on 22.5% of returns)
Here:
+$1,112
State:
+$23,581
(% of AGI for various income ranges: -2.9% for AGIs below $10k, -1.1% for AGIs $10k-25k, 0.1% for AGIs $25k-50k, -0.4% for AGIs $50k-75k, 0.0% for AGIs $75k-100k, 1.2% for AGIs over 100k)
Profit/loss from business: +$6,657 (reported on 11.1% of returns)
Here:
+$6,657
State:
+$13,809
(% of AGI for various income ranges: -0.6% for AGIs below $10k, 2.7% for AGIs $10k-25k, 2.1% for AGIs $25k-50k, 1.6% for AGIs $50k-75k, 0.5% for AGIs $75k-100k, 1.1% for AGIs over 100k)
IRA payment deduction: $2,922 (reported on 3.6% of returns)
11796:
$2,922
New York:
$3,115
Total itemized deductions: $22,966 (26% of AGI, reported on 55.7% of returns)
Here:
$22,966
State:
$25,864
Here:
26.2% of AGI
State:
21.9% of AGI
(% of AGI for various income ranges: 17.4% for AGIs below $10k, 19.9% for AGIs $10k-25k, 19.0% for AGIs $25k-50k, 24.4% for AGIs $50k-75k, 24.8% for AGIs $75k-100k, 20.3% for AGIs over 100k)
Charity contributions deductions: $2,624 (3% of AGI, reported on 53.6% of returns)
Here:
$2,624
State:
$4,439
Here:
2.9% of AGI
State:
3.6% of AGI
(% of AGI for various income ranges: 0.7% for AGIs below $10k, 2.1% for AGIs $10k-25k, 2.0% for AGIs $25k-50k, 2.6% for AGIs $50k-75k, 2.6% for AGIs $75k-100k, 2.4% for AGIs over 100k)
Total tax: $7,997 (reported on 80.6% of returns)
11796:
$7,997
State:
$11,730
(% of AGI for various income ranges: 2.1% for AGIs below $10k, 4.4% for AGIs $10k-25k, 7.5% for AGIs $25k-50k, 7.8% for AGIs $50k-75k, 8.5% for AGIs $75k-100k, 14.9% for AGIs over 100k)
Earned income credit: $1,052 (reported on 5.4% of returns)
Here:
$1,052
State:
$1,757
Percentage of individuals using paid preparers for their 2004 taxes: 67.8%
Here:
68%
State:
67%
(% for various income ranges: 56.7% for AGIs below $10k, 60.4% for AGIs $10k-25k, 65.7% for AGIs $25k-50k, 74.9% for AGIs $50k-75k, 76.0% for AGIs $75k-100k, 74.6% for AGIs over 100k)
Household received Food Stamps/SNAP in the past 12 months: 32 Household did not receive Food Stamps/SNAP in the past 12 months: 1,326
Women who had a birth in the past 12 months: 42 (28 now married, 14 unmarried) Women who did not have a birth in the past 12 months: 761 (305 now married, 454 unmarried)
Housing units in zip code 11796 with a mortgage: 759 (63 second mortgage, 56 both second mortgage and home equity loan) Houses without a mortgage: 26
Median monthly owner costs for units with a mortgage: $3,040 Median monthly owner costs for units without a mortgage: $1,298
Residents with income below the poverty level in 2022:
This zip code:
4.9%
Whole state:
14.3%
Residents with income below 50% of the poverty level in 2022:
This zip code:
1.2%
Whole state:
6.8%
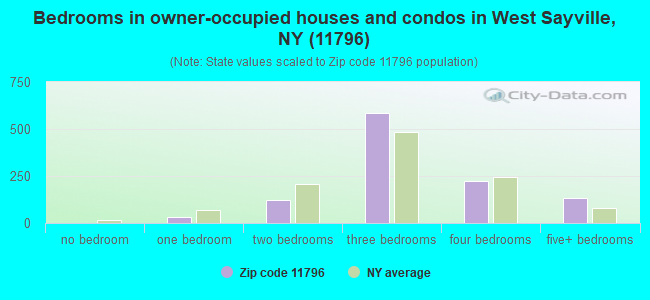
Median number of rooms in houses and condos:
Here:
6.9
State:
6.3
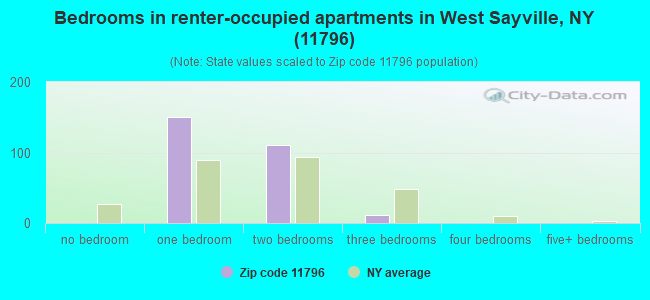
Median number of rooms in apartments:
Here:
3.9
State:
3.8
Notable locations in this zip code not listed on our city pages
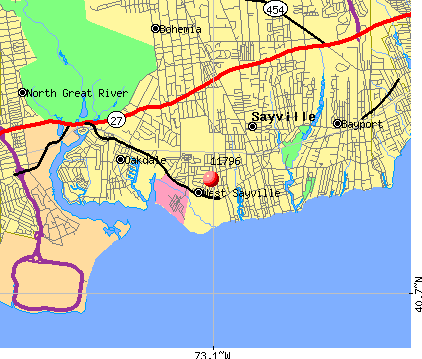
Notable locations in zip code 11796: West Sayville Golf Course (A), West Sayville Fire Department (B), Suffolk County Marine Museum West (C). Display/hide their locations on the map
Churches in zip code 11796 include: Christian Reformed Church (A), House of Judah (B), West Sayville Reformed Bible Church (C), Saint Mary's Malankara Orthodox Church (D). Display/hide their locations on the map
In group quarters: 107 (-1 institutionalized population)
Size of family households: 505 2-persons, 218 3-persons, 285 4-persons, 35 5-persons, 16 6-persons, 20 7-or-more-persons
Size of nonfamily households: 232 1-person, 50 2-persons, 5 3-persons
573 married couples with children.
109 single-parent households (23 men, 86 women).
95.4% of residents of 11796 zip code speak English at home.
0.5% of residents speak Spanish at home (100% very well).
1.2% of residents speak other Indo-European language at home (100% very well).
2.2% of residents speak Asian or Pacific Island language at home (77% very well, 23% well).
0.3% of residents speak other language at home (100% very well).
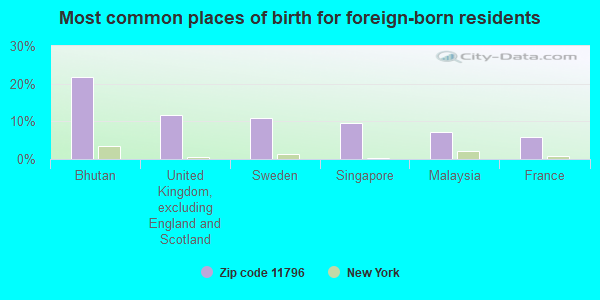
Foreign born population: 138 (3.7%) (68.7% of them are naturalized citizens)
This zip code:
3.7%
Whole state:
22.7%
22%Bhutan
12%United Kingdom, excluding England and Scotland
11%Sweden
9%Singapore
7%Malaysia
6%France
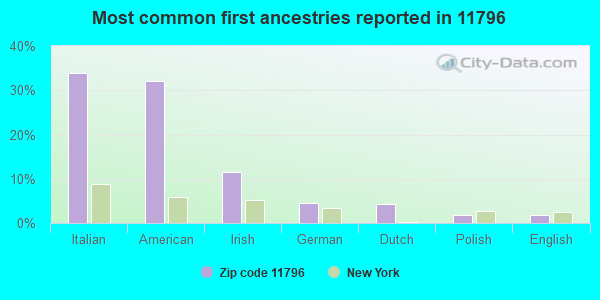
34%Italian
32%American
12%Irish
5%German
4%Dutch
2%Polish
2%English
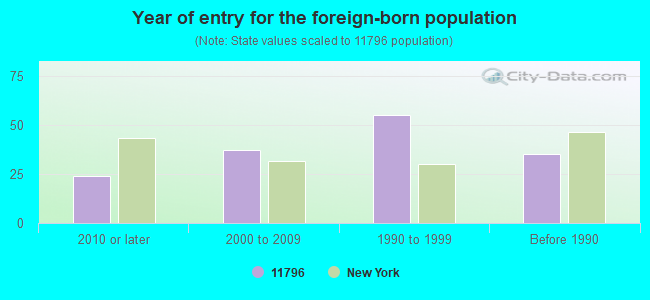
Year of entry for the foreign-born population
242010 or later
372000 to 2009
551990 to 1999
35Before 1990
Facilities with environmental interests located in this zip code:
CHERRY AVE ES ( in WEST SAYVILLE, NY)
(National Center for Education Statistics) - STATE ID-580504030001 Organizations: SAYVILLE UFSD (SCHOOL DISTRICT)
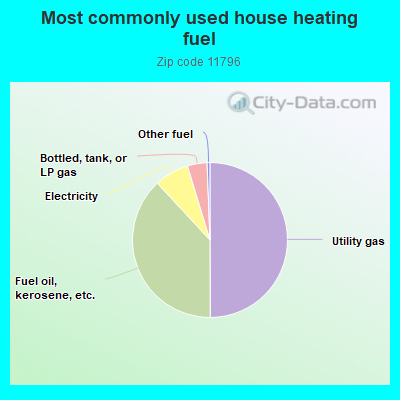
50.0%Utility gas
38.2%Fuel oil, kerosene, etc.
7.2%Electricity
4.1%Bottled, tank, or LP gas
0.6%Other fuel
Population in 1990: 3,575. Population change in the 1990s: +260 (+7.3%).
Place of birth for U.S.-born residents:
This state: 3,327
Northeast: 168
Midwest: 9
South: 38
West: 69
75% of the 11796 zip code residents lived in the same house 5 years ago. Out of people who lived in different houses, 81% lived in this county. Out of people who lived in different counties, 50% lived in New York.
86% of the 11796 zip code residents lived in the same house 1 year ago. Out of people who lived in different houses, 77% moved from this county. Out of people who lived in different houses, 5% moved from different county within same state. Out of people who lived in different houses, 16% moved from different state.
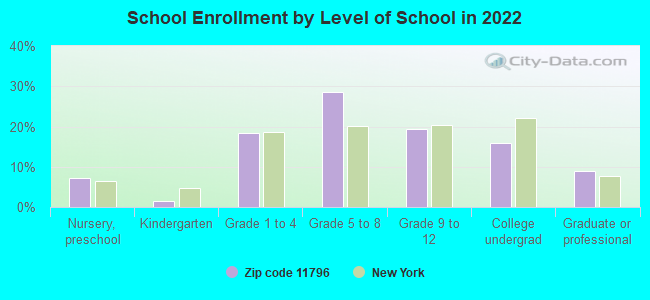
Private vs. public school enrollment:
Students in private schools in grades 1 to 8 (elementary and middle school):
Here:
0.0%
New York:
15.6%
Students in private schools in grades 9 to 12 (high school):
Here:
0.0%
New York:
15.0%
Students in private undergraduate colleges: 97
Here:
81.7%
New York:
39.2%
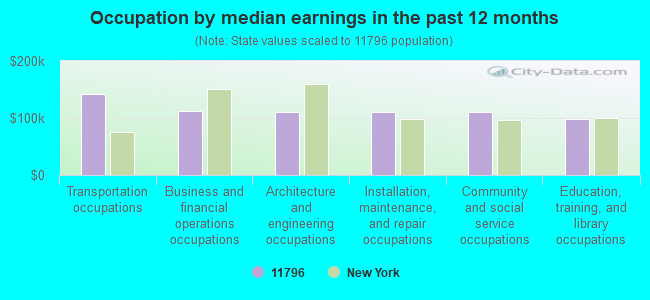
Occupation by median earnings in the past 12 months ($)
141,620Transportation occupations
112,356Business and financial operations occupations
110,756Architecture and engineering occupations
110,023Installation, maintenance, and repair occupations
109,894Community and social service occupations
97,803Education, training, and library occupations
Companies with federal contracts located in this zip code:
PECK & HALE LLC (180 DIVISION AVE in WEST SAYVILLE, NY; small business) : $30,131,326 in 232 contractsfrom 1999 to 2006
Contracts for Building Components, Prefabricated, Parachutes; Aerial Pick Up, Delivery, Recovery Systems; and Cargo Tie Down Equipment, Aircraft Ground Servicing Equipment, Miscellaneous Materials Handling Equipment, and moreby Minerals Management Service, Defense Logistics Agency, Navy, Army, and others Signed by year:2000: $3,573,653; 2001: $2,912,168; 2002: $3,853,430; 2003: $3,722,095; 2004: $7,089,259; 2005: $5,914,508; 2006: $2,934,938.
Biggest contracts:
$2,291,000 with Minerals Management Service for Building Components, Prefabricated. Signed on 2004-05-12. Completion date: 2004-06-15.
$1,773,328 with Defense Logistics Agency for Parachutes; Aerial Pick Up, Delivery, Recovery Systems; and Cargo Tie Down Equipment. Signed on 2005-03-24. Completion date: 2005-09-04.
$1,277,088 with Navy for Aircraft Ground Servicing Equipment. Signed on 2002-04-13. Completion date: 2003-06-13.
$1,192,018 with Defense Logistics Agency for Parachutes; Aerial Pick Up, Delivery, Recovery Systems; and Cargo Tie Down Equipment. Signed on 2004-02-09. Completion date: 2004-06-23.
AERO GROUP (120 EASY STREET in WEST SAYVILLE, NY; small business) : $105,343 in 2 contractsfrom 1999 to 2002
$87,636 with Navy for Photographic Equipment and Accessories. Signed on 1999-12-07. Completion date: 2000-01-28.
$17,707 with Army for Aircraft Maintenance and Repair Shop Specialized Equipment. Taking place in WI. Signed on 2002-09-30. Completion date: 2002-11-29.
Top industries in this zip code by the number of employees in 2005:
Health Care and Social Assistance: Offices of Physicians (except Mental Health Specialists) (20-49 employees: 1 establishment, 10-19 employees: 1 establishment, 5-9 employees: 1 establishment, 1-4 employees: 3 establishments)
Professional, Scientific, and Technical Services: Public Relations Agencies (20-49: 1)
Educational Services: Elementary and Secondary Schools (20-49: 1)
Accommodation and Food Services: Caterers (20-49: 1)
Construction: New Single-Family Housing Construction (except Operative Builders) (10-19: 1, 5-9: 1, 1-4: 1)
Accommodation and Food Services: Full-Service Restaurants (10-19: 1, 1-4: 2)
Other Services (except Public Administration): Funeral Homes and Funeral Services (10-19: 1)
People in group quarters in 2010:
265 people in nursing facilities/skilled-nursing facilities
47 people in residential treatment centers for adults
26 people in group homes intended for adults
People in group quarters in 2000:
39 people in other noninstitutional group quarters
27 people in mental (psychiatric) hospitals or wards
11 people in homes for the mentally ill
Home Mortgage Disclosure Act Aggregated Statistics For Year 2009 (Based on 2 partial tracts)
A) FHA, FSA/RHS & VA Home Purchase Loans
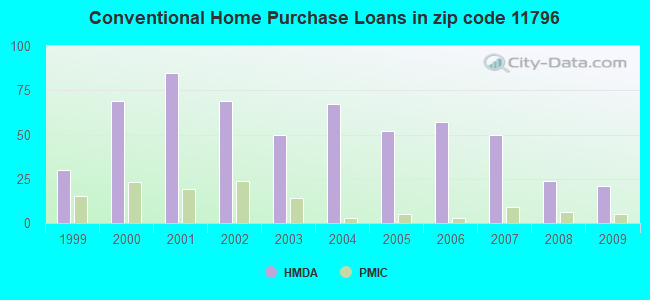
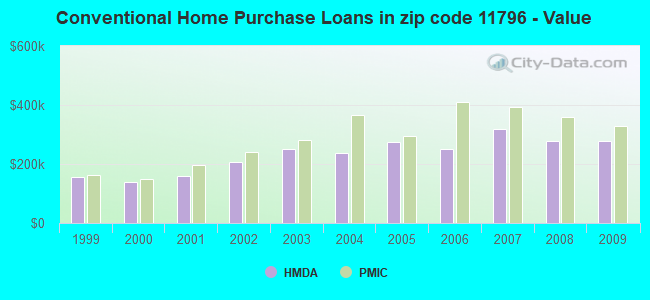
B) Conventional Home Purchase Loans
C) Refinancings
D) Home Improvement Loans
F) Non-occupant Loans on < 5 Family Dwellings (A B C & D)
Number
Average Value
Number
Average Value
Number
Average Value
Number
Average Value
Number
Average Value
LOANS ORIGINATED
17
$373,496
21
$277,969
85
$257,377
6
$75,478
1
$330,940
APPLICATIONS APPROVED, NOT ACCEPTED
0
$0
2
$394,810
12
$321,459
7
$74,649
0
$0
APPLICATIONS DENIED
1
$461,000
6
$196,437
30
$289,758
3
$195,080
1
$220,630
APPLICATIONS WITHDRAWN
1
$438,930
0
$0
34
$259,972
1
$375,070
1
$322,810
FILES CLOSED FOR INCOMPLETENESS
1
$282,170
2
$406,420
5
$329,084
1
$58,060
0
$0
Aggregated Statistics For Year 2008 (Based on 2 partial tracts)
A) FHA, FSA/RHS & VA Home Purchase Loans
B) Conventional Home Purchase Loans
C) Refinancings
D) Home Improvement Loans
F) Non-occupant Loans on < 5 Family Dwellings (A B C & D)
Number
Average Value
Number
Average Value
Number
Average Value
Number
Average Value
Number
Average Value
LOANS ORIGINATED
3
$423,837
24
$279,510
52
$263,302
14
$57,562
0
$0
APPLICATIONS APPROVED, NOT ACCEPTED
0
$0
2
$191,600
6
$242,497
2
$177,665
1
$232,240
APPLICATIONS DENIED
0
$0
7
$347,033
20
$293,784
6
$130,055
1
$390,160
APPLICATIONS WITHDRAWN
0
$0
3
$379,713
15
$281,475
3
$38,707
0
$0
FILES CLOSED FOR INCOMPLETENESS
0
$0
1
$1,161,200
2
$330,360
1
$185,790
0
$0
Aggregated Statistics For Year 2007 (Based on 2 partial tracts)
A) FHA, FSA/RHS & VA Home Purchase Loans
B) Conventional Home Purchase Loans
C) Refinancings
D) Home Improvement Loans
F) Non-occupant Loans on < 5 Family Dwellings (A B C & D)
Number
Average Value
Number
Average Value
Number
Average Value
Number
Average Value
Number
Average Value
LOANS ORIGINATED
0
$0
50
$317,913
92
$216,539
23
$101,378
1
$313,520
APPLICATIONS APPROVED, NOT ACCEPTED
0
$0
6
$305,588
15
$250,432
6
$99,283
1
$313,520
APPLICATIONS DENIED
1
$427,320
5
$171,394
60
$308,357
13
$154,975
1
$637,500
APPLICATIONS WITHDRAWN
0
$0
6
$254,883
14
$262,431
3
$123,087
1
$278,690
FILES CLOSED FOR INCOMPLETENESS
0
$0
1
$406,420
6
$235,917
1
$83,610
0
$0
Aggregated Statistics For Year 2006 (Based on 2 partial tracts)
B) Conventional Home Purchase Loans
C) Refinancings
D) Home Improvement Loans
F) Non-occupant Loans on < 5 Family Dwellings (A B C & D)
Number
Average Value
Number
Average Value
Number
Average Value
Number
Average Value
LOANS ORIGINATED
57
$250,310
121
$203,229
26
$113,083
2
$298,430
APPLICATIONS APPROVED, NOT ACCEPTED
6
$228,563
23
$176,805
6
$28,837
0
$0
APPLICATIONS DENIED
15
$226,743
36
$255,529
12
$125,797
2
$142,245
APPLICATIONS WITHDRAWN
5
$215,984
51
$229,144
3
$76,640
0
$0
FILES CLOSED FOR INCOMPLETENESS
3
$460,610
23
$288,331
2
$415,130
0
$0
Aggregated Statistics For Year 2005 (Based on 2 partial tracts)
A) FHA, FSA/RHS & VA Home Purchase Loans
B) Conventional Home Purchase Loans
C) Refinancings
D) Home Improvement Loans
F) Non-occupant Loans on < 5 Family Dwellings (A B C & D)
G) Loans On Manufactured Home Dwelling (A B C & D)
Number
Average Value
Number
Average Value
Number
Average Value
Number
Average Value
Number
Average Value
Number
Average Value
LOANS ORIGINATED
1
$416,870
52
$273,731
141
$216,214
23
$110,970
7
$356,654
0
$0
APPLICATIONS APPROVED, NOT ACCEPTED
0
$0
7
$264,256
20
$203,906
1
$299,590
2
$330,940
0
$0
APPLICATIONS DENIED
0
$0
22
$222,792
64
$246,247
12
$178,534
1
$88,250
1
$87,090
APPLICATIONS WITHDRAWN
0
$0
12
$231,272
44
$192,416
7
$146,643
3
$362,293
0
$0
FILES CLOSED FOR INCOMPLETENESS
0
$0
3
$397,130
38
$223,317
1
$17,420
0
$0
0
$0
Aggregated Statistics For Year 2004 (Based on 2 partial tracts)
B) Conventional Home Purchase Loans
C) Refinancings
D) Home Improvement Loans
F) Non-occupant Loans on < 5 Family Dwellings (A B C & D)
Number
Average Value
Number
Average Value
Number
Average Value
Number
Average Value
LOANS ORIGINATED
67
$238,687
178
$208,468
43
$98,297
13
$318,437
APPLICATIONS APPROVED, NOT ACCEPTED
7
$219,136
24
$201,178
8
$76,204
3
$258,173
APPLICATIONS DENIED
6
$207,662
59
$228,540
10
$91,386
0
$0
APPLICATIONS WITHDRAWN
2
$326,880
51
$216,917
6
$112,250
3
$334,813
FILES CLOSED FOR INCOMPLETENESS
2
$275,785
31
$250,257
7
$63,866
0
$0
Aggregated Statistics For Year 2003 (Based on 2 partial tracts)
A) FHA, FSA/RHS & VA Home Purchase Loans
B) Conventional Home Purchase Loans
C) Refinancings
D) Home Improvement Loans
E) Loans on Dwellings For 5+ Families
F) Non-occupant Loans on < 5 Family Dwellings (A B C & D)
Number
Average Value
Number
Average Value
Number
Average Value
Number
Average Value
Number
Average Value
Number
Average Value
LOANS ORIGINATED
6
$259,722
50
$252,515
359
$170,499
23
$35,190
1
$945,220
6
$204,178
APPLICATIONS APPROVED, NOT ACCEPTED
0
$0
10
$265,915
43
$148,823
5
$47,144
0
$0
0
$0
APPLICATIONS DENIED
1
$279,850
7
$206,860
80
$201,933
8
$45,578
0
$0
5
$248,032
APPLICATIONS WITHDRAWN
0
$0
2
$355,325
86
$184,725
10
$33,443
0
$0
2
$161,985
FILES CLOSED FOR INCOMPLETENESS
0
$0
6
$228,950
17
$195,901
1
$116,120
0
$0
2
$218,885
Aggregated Statistics For Year 2002 (Based on 2 partial tracts)
A) FHA, FSA/RHS & VA Home Purchase Loans
B) Conventional Home Purchase Loans
C) Refinancings
D) Home Improvement Loans
F) Non-occupant Loans on < 5 Family Dwellings (A B C & D)
Number
Average Value
Number
Average Value
Number
Average Value
Number
Average Value
Number
Average Value
LOANS ORIGINATED
6
$201,855
69
$207,098
239
$156,597
37
$49,053
6
$188,115
APPLICATIONS APPROVED, NOT ACCEPTED
0
$0
8
$160,100
49
$154,392
10
$51,209
0
$0
APPLICATIONS DENIED
1
$283,330
3
$270,560
64
$167,467
31
$70,309
3
$310,427
APPLICATIONS WITHDRAWN
0
$0
6
$172,825
55
$149,837
9
$45,029
1
$159,080
FILES CLOSED FOR INCOMPLETENESS
0
$0
2
$232,240
7
$187,284
0
$0
2
$220,045
Aggregated Statistics For Year 2001 (Based on 2 partial tracts)
A) FHA, FSA/RHS & VA Home Purchase Loans
B) Conventional Home Purchase Loans
C) Refinancings
D) Home Improvement Loans
E) Loans on Dwellings For 5+ Families
F) Non-occupant Loans on < 5 Family Dwellings (A B C & D)
Number
Average Value
Number
Average Value
Number
Average Value
Number
Average Value
Number
Average Value
Number
Average Value
LOANS ORIGINATED
5
$207,854
85
$157,664
182
$136,875
33
$63,373
1
$150,960
3
$132,377
APPLICATIONS APPROVED, NOT ACCEPTED
0
$0
7
$147,307
34
$126,332
5
$40,642
0
$0
0
$0
APPLICATIONS DENIED
1
$218,310
7
$189,110
53
$145,632
15
$52,796
0
$0
3
$209,017
APPLICATIONS WITHDRAWN
0
$0
6
$135,860
38
$135,922
12
$48,287
0
$0
2
$33,095
FILES CLOSED FOR INCOMPLETENESS
0
$0
1
$156,760
12
$98,896
1
$34,840
0
$0
0
$0
Aggregated Statistics For Year 2000 (Based on 2 partial tracts)
A) FHA, FSA/RHS & VA Home Purchase Loans
B) Conventional Home Purchase Loans
C) Refinancings
D) Home Improvement Loans
E) Loans on Dwellings For 5+ Families
F) Non-occupant Loans on < 5 Family Dwellings (A B C & D)
Number
Average Value
Number
Average Value
Number
Average Value
Number
Average Value
Number
Average Value
Number
Average Value
LOANS ORIGINATED
6
$167,987
69
$137,661
62
$93,907
45
$39,223
1
$203,210
2
$119,605
APPLICATIONS APPROVED, NOT ACCEPTED
0
$0
5
$166,284
14
$103,679
20
$26,301
0
$0
0
$0
APPLICATIONS DENIED
0
$0
8
$115,249
37
$106,360
24
$36,578
0
$0
0
$0
APPLICATIONS WITHDRAWN
1
$164,890
2
$227,595
50
$88,971
2
$37,740
0
$0
0
$0
FILES CLOSED FOR INCOMPLETENESS
0
$0
1
$185,790
8
$126,716
0
$0
0
$0
0
$0
Aggregated Statistics For Year 1999 (Based on 2 partial tracts)
A) FHA, FSA/RHS & VA Home Purchase Loans
B) Conventional Home Purchase Loans
C) Refinancings
D) Home Improvement Loans
E) Loans on Dwellings For 5+ Families
F) Non-occupant Loans on < 5 Family Dwellings (A B C & D)
Detailed PMIC statistics for the following Tracts:1477.02
2002 - 2018 National Fire Incident Reporting System (NFIRS) incidents
According to the data from the years 2002 - 2018 the average number of fire incidents per year is 10. The highest number of reported fires - 22 took place in 2002, and the least - 0 in 2004. The data has a declining trend.
When looking into fire subcategories, the most reports belonged to: Structure Fires (45.1%), and Outside Fires (41.0%).
Fire incident types reported to NFIRS in Zip Code 11796
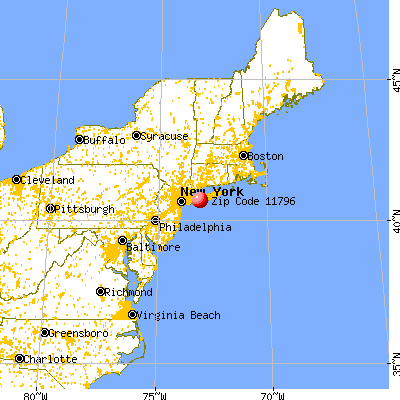


 Nearest zip codes: 11782, 11769, 11705, 11716, 11739, 11715.


 According to the data from the years 2002 - 2018 the average number of fire incidents per year is 10. The highest number of reported fires - 22 took place in 2002, and the least - 0 in 2004. The data has a declining trend.
 When looking into fire subcategories, the most reports belonged to: Structure Fires (45.1%), and Outside Fires (41.0%).