Estimated zip code population in 2022: 2,811
Zip code population in 2010: 3,285
Zip code population in 2000: 2,652
Houses and condos: 1,585
Renter-occupied apartments: 847
% of renters here:
57%State:
46%
March 2022 cost of living index in zip code 11955: 151.5
(very high, U.S. average is 100)
Land area: 2.9
sq. mi.
Water area: 0.2
sq. mi.
Population density: 980 people per square mile (low).
OSM Map
General Map
Google Map
MSN Map
OSM Map
General Map
Google Map
MSN Map
OSM Map
General Map
Google Map
MSN Map
OSM Map
General Map
Google Map
MSN Map
Please wait while loading the map...
Real estate property taxes paid for housing units in 2022:
This zip code:
1.7% ($7,526)New York:
1.5% ($6,180)
Median real estate property taxes paid for housing units with mortgages in 2022: $8,690 (1.9%)
Median real estate property taxes paid for housing units with no mortgage in 2022: $7,024 (1.6%)
Profiles of local businesses
Business Search - 14 Million verified businesses
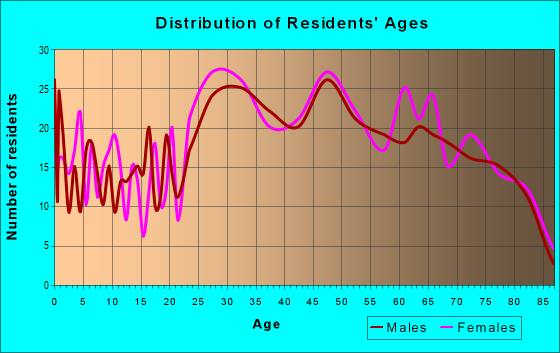
Males: 1,398 Females: 1,412
For population 25 years and over in 11955:
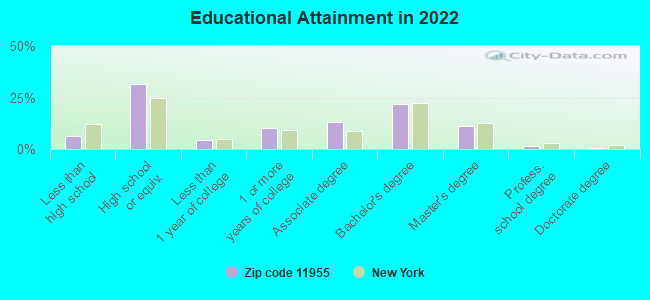
High school or higher: 93.4%Bachelor's degree or higher: 34.6%Graduate or professional degree: 13.0%Unemployed: 2.6%Mean travel time to work (commute): 36.4 minutes
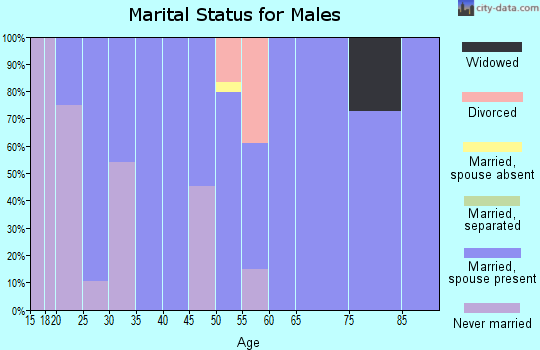
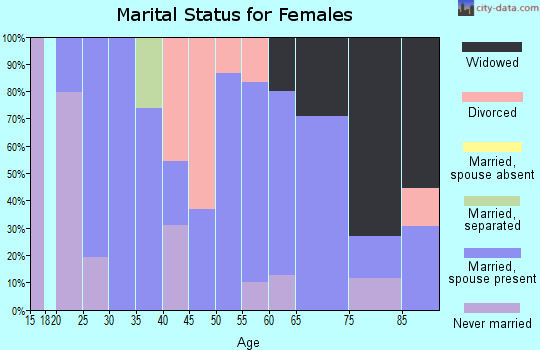
For population 15 years and over in 11955:
Never married: 28.2%Now married: 58.3%Separated: 0.6%Widowed: 4.1%Divorced: 8.8%
Zip code 11955 compared to state average:
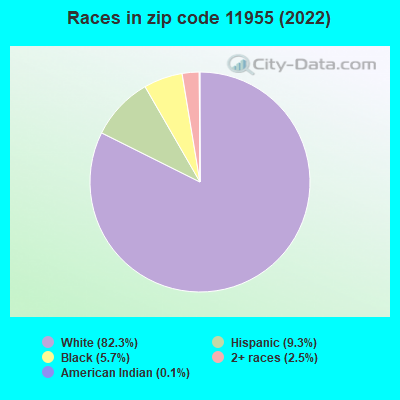
Unemployed percentage below state average. Black race population percentage below state average. Hispanic race population percentage below state average. Median age significantly above state average. Foreign-born population percentage below state average. Length of stay since moving in above state average. House age significantly below state average. 2,310 82.3% White 261 9.3% Hispanic or Latino 161 5.7% Black 71 2.5% Two or more races 4 0.1% American Indian
Data:
Median household income ($)
Median household income (% change since 2000)
Household income diversity
Ratio of average income to average house value (%)
Ratio of average income to average rent
Median household income ($) - White
Median household income ($) - Black or African American
Median household income ($) - Asian
Median household income ($) - Hispanic or Latino
Median household income ($) - American Indian and Alaska Native
Median household income ($) - Multirace
Median household income ($) - Other Race
Median household income for houses/condos with a mortgage ($)
Median household income for apartments without a mortgage ($)
Races - White alone (%)
Races - White alone (% change since 2000)
Races - Black alone (%)
Races - Black alone (% change since 2000)
Races - American Indian alone (%)
Races - American Indian alone (% change since 2000)
Races - Asian alone (%)
Races - Asian alone (% change since 2000)
Races - Hispanic (%)
Races - Hispanic (% change since 2000)
Races - Native Hawaiian and Other Pacific Islander alone (%)
Races - Native Hawaiian and Other Pacific Islander alone (% change since 2000)
Races - Two or more races (%)
Races - Two or more races (% change since 2000)
Races - Other race alone (%)
Races - Other race alone (% change since 2000)
Racial diversity
Unemployment (%)
Unemployment (% change since 2000)
Unemployment (%) - White
Unemployment (%) - Black or African American
Unemployment (%) - Asian
Unemployment (%) - Hispanic or Latino
Unemployment (%) - American Indian and Alaska Native
Unemployment (%) - Multirace
Unemployment (%) - Other Race
Population density (people per square mile)
Population - Males (%)
Population - Females (%)
Population - Males (%) - White
Population - Males (%) - Black or African American
Population - Males (%) - Asian
Population - Males (%) - Hispanic or Latino
Population - Males (%) - American Indian and Alaska Native
Population - Males (%) - Multirace
Population - Males (%) - Other Race
Population - Females (%) - White
Population - Females (%) - Black or African American
Population - Females (%) - Asian
Population - Females (%) - Hispanic or Latino
Population - Females (%) - American Indian and Alaska Native
Population - Females (%) - Multirace
Population - Females (%) - Other Race
Coronavirus confirmed cases (May 21, 2024)
Deaths caused by coronavirus (May 21, 2024)
Coronavirus confirmed cases (per 100k population) (May 21, 2024)
Deaths caused by coronavirus (per 100k population) (May 21, 2024)
Daily increase in number of cases (May 21, 2024)
Weekly increase in number of cases (May 21, 2024)
Cases doubled (in days) (May 21, 2024)
Hospitalized patients (Apr 18, 2022)
Negative test results (Apr 18, 2022)
Total test results (Apr 18, 2022)
COVID Vaccine doses distributed (per 100k population) (Sep 19, 2023)
COVID Vaccine doses administered (per 100k population) (Sep 19, 2023)
COVID Vaccine doses distributed (Sep 19, 2023)
COVID Vaccine doses administered (Sep 19, 2023)
Likely homosexual households (%)
Likely homosexual households (% change since 2000)
Likely homosexual households - Lesbian couples (%)
Likely homosexual households - Lesbian couples (% change since 2000)
Likely homosexual households - Gay men (%)
Likely homosexual households - Gay men (% change since 2000)
Cost of living index
Median gross rent ($)
Median contract rent ($)
Median monthly housing costs ($)
Median house or condo value ($)
Median house or condo value ($ change since 2000)
Mean house or condo value by units in structure - 1, detached ($)
Mean house or condo value by units in structure - 1, attached ($)
Mean house or condo value by units in structure - 2 ($)
Mean house or condo value by units in structure by units in structure - 3 or 4 ($)
Mean house or condo value by units in structure - 5 or more ($)
Mean house or condo value by units in structure - Boat, RV, van, etc. ($)
Mean house or condo value by units in structure - Mobile home ($)
Median house or condo value ($) - White
Median house or condo value ($) - Black or African American
Median house or condo value ($) - Asian
Median house or condo value ($) - Hispanic or Latino
Median house or condo value ($) - American Indian and Alaska Native
Median house or condo value ($) - Multirace
Median house or condo value ($) - Other Race
Median resident age
Resident age diversity
Median resident age - Males
Median resident age - Females
Median resident age - White
Median resident age - Black or African American
Median resident age - Asian
Median resident age - Hispanic or Latino
Median resident age - American Indian and Alaska Native
Median resident age - Multirace
Median resident age - Other Race
Median resident age - Males - White
Median resident age - Males - Black or African American
Median resident age - Males - Asian
Median resident age - Males - Hispanic or Latino
Median resident age - Males - American Indian and Alaska Native
Median resident age - Males - Multirace
Median resident age - Males - Other Race
Median resident age - Females - White
Median resident age - Females - Black or African American
Median resident age - Females - Asian
Median resident age - Females - Hispanic or Latino
Median resident age - Females - American Indian and Alaska Native
Median resident age - Females - Multirace
Median resident age - Females - Other Race
Commute - mean travel time to work (minutes)
Travel time to work - Less than 5 minutes (%)
Travel time to work - Less than 5 minutes (% change since 2000)
Travel time to work - 5 to 9 minutes (%)
Travel time to work - 5 to 9 minutes (% change since 2000)
Travel time to work - 10 to 19 minutes (%)
Travel time to work - 10 to 19 minutes (% change since 2000)
Travel time to work - 20 to 29 minutes (%)
Travel time to work - 20 to 29 minutes (% change since 2000)
Travel time to work - 30 to 39 minutes (%)
Travel time to work - 30 to 39 minutes (% change since 2000)
Travel time to work - 40 to 59 minutes (%)
Travel time to work - 40 to 59 minutes (% change since 2000)
Travel time to work - 60 to 89 minutes (%)
Travel time to work - 60 to 89 minutes (% change since 2000)
Travel time to work - 90 or more minutes (%)
Travel time to work - 90 or more minutes (% change since 2000)
Marital status - Never married (%)
Marital status - Now married (%)
Marital status - Separated (%)
Marital status - Widowed (%)
Marital status - Divorced (%)
Median family income ($)
Median family income (% change since 2000)
Median non-family income ($)
Median non-family income (% change since 2000)
Median per capita income ($)
Median per capita income (% change since 2000)
Median family income ($) - White
Median family income ($) - Black or African American
Median family income ($) - Asian
Median family income ($) - Hispanic or Latino
Median family income ($) - American Indian and Alaska Native
Median family income ($) - Multirace
Median family income ($) - Other Race
Median year house/condo built
Median year apartment built
Year house built - Built 2005 or later (%)
Year house built - Built 2000 to 2004 (%)
Year house built - Built 1990 to 1999 (%)
Year house built - Built 1980 to 1989 (%)
Year house built - Built 1970 to 1979 (%)
Year house built - Built 1960 to 1969 (%)
Year house built - Built 1950 to 1959 (%)
Year house built - Built 1940 to 1949 (%)
Year house built - Built 1939 or earlier (%)
Average household size
Household density (households per square mile)
Average household size - White
Average household size - Black or African American
Average household size - Asian
Average household size - Hispanic or Latino
Average household size - American Indian and Alaska Native
Average household size - Multirace
Average household size - Other Race
Occupied housing units (%)
Vacant housing units (%)
Owner occupied housing units (%)
Renter occupied housing units (%)
Vacancy status - For rent (%)
Vacancy status - For sale only (%)
Vacancy status - Rented or sold, not occupied (%)
Vacancy status - For seasonal, recreational, or occasional use (%)
Vacancy status - For migrant workers (%)
Vacancy status - Other vacant (%)
Residents with income below the poverty level (%)
Residents with income below 50% of the poverty level (%)
Children below poverty level (%)
Poor families by family type - Married-couple family (%)
Poor families by family type - Male, no wife present (%)
Poor families by family type - Female, no husband present (%)
Poverty status for native-born residents (%)
Poverty status for foreign-born residents (%)
Poverty among high school graduates not in families (%)
Poverty among people who did not graduate high school not in families (%)
Residents with income below the poverty level (%) - White
Residents with income below the poverty level (%) - Black or African American
Residents with income below the poverty level (%) - Asian
Residents with income below the poverty level (%) - Hispanic or Latino
Residents with income below the poverty level (%) - American Indian and Alaska Native
Residents with income below the poverty level (%) - Multirace
Residents with income below the poverty level (%) - Other Race
Air pollution - Air Quality Index (AQI)
Air pollution - CO
Air pollution - NO2
Air pollution - SO2
Air pollution - Ozone
Air pollution - PM10
Air pollution - PM25
Air pollution - Pb
Crime - Murders per 100,000 population
Crime - Rapes per 100,000 population
Crime - Robberies per 100,000 population
Crime - Assaults per 100,000 population
Crime - Burglaries per 100,000 population
Crime - Thefts per 100,000 population
Crime - Auto thefts per 100,000 population
Crime - Arson per 100,000 population
Crime - City-data.com crime index
Crime - Violent crime index
Crime - Property crime index
Crime - Murders per 100,000 population (5 year average)
Crime - Rapes per 100,000 population (5 year average)
Crime - Robberies per 100,000 population (5 year average)
Crime - Assaults per 100,000 population (5 year average)
Crime - Burglaries per 100,000 population (5 year average)
Crime - Thefts per 100,000 population (5 year average)
Crime - Auto thefts per 100,000 population (5 year average)
Crime - Arson per 100,000 population (5 year average)
Crime - City-data.com crime index (5 year average)
Crime - Violent crime index (5 year average)
Crime - Property crime index (5 year average)
1996 Presidential Elections Results (%) - Democratic Party (Clinton)
1996 Presidential Elections Results (%) - Republican Party (Dole)
1996 Presidential Elections Results (%) - Other
2000 Presidential Elections Results (%) - Democratic Party (Gore)
2000 Presidential Elections Results (%) - Republican Party (Bush)
2000 Presidential Elections Results (%) - Other
2004 Presidential Elections Results (%) - Democratic Party (Kerry)
2004 Presidential Elections Results (%) - Republican Party (Bush)
2004 Presidential Elections Results (%) - Other
2008 Presidential Elections Results (%) - Democratic Party (Obama)
2008 Presidential Elections Results (%) - Republican Party (McCain)
2008 Presidential Elections Results (%) - Other
2012 Presidential Elections Results (%) - Democratic Party (Obama)
2012 Presidential Elections Results (%) - Republican Party (Romney)
2012 Presidential Elections Results (%) - Other
2016 Presidential Elections Results (%) - Democratic Party (Clinton)
2016 Presidential Elections Results (%) - Republican Party (Trump)
2016 Presidential Elections Results (%) - Other
2020 Presidential Elections Results (%) - Democratic Party (Biden)
2020 Presidential Elections Results (%) - Republican Party (Trump)
2020 Presidential Elections Results (%) - Other
Ancestries Reported - Arab (%)
Ancestries Reported - Czech (%)
Ancestries Reported - Danish (%)
Ancestries Reported - Dutch (%)
Ancestries Reported - English (%)
Ancestries Reported - French (%)
Ancestries Reported - French Canadian (%)
Ancestries Reported - German (%)
Ancestries Reported - Greek (%)
Ancestries Reported - Hungarian (%)
Ancestries Reported - Irish (%)
Ancestries Reported - Italian (%)
Ancestries Reported - Lithuanian (%)
Ancestries Reported - Norwegian (%)
Ancestries Reported - Polish (%)
Ancestries Reported - Portuguese (%)
Ancestries Reported - Russian (%)
Ancestries Reported - Scotch-Irish (%)
Ancestries Reported - Scottish (%)
Ancestries Reported - Slovak (%)
Ancestries Reported - Subsaharan African (%)
Ancestries Reported - Swedish (%)
Ancestries Reported - Swiss (%)
Ancestries Reported - Ukrainian (%)
Ancestries Reported - United States (%)
Ancestries Reported - Welsh (%)
Ancestries Reported - West Indian (%)
Ancestries Reported - Other (%)
Educational Attainment - No schooling completed (%)
Educational Attainment - Less than high school (%)
Educational Attainment - High school or equivalent (%)
Educational Attainment - Less than 1 year of college (%)
Educational Attainment - 1 or more years of college (%)
Educational Attainment - Associate degree (%)
Educational Attainment - Bachelor's degree (%)
Educational Attainment - Master's degree (%)
Educational Attainment - Professional school degree (%)
Educational Attainment - Doctorate degree (%)
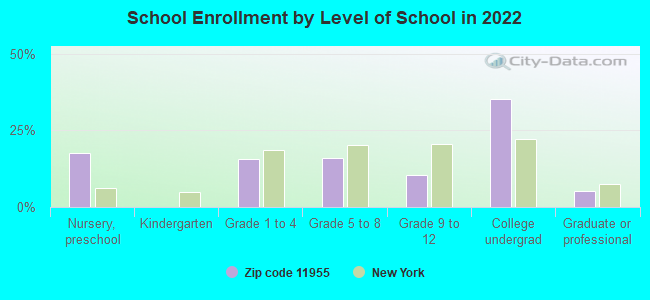
School Enrollment - Nursery, preschool (%)
School Enrollment - Kindergarten (%)
School Enrollment - Grade 1 to 4 (%)
School Enrollment - Grade 5 to 8 (%)
School Enrollment - Grade 9 to 12 (%)
School Enrollment - College undergrad (%)
School Enrollment - Graduate or professional (%)
School Enrollment - Not enrolled in school (%)
School enrollment - Public schools (%)
School enrollment - Private schools (%)
School enrollment - Not enrolled (%)
Median number of rooms in houses and condos
Median number of rooms in apartments
Housing units lacking complete plumbing facilities (%)
Housing units lacking complete kitchen facilities (%)
Density of houses
Urban houses (%)
Rural houses (%)
Households with people 60 years and over (%)
Households with people 65 years and over (%)
Households with people 75 years and over (%)
Households with one or more nonrelatives (%)
Households with no nonrelatives (%)
Population in households (%)
Family households (%)
Nonfamily households (%)
Population in families (%)
Family households with own children (%)
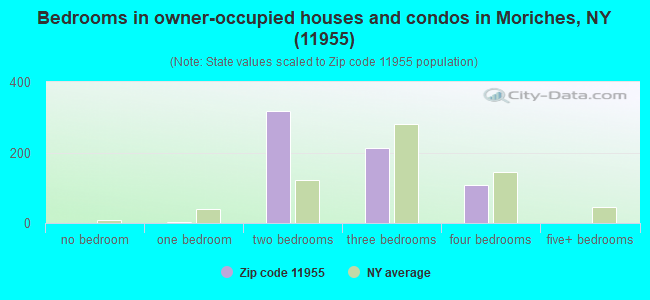
Median number of bedrooms in owner occupied houses
Mean number of bedrooms in owner occupied houses
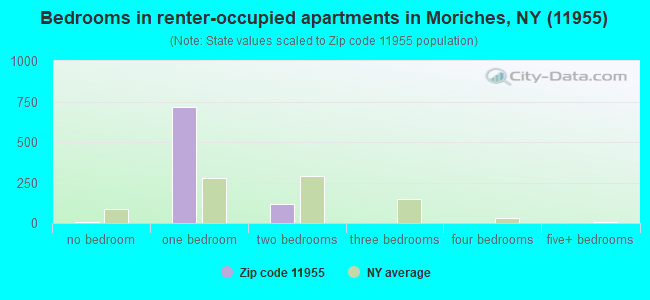
Median number of bedrooms in renter occupied houses
Mean number of bedrooms in renter occupied houses
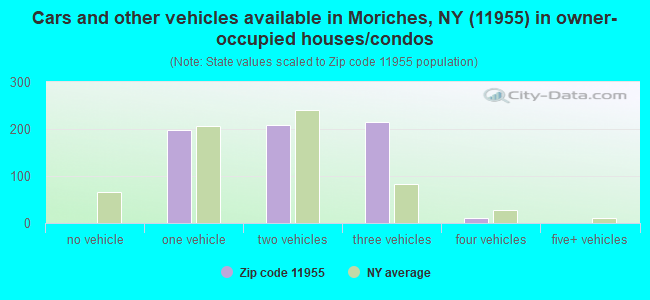
Median number of vehichles in owner occupied houses
Mean number of vehichles in owner occupied houses
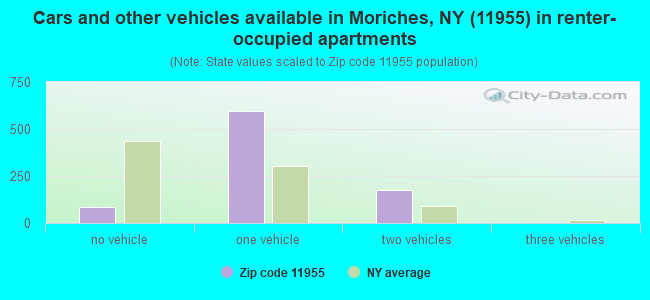
Median number of vehichles in renter occupied houses
Mean number of vehichles in renter occupied houses
Mortgage status - with mortgage (%)
Mortgage status - with second mortgage (%)
Mortgage status - with home equity loan (%)
Mortgage status - with both second mortgage and home equity loan (%)
Mortgage status - without a mortgage (%)
Average family size
Average family size - White
Average family size - Black or African American
Average family size - Asian
Average family size - Hispanic or Latino
Average family size - American Indian and Alaska Native
Average family size - Multirace
Average family size - Other Race
Geographical mobility - Same house 1 year ago (%)
Geographical mobility - Moved within same county (%)
Geographical mobility - Moved from different county within same state (%)
Geographical mobility - Moved from different state (%)
Geographical mobility - Moved from abroad (%)
Place of birth - Born in state of residence (%)
Place of birth - Born in other state (%)
Place of birth - Native, outside of US (%)
Place of birth - Foreign born (%)
Housing units in structures - 1, detached (%)
Housing units in structures - 1, attached (%)
Housing units in structures - 2 (%)
Housing units in structures - 3 or 4 (%)
Housing units in structures - 5 to 9 (%)
Housing units in structures - 10 to 19 (%)
Housing units in structures - 20 to 49 (%)
Housing units in structures - 50 or more (%)
Housing units in structures - Mobile home (%)
Housing units in structures - Boat, RV, van, etc. (%)
House/condo owner moved in on average (years ago)
Renter moved in on average (years ago)
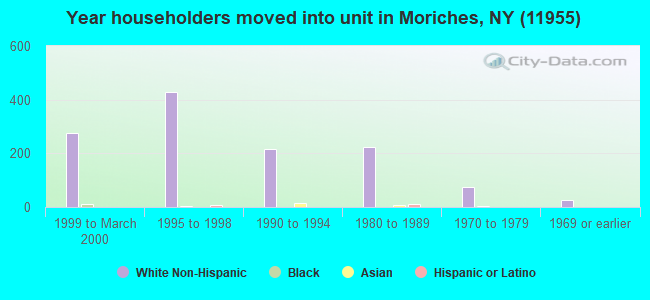
Year householder moved into unit - Moved in 1999 to March 2000 (%)
Year householder moved into unit - Moved in 1995 to 1998 (%)
Year householder moved into unit - Moved in 1990 to 1994 (%)
Year householder moved into unit - Moved in 1980 to 1989 (%)
Year householder moved into unit - Moved in 1970 to 1979 (%)
Year householder moved into unit - Moved in 1969 or earlier (%)
Means of transportation to work - Drove car alone (%)
Means of transportation to work - Carpooled (%)
Means of transportation to work - Public transportation (%)
Means of transportation to work - Bus or trolley bus (%)
Means of transportation to work - Streetcar or trolley car (%)
Means of transportation to work - Subway or elevated (%)
Means of transportation to work - Railroad (%)
Means of transportation to work - Ferryboat (%)
Means of transportation to work - Taxicab (%)
Means of transportation to work - Motorcycle (%)
Means of transportation to work - Bicycle (%)
Means of transportation to work - Walked (%)
Means of transportation to work - Other means (%)
Working at home (%)
Industry diversity
Most Common Industries - Agriculture, forestry, fishing and hunting, and mining (%)
Most Common Industries - Agriculture, forestry, fishing and hunting (%)
Most Common Industries - Mining, quarrying, and oil and gas extraction (%)
Most Common Industries - Construction (%)
Most Common Industries - Manufacturing (%)
Most Common Industries - Wholesale trade (%)
Most Common Industries - Retail trade (%)
Most Common Industries - Transportation and warehousing, and utilities (%)
Most Common Industries - Transportation and warehousing (%)
Most Common Industries - Utilities (%)
Most Common Industries - Information (%)
Most Common Industries - Finance and insurance, and real estate and rental and leasing (%)
Most Common Industries - Finance and insurance (%)
Most Common Industries - Real estate and rental and leasing (%)
Most Common Industries - Professional, scientific, and management, and administrative and waste management services (%)
Most Common Industries - Professional, scientific, and technical services (%)
Most Common Industries - Management of companies and enterprises (%)
Most Common Industries - Administrative and support and waste management services (%)
Most Common Industries - Educational services, and health care and social assistance (%)
Most Common Industries - Educational services (%)
Most Common Industries - Health care and social assistance (%)
Most Common Industries - Arts, entertainment, and recreation, and accommodation and food services (%)
Most Common Industries - Arts, entertainment, and recreation (%)
Most Common Industries - Accommodation and food services (%)
Most Common Industries - Other services, except public administration (%)
Most Common Industries - Public administration (%)
Occupation diversity
Most Common Occupations - Management, business, science, and arts occupations (%)
Most Common Occupations - Management, business, and financial occupations (%)
Most Common Occupations - Management occupations (%)
Most Common Occupations - Business and financial operations occupations (%)
Most Common Occupations - Computer, engineering, and science occupations (%)
Most Common Occupations - Computer and mathematical occupations (%)
Most Common Occupations - Architecture and engineering occupations (%)
Most Common Occupations - Life, physical, and social science occupations (%)
Most Common Occupations - Education, legal, community service, arts, and media occupations (%)
Most Common Occupations - Community and social service occupations (%)
Most Common Occupations - Legal occupations (%)
Most Common Occupations - Education, training, and library occupations (%)
Most Common Occupations - Arts, design, entertainment, sports, and media occupations (%)
Most Common Occupations - Healthcare practitioners and technical occupations (%)
Most Common Occupations - Health diagnosing and treating practitioners and other technical occupations (%)
Most Common Occupations - Health technologists and technicians (%)
Most Common Occupations - Service occupations (%)
Most Common Occupations - Healthcare support occupations (%)
Most Common Occupations - Protective service occupations (%)
Most Common Occupations - Fire fighting and prevention, and other protective service workers including supervisors (%)
Most Common Occupations - Law enforcement workers including supervisors (%)
Most Common Occupations - Food preparation and serving related occupations (%)
Most Common Occupations - Building and grounds cleaning and maintenance occupations (%)
Most Common Occupations - Personal care and service occupations (%)
Most Common Occupations - Sales and office occupations (%)
Most Common Occupations - Sales and related occupations (%)
Most Common Occupations - Office and administrative support occupations (%)
Most Common Occupations - Natural resources, construction, and maintenance occupations (%)
Most Common Occupations - Farming, fishing, and forestry occupations (%)
Most Common Occupations - Construction and extraction occupations (%)
Most Common Occupations - Installation, maintenance, and repair occupations (%)
Most Common Occupations - Production, transportation, and material moving occupations (%)
Most Common Occupations - Production occupations (%)
Most Common Occupations - Transportation occupations (%)
Most Common Occupations - Material moving occupations (%)
People in Group quarters - Institutionalized population (%)
People in Group quarters - Correctional institutions (%)
People in Group quarters - Federal prisons and detention centers (%)
People in Group quarters - Halfway houses (%)
People in Group quarters - Local jails and other confinement facilities (including police lockups) (%)
People in Group quarters - Military disciplinary barracks (%)
People in Group quarters - State prisons (%)
People in Group quarters - Other types of correctional institutions (%)
People in Group quarters - Nursing homes (%)
People in Group quarters - Hospitals/wards, hospices, and schools for the handicapped (%)
People in Group quarters - Hospitals/wards and hospices for chronically ill (%)
People in Group quarters - Hospices or homes for chronically ill (%)
People in Group quarters - Military hospitals or wards for chronically ill (%)
People in Group quarters - Other hospitals or wards for chronically ill (%)
People in Group quarters - Hospitals or wards for drug/alcohol abuse (%)
People in Group quarters - Mental (Psychiatric) hospitals or wards (%)
People in Group quarters - Schools, hospitals, or wards for the mentally retarded (%)
People in Group quarters - Schools, hospitals, or wards for the physically handicapped (%)
People in Group quarters - Institutions for the deaf (%)
People in Group quarters - Institutions for the blind (%)
People in Group quarters - Orthopedic wards and institutions for the physically handicapped (%)
People in Group quarters - Wards in general hospitals for patients who have no usual home elsewhere (%)
People in Group quarters - Wards in military hospitals for patients who have no usual home elsewhere (%)
People in Group quarters - Juvenile institutions (%)
People in Group quarters - Long-term care (%)
People in Group quarters - Homes for abused, dependent, and neglected children (%)
People in Group quarters - Residential treatment centers for emotionally disturbed children (%)
People in Group quarters - Training schools for juvenile delinquents (%)
People in Group quarters - Short-term care, detention or diagnostic centers for delinquent children (%)
People in Group quarters - Type of juvenile institution unknown (%)
People in Group quarters - Noninstitutionalized population (%)
People in Group quarters - College dormitories (includes college quarters off campus) (%)
People in Group quarters - Military quarters (%)
People in Group quarters - On base (%)
People in Group quarters - Barracks, unaccompanied personnel housing (UPH), (Enlisted/Officer), ;and similar group living quarters for military personnel (%)
People in Group quarters - Transient quarters for temporary residents (%)
People in Group quarters - Military ships (%)
People in Group quarters - Group homes (%)
People in Group quarters - Homes or halfway houses for drug/alcohol abuse (%)
People in Group quarters - Homes for the mentally ill (%)
People in Group quarters - Homes for the mentally retarded (%)
People in Group quarters - Homes for the physically handicapped (%)
People in Group quarters - Other group homes (%)
People in Group quarters - Religious group quarters (%)
People in Group quarters - Dormitories (%)
People in Group quarters - Agriculture workers' dormitories on farms (%)
People in Group quarters - Job Corps and vocational training facilities (%)
People in Group quarters - Other workers' dormitories (%)
People in Group quarters - Crews of maritime vessels (%)
People in Group quarters - Other nonhousehold living situations (%)
People in Group quarters - Other noninstitutional group quarters (%)
Residents speaking English at home (%)
Residents speaking English at home - Born in the United States (%)
Residents speaking English at home - Native, born elsewhere (%)
Residents speaking English at home - Foreign born (%)
Residents speaking Spanish at home (%)
Residents speaking Spanish at home - Born in the United States (%)
Residents speaking Spanish at home - Native, born elsewhere (%)
Residents speaking Spanish at home - Foreign born (%)
Residents speaking other language at home (%)
Residents speaking other language at home - Born in the United States (%)
Residents speaking other language at home - Native, born elsewhere (%)
Residents speaking other language at home - Foreign born (%)
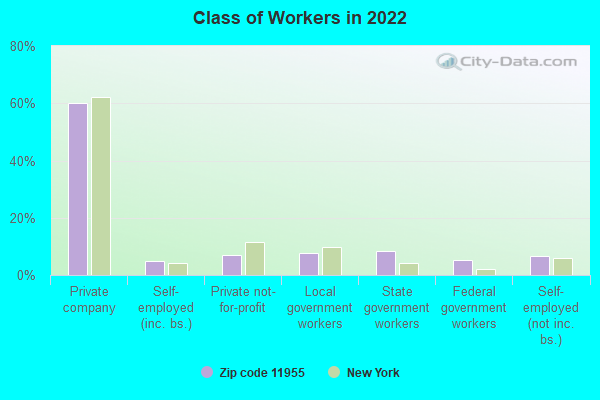
Class of Workers - Employee of private company (%)
Class of Workers - Self-employed in own incorporated business (%)
Class of Workers - Private not-for-profit wage and salary workers (%)
Class of Workers - Local government workers (%)
Class of Workers - State government workers (%)
Class of Workers - Federal government workers (%)
Class of Workers - Self-employed workers in own not incorporated business and Unpaid family workers (%)
House heating fuel used in houses and condos - Utility gas (%)
House heating fuel used in houses and condos - Bottled, tank, or LP gas (%)
House heating fuel used in houses and condos - Electricity (%)
House heating fuel used in houses and condos - Fuel oil, kerosene, etc. (%)
House heating fuel used in houses and condos - Coal or coke (%)
House heating fuel used in houses and condos - Wood (%)
House heating fuel used in houses and condos - Solar energy (%)
House heating fuel used in houses and condos - Other fuel (%)
House heating fuel used in houses and condos - No fuel used (%)
House heating fuel used in apartments - Utility gas (%)
House heating fuel used in apartments - Bottled, tank, or LP gas (%)
House heating fuel used in apartments - Electricity (%)
House heating fuel used in apartments - Fuel oil, kerosene, etc. (%)
House heating fuel used in apartments - Coal or coke (%)
House heating fuel used in apartments - Wood (%)
House heating fuel used in apartments - Solar energy (%)
House heating fuel used in apartments - Other fuel (%)
House heating fuel used in apartments - No fuel used (%)
Armed forces status - In Armed Forces (%)
Armed forces status - Civilian (%)
Armed forces status - Civilian - Veteran (%)
Armed forces status - Civilian - Nonveteran (%)
Fatal accidents locations in years 2005-2021
Fatal accidents locations in 2005
Fatal accidents locations in 2006
Fatal accidents locations in 2007
Fatal accidents locations in 2008
Fatal accidents locations in 2009
Fatal accidents locations in 2010
Fatal accidents locations in 2011
Fatal accidents locations in 2012
Fatal accidents locations in 2013
Fatal accidents locations in 2014
Fatal accidents locations in 2015
Fatal accidents locations in 2016
Fatal accidents locations in 2017
Fatal accidents locations in 2018
Fatal accidents locations in 2019
Fatal accidents locations in 2020
Fatal accidents locations in 2021
Alcohol use - People drinking some alcohol every month (%)
Alcohol use - People not drinking at all (%)
Alcohol use - Average days/month drinking alcohol
Alcohol use - Average drinks/week
Alcohol use - Average days/year people drink much
Audiometry - Average condition of hearing (%)
Audiometry - People that can hear a whisper from across a quiet room (%)
Audiometry - People that can hear normal voice from across a quiet room (%)
Audiometry - Ears ringing, roaring, buzzing (%)
Audiometry - Had a job exposure to loud noise (%)
Audiometry - Had off-work exposure to loud noise (%)
Blood Pressure & Cholesterol - Has high blood pressure (%)
Blood Pressure & Cholesterol - Checking blood pressure at home (%)
Blood Pressure & Cholesterol - Frequently checking blood cholesterol (%)
Blood Pressure & Cholesterol - Has high cholesterol level (%)
Consumer Behavior - Money monthly spent on food at supermarket/grocery store
Consumer Behavior - Money monthly spent on food at other stores
Consumer Behavior - Money monthly spent on eating out
Consumer Behavior - Money monthly spent on carryout/delivered foods
Consumer Behavior - Income spent on food at supermarket/grocery store (%)
Consumer Behavior - Income spent on food at other stores (%)
Consumer Behavior - Income spent on eating out (%)
Consumer Behavior - Income spent on carryout/delivered foods (%)
Current Health Status - General health condition (%)
Current Health Status - Blood donors (%)
Current Health Status - Has blood ever tested for HIV virus (%)
Current Health Status - Left-handed people (%)
Dermatology - People using sunscreen (%)
Diabetes - Diabetics (%)
Diabetes - Had a blood test for high blood sugar (%)
Diabetes - People taking insulin (%)
Diet Behavior & Nutrition - Diet health (%)
Diet Behavior & Nutrition - Milk product consumption (# of products/month)
Diet Behavior & Nutrition - Meals not home prepared (#/week)
Diet Behavior & Nutrition - Meals from fast food or pizza place (#/week)
Diet Behavior & Nutrition - Ready-to-eat foods (#/month)
Diet Behavior & Nutrition - Frozen meals/pizza (#/month)
Drug Use - People that ever used marijuana or hashish (%)
Drug Use - Ever used hard drugs (%)
Drug Use - Ever used any form of cocaine (%)
Drug Use - Ever used heroin (%)
Drug Use - Ever used methamphetamine (%)
Health Insurance - People covered by health insurance (%)
Kidney Conditions-Urology - Avg. # of times urinating at night
Medical Conditions - People with asthma (%)
Medical Conditions - People with anemia (%)
Medical Conditions - People with psoriasis (%)
Medical Conditions - People with overweight (%)
Medical Conditions - Elderly people having difficulties in thinking or remembering (%)
Medical Conditions - People who ever received blood transfusion (%)
Medical Conditions - People having trouble seeing even with glass/contacts (%)
Medical Conditions - People with arthritis (%)
Medical Conditions - People with gout (%)
Medical Conditions - People with congestive heart failure (%)
Medical Conditions - People with coronary heart disease (%)
Medical Conditions - People with angina pectoris (%)
Medical Conditions - People who ever had heart attack (%)
Medical Conditions - People who ever had stroke (%)
Medical Conditions - People with emphysema (%)
Medical Conditions - People with thyroid problem (%)
Medical Conditions - People with chronic bronchitis (%)
Medical Conditions - People with any liver condition (%)
Medical Conditions - People who ever had cancer or malignancy (%)
Mental Health - People who have little interest in doing things (%)
Mental Health - People feeling down, depressed, or hopeless (%)
Mental Health - People who have trouble sleeping or sleeping too much (%)
Mental Health - People feeling tired or having little energy (%)
Mental Health - People with poor appetite or overeating (%)
Mental Health - People feeling bad about themself (%)
Mental Health - People who have trouble concentrating on things (%)
Mental Health - People moving or speaking slowly or too fast (%)
Mental Health - People having thoughts they would be better off dead (%)
Oral Health - Average years since last visit a dentist
Oral Health - People embarrassed because of mouth (%)
Oral Health - People with gum disease (%)
Oral Health - General health of teeth and gums (%)
Oral Health - Average days a week using dental floss/device
Oral Health - Average days a week using mouthwash for dental problem
Oral Health - Average number of teeth
Pesticide Use - Households using pesticides to control insects (%)
Pesticide Use - Households using pesticides to kill weeds (%)
Physical Activity - People doing vigorous-intensity work activities (%)
Physical Activity - People doing moderate-intensity work activities (%)
Physical Activity - People walking or bicycling (%)
Physical Activity - People doing vigorous-intensity recreational activities (%)
Physical Activity - People doing moderate-intensity recreational activities (%)
Physical Activity - Average hours a day doing sedentary activities
Physical Activity - Average hours a day watching TV or videos
Physical Activity - Average hours a day using computer
Physical Functioning - People having limitations keeping them from working (%)
Physical Functioning - People limited in amount of work they can do (%)
Physical Functioning - People that need special equipment to walk (%)
Physical Functioning - People experiencing confusion/memory problems (%)
Physical Functioning - People requiring special healthcare equipment (%)
Prescription Medications - Average number of prescription medicines taking
Preventive Aspirin Use - Adults 40+ taking low-dose aspirin (%)
Reproductive Health - Vaginal deliveries (%)
Reproductive Health - Cesarean deliveries (%)
Reproductive Health - Deliveries resulted in a live birth (%)
Reproductive Health - Pregnancies resulted in a delivery (%)
Reproductive Health - Women breastfeeding newborns (%)
Reproductive Health - Women that had a hysterectomy (%)
Reproductive Health - Women that had both ovaries removed (%)
Reproductive Health - Women that have ever taken birth control pills (%)
Reproductive Health - Women taking birth control pills (%)
Reproductive Health - Women that have ever used Depo-Provera or injectables (%)
Reproductive Health - Women that have ever used female hormones (%)
Sexual Behavior - People 18+ that ever had sex (vaginal, anal, or oral) (%)
Sexual Behavior - Males 18+ that ever had vaginal sex with a woman (%)
Sexual Behavior - Males 18+ that ever performed oral sex on a woman (%)
Sexual Behavior - Males 18+ that ever had anal sex with a woman (%)
Sexual Behavior - Males 18+ that ever had any sex with a man (%)
Sexual Behavior - Females 18+ that ever had vaginal sex with a man (%)
Sexual Behavior - Females 18+ that ever performed oral sex on a man (%)
Sexual Behavior - Females 18+ that ever had anal sex with a man (%)
Sexual Behavior - Females 18+ that ever had any kind of sex with a woman (%)
Sexual Behavior - Average age people first had sex
Sexual Behavior - Average number of female sex partners in lifetime (males 18+)
Sexual Behavior - Average number of female vaginal sex partners in lifetime (males 18+)
Sexual Behavior - Average age people first performed oral sex on a woman (18+)
Sexual Behavior - Average number of woman performed oral sex on in lifetime (18+)
Sexual Behavior - Average number of male sex partners in lifetime (males 18+)
Sexual Behavior - Average number of male anal sex partners in lifetime (males 18+)
Sexual Behavior - Average age people first performed oral sex on a man (18+)
Sexual Behavior - Average number of male oral sex partners in lifetime (18+)
Sexual Behavior - People using protection when performing oral sex (%)
Sexual Behavior - Average number of times people have vaginal or anal sex a year
Sexual Behavior - People having sex without condom (%)
Sexual Behavior - Average number of male sex partners in lifetime (females 18+)
Sexual Behavior - Average number of male vaginal sex partners in lifetime (females 18+)
Sexual Behavior - Average number of female sex partners in lifetime (females 18+)
Sexual Behavior - Circumcised males 18+ (%)
Sleep Disorders - Average hours sleeping at night
Sleep Disorders - People that has trouble sleeping (%)
Smoking-Cigarette Use - People smoking cigarettes (%)
Taste & Smell - People 40+ having problems with smell (%)
Taste & Smell - People 40+ having problems with taste (%)
Taste & Smell - People 40+ that ever had wisdom teeth removed (%)
Taste & Smell - People 40+ that ever had tonsils teeth removed (%)
Taste & Smell - People 40+ that ever had a loss of consciousness because of a head injury (%)
Taste & Smell - People 40+ that ever had a broken nose or other serious injury to face or skull (%)
Taste & Smell - People 40+ that ever had two or more sinus infections (%)
Weight - Average height (inches)
Weight - Average weight (pounds)
Weight - Average BMI
Weight - People that are obese (%)
Weight - People that ever were obese (%)
Weight - People trying to lose weight (%)
100%
urban population.
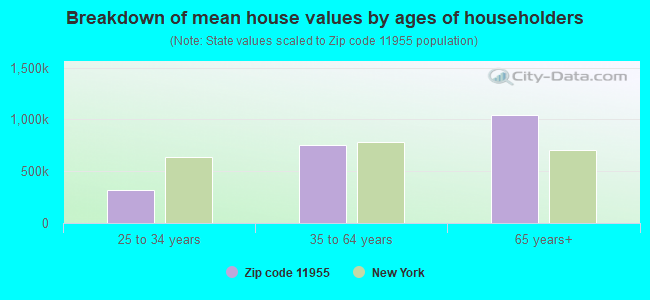
Estimated median house/condo value in 2022: $439,387
11955:
$439,387New York:
$400,400
According to our research of New York and other state lists, there were 2 registered sex offenders living in 11955 zip code as of May 21, 2024 . The ratio of all residents to sex offenders in zip code 11955 is 1,671 to 1.The ratio of registered sex offenders to all residents in this zip code is lower than the state average.
Median resident age: This zip code:
51.1 yearsNew York median age:
40.0 years
Average household size: This zip code:
1.9 peopleNew York:
2.5 people
Averages for the 2020 tax year for zip code 11955, filed in 2021:
Average Adjusted Gross Income (AGI) in 2020: $72,316 (Individual Income Tax Returns) Here:
$72,316State:
$90,930
Salary/wage: $61,657 (reported on 74.7% of returns )Here:
$61,657State:
$72,104
(% of AGI for various income ranges: 1085.0% for AGIs below $25k , 3254.8% for AGIs $25k-50k , 5862.4% for AGIs $50k-75k , 7876.9% for AGIs $75k-100k , 15790.6% for AGIs $100k-200k , 51697.5% for AGIs over 200k ) Taxable interest for individuals: $2,000 (reported on 40.1% of returns )This zip code:
$2,000New York:
$3,075
(% of AGI for various income ranges: 37.9% for AGIs below $25k , 40.0% for AGIs $25k-50k , 98.1% for AGIs $50k-75k , 70.0% for AGIs $75k-100k , 319.4% for AGIs $100k-200k , 917.5% for AGIs over 200k ) Ordinary dividends: $4,950 (reported on 24.2% of returns )(% of AGI for various income ranges: 28.8% for AGIs below $25k , 98.7% for AGIs $25k-50k , 140.0% for AGIs $50k-75k , 203.1% for AGIs $75k-100k , 411.2% for AGIs $100k-200k , 1292.5% for AGIs over 200k ) Net capital gain/loss in AGI: +$9,411 (reported on 20.9% of returns )Here:
+$9,411State:
+$44,925
(% of AGI for various income ranges: 20.6% for AGIs below $25k , 21.0% for AGIs $25k-50k , 77.1% for AGIs $50k-75k , 165.4% for AGIs $75k-100k , 387.1% for AGIs $100k-200k , 6015.0% for AGIs over 200k ) Profit/loss from business: +$10,422 (reported on 12.6% of returns )Here:
+$10,422State:
+$14,940
(% of AGI for various income ranges: 139.1% for AGIs below $25k , 88.7% for AGIs $25k-50k , 81.4% for AGIs $50k-75k , 98.5% for AGIs $75k-100k , 172.9% for AGIs $100k-200k , 2640.0% for AGIs over 200k ) Taxable individual retirement arrangement distribution: $21,025 (reported on 13.2% of returns )11955:
$21,025New York:
$19,609
(% of AGI for various income ranges: 71.5% for AGIs below $25k , 159.7% for AGIs $25k-50k , 298.1% for AGIs $50k-75k , 516.9% for AGIs $75k-100k , 1019.4% for AGIs $100k-200k , 3192.5% for AGIs over 200k ) Total itemized deductions: $27,811 (reported on 10.4% of returns )Here:
$27,811State:
$39,326
(% of AGI for various income ranges: 178.5% for AGIs below $25k , 320.0% for AGIs $50k-75k , 581.5% for AGIs $75k-100k , 1239.4% for AGIs $100k-200k , 2855.0% for AGIs over 200k ) Charity contributions: $4,138 (reported on 8.8% of returns )(% of AGI for various income ranges: 28.1% for AGIs $50k-75k , 41.5% for AGIs $75k-100k , 194.7% for AGIs $100k-200k , 545.0% for AGIs over 200k ) Taxes paid: $8,926 (reported on 10.4% of returns )(% of AGI for various income ranges: 50.6% for AGIs below $25k , 105.7% for AGIs $50k-75k , 204.6% for AGIs $75k-100k , 415.3% for AGIs $100k-200k , 825.0% for AGIs over 200k ) Earned income credit: $2,404 (reported on 12.6% of returns )(% of AGI for various income ranges: 118.2% for AGIs below $25k , 48.7% for AGIs $25k-50k ) Percentage of individuals using paid preparers for their 2020 taxes: 95.1%(% for various income ranges: 92.0% for AGIs below $25k , 95.1% for AGIs $25k-50k , 96.6% for AGIs $50k-75k , 95.0% for AGIs $75k-100k , 96.8% for AGIs $100k-200k , 100.0% for AGIs over 200k )
Averages for the 2012 tax year for zip code 11955, filed in 2013:
Average Adjusted Gross Income (AGI) in 2012: $60,389 (Individual Income Tax Returns) Here:
$60,389State:
$77,088
Salary/wage: $54,061 (reported on 76.9% of returns )Here:
$54,061State:
$60,593
(% of AGI for various income ranges: 64.9% for AGIs below $25k , 75.7% for AGIs $25k-50k , 70.8% for AGIs $50k-75k , 65.0% for AGIs $75k-100k , 69.2% for AGIs $100k-200k , 64.6% for AGIs over 200k ) Taxable interest for individuals: $1,318 (reported on 50.3% of returns )This zip code:
$1,318New York:
$3,125
(% of AGI for various income ranges: 1.8% for AGIs below $25k , 1.0% for AGIs $25k-50k , 1.5% for AGIs $50k-75k , 0.8% for AGIs $75k-100k , 1.2% for AGIs $100k-200k , 0.6% for AGIs over 200k ) Ordinary dividends: $3,907 (reported on 25.4% of returns )(% of AGI for various income ranges: 3.8% for AGIs below $25k , 1.5% for AGIs $25k-50k , 1.7% for AGIs $50k-75k , 1.1% for AGIs $75k-100k , 1.9% for AGIs $100k-200k , 0.7% for AGIs over 200k ) Net capital gain/loss in AGI: +$2,597 (reported on 18.5% of returns )Here:
+$2,597State:
+$42,474
(% of AGI for various income ranges: 2.8% for AGIs $100k-200k ) Profit/loss from business: +$9,895 (reported on 12.1% of returns )Here:
+$9,895State:
+$16,168
(% of AGI for various income ranges: 4.6% for AGIs below $25k , 2.7% for AGIs $25k-50k , 1.5% for AGIs $50k-75k , 1.8% for AGIs $75k-100k , 2.4% for AGIs $100k-200k ) Taxable individual retirement arrangement distribution: $13,515 (reported on 15.6% of returns )11955:
$13,515New York:
$17,621
(% of AGI for various income ranges: 6.0% for AGIs below $25k , 4.1% for AGIs $25k-50k , 2.8% for AGIs $50k-75k , 4.2% for AGIs $75k-100k , 4.3% for AGIs $100k-200k ) Total itemized deductions: $26,521 (27% of AGI, reported on 38.7% of returns )Here:
$26,521State:
$34,985
Here:
27.1% of AGIState:
21.3% of AGI
(% of AGI for various income ranges: 15.3% for AGIs below $25k , 12.4% for AGIs $25k-50k , 14.5% for AGIs $50k-75k , 16.8% for AGIs $75k-100k , 19.2% for AGIs $100k-200k , 20.5% for AGIs over 200k ) Charity contributions: $2,544 (reported on 34.1% of returns )(% of AGI for various income ranges: 0.7% for AGIs below $25k , 0.9% for AGIs $25k-50k , 1.6% for AGIs $50k-75k , 1.6% for AGIs $75k-100k , 1.6% for AGIs $100k-200k , 1.4% for AGIs over 200k ) Taxes paid: $12,358 (reported on 38.7% of returns )11955:
$12,358State:
$18,656
(% of AGI for various income ranges: 4.7% for AGIs below $25k , 4.8% for AGIs $25k-50k , 5.9% for AGIs $50k-75k , 7.8% for AGIs $75k-100k , 10.0% for AGIs $100k-200k , 10.0% for AGIs over 200k ) Earned income credit: $1,605 (reported on 11.6% of returns )(% of AGI for various income ranges: 3.3% for AGIs below $25k , 0.7% for AGIs $25k-50k ) Percentage of individuals using paid preparers for their 2012 taxes: 69.9%(% for various income ranges: 60.4% for AGIs below $25k , 68.3% for AGIs $25k-50k , 73.3% for AGIs $50k-75k , 77.8% for AGIs $75k-100k , 80.8% for AGIs $100k-200k , 80.0% for AGIs over 200k )
Averages for the 2004 tax year for zip code 11955, filed in 2005:
Average Adjusted Gross Income (AGI) in 2004: $55,347 (Individual Income Tax Returns) Here:
$55,347State:
$59,519
Salary/wage: $50,625 (reported on 77.6% of returns )Here:
$50,625State:
$50,673
(% of AGI for various income ranges: 2276.5% for AGIs below $10k , 60.9% for AGIs $10k-25k , 75.2% for AGIs $25k-50k , 71.7% for AGIs $50k-75k , 74.9% for AGIs $75k-100k , 66.4% for AGIs over 100k ) Taxable interest for individuals: $1,906 (reported on 62.8% of returns )This zip code:
$1,906New York:
$2,377
(% of AGI for various income ranges: 208.8% for AGIs below $10k , 4.4% for AGIs $10k-25k , 2.4% for AGIs $25k-50k , 2.4% for AGIs $50k-75k , 1.5% for AGIs $75k-100k , 1.7% for AGIs over 100k ) Taxable dividends: $3,004 (reported on 30.7% of returns )(% of AGI for various income ranges: 205.9% for AGIs below $10k , 3.1% for AGIs $10k-25k , 1.5% for AGIs $25k-50k , 1.6% for AGIs $50k-75k , 1.7% for AGIs $75k-100k , 1.3% for AGIs over 100k ) Net capital gain/loss: +$7,590 (reported on 25.3% of returns )Here:
+$7,590State:
+$23,581
(% of AGI for various income ranges: -55.9% for AGIs below $10k , -1.5% for AGIs $10k-25k , -0.4% for AGIs $25k-50k , -0.4% for AGIs $50k-75k , -0.2% for AGIs $75k-100k , 9.7% for AGIs over 100k ) Profit/loss from business: +$12,028 (reported on 12.6% of returns )Here:
+$12,028State:
+$13,809
(% of AGI for various income ranges: 252.9% for AGIs below $10k , 7.0% for AGIs $10k-25k , 2.0% for AGIs $25k-50k , 1.5% for AGIs $50k-75k , 1.4% for AGIs $75k-100k , 3.5% for AGIs over 100k ) IRA payment deduction: $3,456 (reported on 3.4% of returns )11955:
$3,456New York:
$3,115
(% of AGI for various income ranges: 0.5% for AGIs $25k-50k , 0.2% for AGIs $50k-75k , 0.2% for AGIs $75k-100k , 0.2% for AGIs over 100k ) Total itemized deductions: $21,784 (26% of AGI, reported on 44.0% of returns )Here:
$21,784State:
$25,864
Here:
25.6% of AGIState:
21.9% of AGI
(% of AGI for various income ranges: 861.8% for AGIs below $10k , 16.1% for AGIs $10k-25k , 13.3% for AGIs $25k-50k , 16.4% for AGIs $50k-75k , 18.1% for AGIs $75k-100k , 18.7% for AGIs over 100k ) Charity contributions deductions: $2,858 (3% of AGI, reported on 41.5% of returns )Here:
3.3% of AGIState:
3.6% of AGI
(% of AGI for various income ranges: 44.1% for AGIs below $10k , 1.3% for AGIs $10k-25k , 1.5% for AGIs $25k-50k , 2.0% for AGIs $50k-75k , 2.2% for AGIs $75k-100k , 2.6% for AGIs over 100k ) Total tax: $7,799 (reported on 83.9% of returns )11955:
$7,799State:
$11,730
(% of AGI for various income ranges: 91.2% for AGIs below $10k , 4.5% for AGIs $10k-25k , 8.1% for AGIs $25k-50k , 10.5% for AGIs $50k-75k , 10.9% for AGIs $75k-100k , 15.7% for AGIs over 100k ) Earned income credit: $1,439 (reported on 7.8% of returns )Percentage of individuals using paid preparers for their 2004 taxes: 68.0%(% for various income ranges: 62.7% for AGIs below $10k , 67.3% for AGIs $10k-25k , 63.7% for AGIs $25k-50k , 69.6% for AGIs $50k-75k , 71.7% for AGIs $75k-100k , 77.1% for AGIs over 100k )
Estimated median household income in 2022: This zip code:
$75,652New York:
$79,557
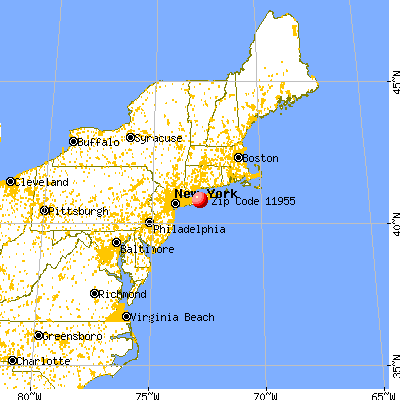
Nearest zip codes: 11934 ,
11950 ,
11951 ,
11949 ,
11967 ,
11940 .
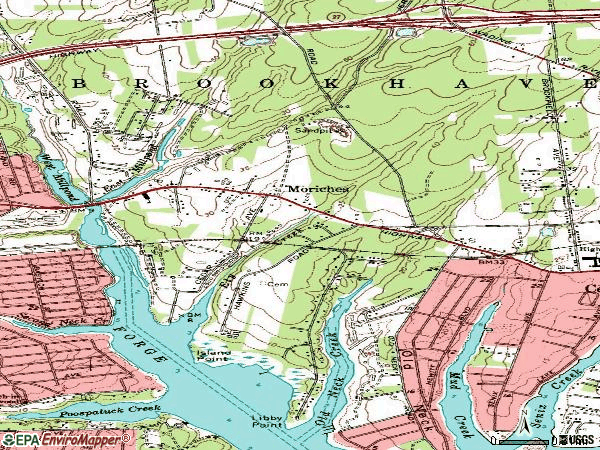
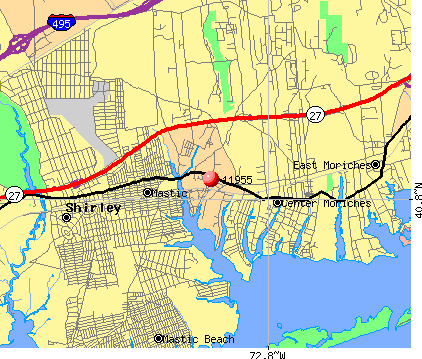
Moriches Zip Code Map
Percentage of family households: This zip code:
33.3%New York:
41.3%
Percentage of households with unmarried partners: This zip code:
9.0%New York:
42.3%
No gay or lesbian households reported
Household received Food Stamps/SNAP in the past 12 months: 178Household did not receive Food Stamps/SNAP in the past 12 months: 1,298
Women who had a birth in the past 12 months: 45 (45 now married , 0 unmarried) Women who did not have a birth in the past 12 months: 600 (214 now married , 386 unmarried)
Housing units in zip code 11955 with a mortgage: 290 (37
second mortgage , 26
both second mortgage and home equity loan )
Houses without a mortgage: 6
Median monthly owner costs for units with a mortgage: $2,972
Median monthly owner costs for units without a mortgage: $1,401
Residents with income below the poverty level in 2022:
This zip code:
13.9%Whole state:
14.3%
Residents with income below 50% of the poverty level in 2022:
This zip code:
4.8%Whole state:
6.8%
Median number of rooms in houses and condos: Median number of rooms in apartments:
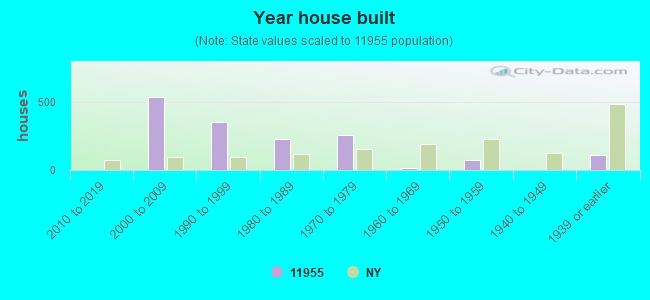
Year house built (houses)
0 2020 or later0 2010 to 2019535 2000 to 2009353 1990 to 1999227 1980 to 1989261 1970 to 197918 1960 to 196971 1950 to 19590 1940 to 1949111 1939 or earlier
Zip code 11955 household income distribution in 2022 137 Less than $10,00052 $10,000 to $14,9994 $15,000 to $19,99939 $20,000 to $24,99937 $25,000 to $29,99972 $30,000 to $34,99928 $35,000 to $39,99936 $40,000 to $44,99984 $45,000 to $49,999142 $50,000 to $59,99997 $60,000 to $74,999241 $75,000 to $99,999172 $100,000 to $124,99992 $125,000 to $149,999220 $150,000 to $199,99924 $200,000 or moreEstimate of home value of owner-occupied houses/condos in 2022 in zip code 11955 21 Less than $10,00072 $200,000 to $249,99939 $250,000 to $299,999164 $300,000 to $399,999149 $400,000 to $499,999157 $500,000 to $749,99954 $750,000 to $999,999Rent paid by renters in 2022 in zip code 11955 40 $200 to $2491 $250 to $29965 $400 to $4493 $550 to $5999 $700 to $7491 $750 to $79951 $1,000 to $1,249229 $1,500 to $1,999362 $2,000 to $2,49949 $2,500 to $2,99926 $3,000 to $3,499
Median gross rent in 2022: $2,141.
Estimated median house (or condo) value in 2022 for: White Non-Hispanic householders: $434,349Black or African American householders: $194,621Asian householders: $629,658Some other race householders: $314,829Hispanic or Latino householders: $274,760Estimated median house or condo value in 2022: $439,387
11955:
$439,387New York:
$400,400
Lower value quartile - upper value quartile: $340,523 - $571,054
Mean price in 2022: Detached houses: $664,885Here:
$664,885State:
$476,719
Townhouses or other attached units: $541,828Here:
$541,828State:
$699,270
In 2-unit structures: $735,387Here:
$735,387State:
$713,077
In 3-to-4-unit structures: $523,799Here:
$523,799State:
$764,568
In 5-or-more-unit structures: $413,065Here:
$413,065State:
$912,009
Mobile homes: $230,025Here:
$230,025State:
$88,925
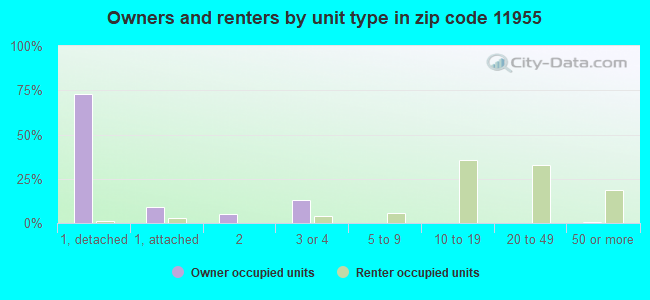
Housing units in structures:
One, detached: 538One, attached: 90Two: 323 or 4: 1285 to 9: 4810 to 19: 30320 to 49: 29750 or more: 159Unemployment : 2.6%
Means of transportation to work in zip code 11955 84.1% 1,081 Drove a car alone4.0% 51 Carpooled0.2% 2 Bus or trolley bus2.9% 37 Subway or elevated4.2% 54 Other means2.5% 32 Worked at homeTravel time to work (commute) in zip code 11955 2 Less than 5 minutes87 5 to 9 minutes17 10 to 14 minutes56 15 to 19 minutes265 20 to 24 minutes139 25 to 29 minutes259 30 to 34 minutes9 35 to 39 minutes53 40 to 44 minutes138 45 to 59 minutes63 60 to 89 minutes125 90 or more minutes
Percentage of zip code residents living and working in this county: 82.3%
Household type by relationship:
Households: 2,811
Male householders: 776 (281 living alone ), Female householders: 707 (274 living alone )621 spouses (621 opposite-sex spouses ), 78 unmarried partners , (78 opposite-sex unmarried partners ), 497 children (498 natural , 0 adopted , 0 stepchildren ), 0 grandchildren , 0 brothers or sisters , 39 parents , 0 foster children , 68 other relatives , 43 non-relatives In group quarters: 13 (-1 institutionalized population )
Size of family households: 551 2-persons , 205 3-persons , 43 4-persons , 46 5-persons
Size of nonfamily households: 555 1-person , 94 2-persons
257 married couples with children. single-parent households (129 women ).
87.9% of residents of 11955 zip code speak English at home. of residents speak Spanish at home (49% very well, 33% well, 18% not well ).of residents speak other Indo-European language at home (26% very well, 74% not well ).
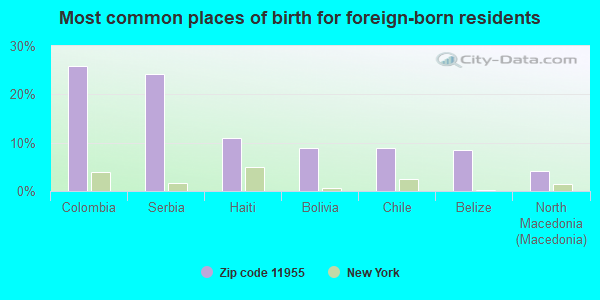
Foreign born population: 317 (11.3%)
(63.2%
of them are naturalized citizens )
This zip code:
11.3%Whole state:
22.7%
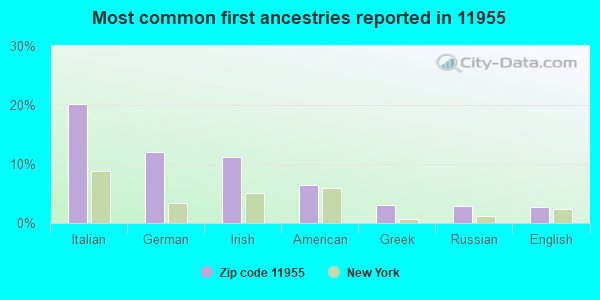
26% Colombia 24% Serbia 11% Haiti 9% Bolivia 9% Chile 9% Belize 4% North Macedonia (Macedonia) 20% Italian 12% German 11% Irish 6% American 3% Greek 3% Russian 3% English
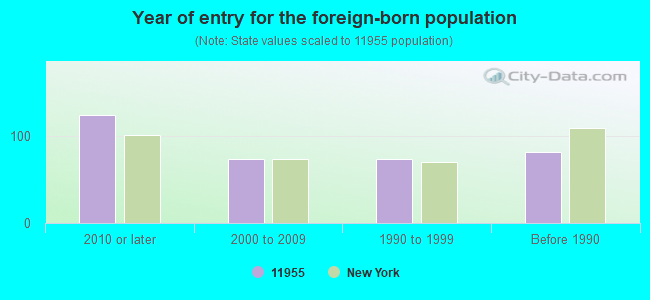
Year of entry for the foreign-born population
124 2010 or later 74 2000 to 2009 73 1990 to 1999 82 Before 1990
Facilities with environmental interests located in this zip code:
BARNES ROAD DUCK FARM (BARNES ROAD in MORICHES, NY)
National Pollutant Discharge Elimination System NON-MAJOR (Tracking pollutant discharge elimination systems) - permit Business SIC classification: POULTRY AND EGGSOrganizations: TITMUS & SONS BARNES RD DUCK (CONTACT/OWNER)
Alternative names: TITMUS & SONS BARNES RD DUCK
Housing units lacking complete kitchen facilities: 1.6%
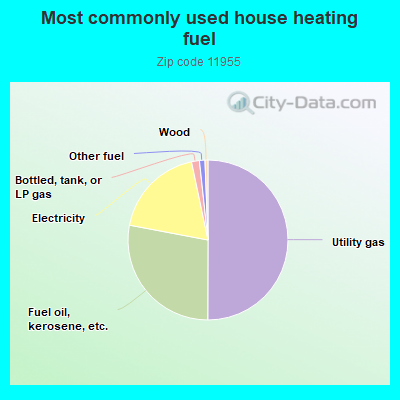
50.0% Utility gas 27.9% Fuel oil, kerosene, etc. 18.7% Electricity 1.6% Bottled, tank, or LP gas 1.1% Other fuel 0.6% Wood
Population in 1990: 2,045. Population change in the 1990s: +607 (+29.7%).
Place of birth for U.S.-born residents:
This state: 2,306Northeast: 6Midwest: 27South: 81West: 29
48% of the 11955 zip code residents lived in the same house 5 years ago.
Out of people who lived in different houses, 79% lived in this county.
Out of people who lived in different counties, 50% lived in New York.
95% of the 11955 zip code residents lived in the same house 1 year ago.
Out of people who lived in different houses, 50% moved from this county.
Out of people who lived in different houses, 5% moved from different county within same state.
Out of people who lived in different houses, 45% moved from different state.
Private vs. public school enrollment:
Students in private schools in grades 1 to 8 (elementary and middle school):
Students in private schools in grades 9 to 12 (high school):
Students in private undergraduate colleges: 33
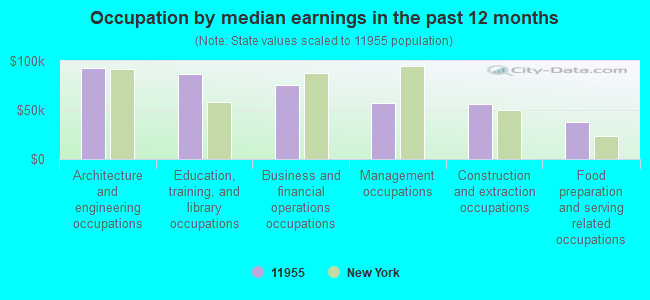
Occupation by median earnings in the past 12 months ($)
93,149 Architecture and engineering occupations 86,933 Education, training, and library occupations 75,027 Business and financial operations occupations 56,841 Management occupations 55,695 Construction and extraction occupations 37,807 Food preparation and serving related occupations
Companies with federal contracts located in this zip code:
TECHNICAL MECHANICAL SERVICES (225 MONTAUK HIGHWAY in MORICHES, NY; small business) in 29 contracts from 2001 to 2004
Contracts for Maintenance, Repair and Rebuilding of Equipment -- Refrigeration, Air Conditioning, and Air Circulating Equipment, Maintenance, Repair or Alteration of Real Property -- Office Buildings, Maintenance, Repair or Alteration of Real Property -- Miscellaneous Buildings by Public Buildings Service, United States Coast Guard (disused code: now 7008), NavySigned by year: 2000: $0; 2001: $239,763; 2002: $41,494; 2003: $1,249; 2004: $149,580; 2005: $0; 2006: $0.
Biggest contracts: with Public Buildings Service for Maintenance, Repair and Rebuilding of Equipment -- Refrigeration, Air Conditioning, and Air Circulating Equipment. Signed on 2001-07-15. Completion date: 2004-07-15.
, same as above. Signed on 2004-07-12. Effective on 2004-07-26. Completion date: 2006-07-25.
with United States Coast Guard (disused code: now 7008) for Maintenance, Repair or Alteration of Real Property -- Office Buildings. Signed on 2001-04-15. Completion date: 2001-10-15.
with Public Buildings Service for Maintenance, Repair or Alteration of Real Property -- Office Buildings. Signed on 2001-12-15. Completion date: 2002-04-15.
Top industries in this zip code by the number of employees in 2005:
Accommodation and Food Services: Full-Service Restaurants (20-49 employees: 1 establishment, 10-19 employees: 1 establishment)Real Estate and Rental and Leasing: Lessors of Residential Buildings and Dwellings (20-49: 1, 1-4: 1)Health Care and Social Assistance: Residential Mental Retardation Facilities (10-19: 1, 5-9: 1, 1-4: 1)Health Care and Social Assistance: Offices of Dentists (10-19: 1, 1-4: 3)Other Services (except Public Administration): Other Personal Care Services (10-19: 1, 1-4: 1)Arts, Entertainment, and Recreation: Fitness and Recreational Sports Centers (10-19: 1, 1-4: 1)Construction: Finish Carpentry Contractors (10-19: 1, 1-4: 1)
People in group quarters in 2010:
7 people in group homes intended for adults
People in group quarters in 2000:
16 people in agriculture workers' dormitories on farms
13 people in homes for the mentally retarded
2 people in religious group quarters
Fatal accident statistics in 2014:
Fatal accident count: 1Vehicles involved in fatal accidents: 1Fatal accidents caused by drunken drivers: 1Fatalities: 1Persons involved in fatal accidents: 2Pedestrians involved in fatal accidents: 0
Fatal accident statistics in 2012:
Fatal accident count: 1Vehicles involved in fatal accidents: 1Fatal accidents caused by drunken drivers: 1Fatalities: 1Persons involved in fatal accidents: 1Pedestrians involved in fatal accidents: 0
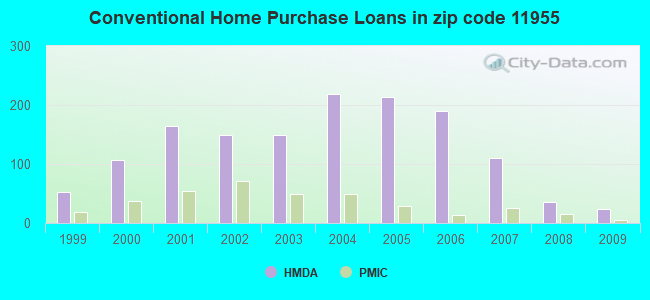
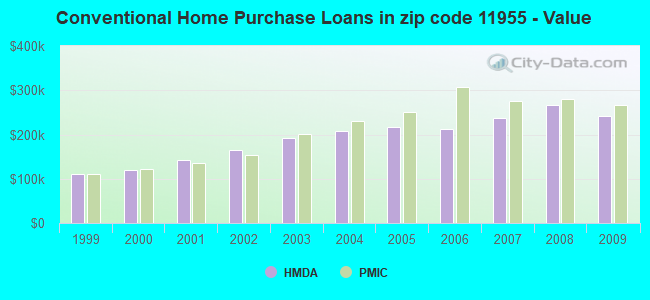
Home Mortgage Disclosure Act Aggregated Statistics For Year 2009(Based on 6 partial tracts) A) FHA, FSA/RHS & VA B) Conventional C) Refinancings D) Home Improvement Loans F) Non-occupant Loans on G) Loans On Manufactured Number Average Value Number Average Value Number Average Value Number Average Value Number Average Value Number Average Value
LOANS ORIGINATED 34 $218,836 23 $241,838 83 $209,133 8 $112,312 5 $194,508 0 $0 APPLICATIONS APPROVED, NOT ACCEPTED 0 $0 5 $198,226 12 $225,628 2 $45,530 1 $91,070 0 $0 APPLICATIONS DENIED 8 $189,584 9 $174,549 69 $245,914 10 $39,490 5 $131,370 1 $58,130 APPLICATIONS WITHDRAWN 7 $212,329 3 $344,403 49 $221,505 1 $303,140 4 $145,320 0 $0 FILES CLOSED FOR INCOMPLETENESS 0 $0 1 $164,700 11 $234,212 1 $106,570 0 $0 0 $0
Aggregated Statistics For Year 2008(Based on 6 partial tracts) A) FHA, FSA/RHS & VA B) Conventional C) Refinancings D) Home Improvement Loans F) Non-occupant Loans on G) Loans On Manufactured Number Average Value Number Average Value Number Average Value Number Average Value Number Average Value Number Average Value
LOANS ORIGINATED 20 $265,228 36 $266,373 63 $197,629 17 $123,513 10 $176,799 0 $0 APPLICATIONS APPROVED, NOT ACCEPTED 1 $233,480 10 $372,093 19 $207,651 4 $70,212 2 $243,715 0 $0 APPLICATIONS DENIED 4 $256,795 16 $268,351 89 $249,982 26 $57,448 5 $188,564 0 $0 APPLICATIONS WITHDRAWN 9 $297,312 14 $311,735 30 $252,010 3 $203,980 3 $166,943 1 $89,130 FILES CLOSED FOR INCOMPLETENESS 0 $0 3 $320,800 9 $247,929 2 $27,550 0 $0 0 $0
Aggregated Statistics For Year 2007(Based on 6 partial tracts) A) FHA, FSA/RHS & VA B) Conventional C) Refinancings D) Home Improvement Loans E) Loans on Dwellings For 5+ Families F) Non-occupant Loans on G) Loans On Manufactured Number Average Value Number Average Value Number Average Value Number Average Value Number Average Value Number Average Value Number Average Value
LOANS ORIGINATED 10 $266,514 110 $237,698 173 $218,234 48 $80,992 1 $53,284,000 27 $226,372 0 $0 APPLICATIONS APPROVED, NOT ACCEPTED 0 $0 24 $212,396 42 $231,296 11 $91,770 0 $0 5 $253,822 1 $94,940 APPLICATIONS DENIED 5 $198,798 64 $252,483 214 $265,902 44 $98,325 0 $0 28 $206,426 3 $84,283 APPLICATIONS WITHDRAWN 4 $301,860 27 $226,102 83 $248,072 17 $131,625 0 $0 12 $164,298 0 $0 FILES CLOSED FOR INCOMPLETENESS 0 $0 8 $258,999 26 $276,437 3 $97,837 0 $0 2 $248,495 0 $0
Aggregated Statistics For Year 2006(Based on 6 partial tracts) A) FHA, FSA/RHS & VA B) Conventional C) Refinancings D) Home Improvement Loans F) Non-occupant Loans on G) Loans On Manufactured Number Average Value Number Average Value Number Average Value Number Average Value Number Average Value Number Average Value
LOANS ORIGINATED 12 $301,448 190 $213,197 296 $207,067 61 $77,542 30 $230,203 1 $7,750 APPLICATIONS APPROVED, NOT ACCEPTED 1 $397,040 29 $208,138 50 $197,177 12 $46,473 2 $170,150 0 $0 APPLICATIONS DENIED 0 $0 82 $201,830 207 $234,798 43 $99,753 18 $207,787 0 $0 APPLICATIONS WITHDRAWN 0 $0 29 $239,053 146 $226,757 11 $182,812 10 $204,387 0 $0 FILES CLOSED FOR INCOMPLETENESS 0 $0 8 $208,279 46 $251,540 3 $51,560 1 $221,860 0 $0
Aggregated Statistics For Year 2005(Based on 6 partial tracts) A) FHA, FSA/RHS & VA B) Conventional C) Refinancings D) Home Improvement Loans F) Non-occupant Loans on G) Loans On Manufactured Number Average Value Number Average Value Number Average Value Number Average Value Number Average Value Number Average Value
LOANS ORIGINATED 8 $271,774 214 $217,417 353 $205,543 61 $96,277 35 $202,839 1 $135,020 APPLICATIONS APPROVED, NOT ACCEPTED 0 $0 37 $209,094 58 $224,428 16 $101,641 7 $212,170 0 $0 APPLICATIONS DENIED 0 $0 59 $236,123 192 $219,982 40 $92,498 9 $233,948 0 $0 APPLICATIONS WITHDRAWN 0 $0 63 $219,008 155 $218,788 21 $135,698 14 $233,776 0 $0 FILES CLOSED FOR INCOMPLETENESS 0 $0 14 $208,531 81 $244,558 3 $112,100 1 $388,540 0 $0
Aggregated Statistics For Year 2004(Based on 6 partial tracts) A) FHA, FSA/RHS & VA B) Conventional C) Refinancings D) Home Improvement Loans F) Non-occupant Loans on G) Loans On Manufactured Number Average Value Number Average Value Number Average Value Number Average Value Number Average Value Number Average Value
LOANS ORIGINATED 21 $236,030 219 $207,777 364 $180,781 58 $113,935 50 $190,621 2 $36,025 APPLICATIONS APPROVED, NOT ACCEPTED 2 $221,855 33 $210,728 82 $182,044 17 $101,505 12 $159,352 0 $0 APPLICATIONS DENIED 10 $233,481 59 $229,045 161 $185,921 71 $81,917 8 $169,189 3 $106,160 APPLICATIONS WITHDRAWN 3 $267,073 36 $218,132 175 $177,185 20 $81,200 13 $154,998 0 $0 FILES CLOSED FOR INCOMPLETENESS 3 $141,767 12 $210,836 83 $193,793 2 $160,640 8 $131,272 0 $0
Aggregated Statistics For Year 2003(Based on 6 partial tracts) A) FHA, FSA/RHS & VA B) Conventional C) Refinancings D) Home Improvement Loans E) Loans on Dwellings For 5+ Families F) Non-occupant Loans on Number Average Value Number Average Value Number Average Value Number Average Value Number Average Value Number Average Value
LOANS ORIGINATED 32 $195,143 149 $192,066 532 $156,518 40 $28,946 1 $67,820 33 $141,902 APPLICATIONS APPROVED, NOT ACCEPTED 2 $152,100 32 $182,239 130 $146,905 11 $39,340 0 $0 17 $138,147 APPLICATIONS DENIED 8 $188,916 30 $191,000 200 $146,049 54 $38,765 0 $0 13 $121,945 APPLICATIONS WITHDRAWN 8 $177,632 27 $191,434 186 $159,473 13 $49,938 0 $0 9 $151,821 FILES CLOSED FOR INCOMPLETENESS 2 $158,400 8 $161,404 25 $158,182 5 $44,924 0 $0 1 $124,960
Aggregated Statistics For Year 2002(Based on 6 partial tracts) A) FHA, FSA/RHS & VA B) Conventional C) Refinancings D) Home Improvement Loans E) Loans on Dwellings For 5+ Families F) Non-occupant Loans on Number Average Value Number Average Value Number Average Value Number Average Value Number Average Value Number Average Value
LOANS ORIGINATED 37 $154,192 150 $164,508 344 $127,094 64 $33,517 1 $516,820 32 $123,962 APPLICATIONS APPROVED, NOT ACCEPTED 5 $192,712 15 $246,423 72 $121,972 14 $33,991 0 $0 3 $343,383 APPLICATIONS DENIED 12 $146,718 33 $177,235 164 $121,371 45 $28,302 0 $0 11 $158,051 APPLICATIONS WITHDRAWN 6 $168,428 20 $140,744 169 $125,635 29 $34,798 1 $36,810 9 $116,690 FILES CLOSED FOR INCOMPLETENESS 2 $174,385 13 $149,543 48 $115,029 2 $109,540 0 $0 3 $118,973
Aggregated Statistics For Year 2001(Based on 6 partial tracts) A) FHA, FSA/RHS & VA B) Conventional C) Refinancings D) Home Improvement Loans E) Loans on Dwellings For 5+ Families F) Non-occupant Loans on Number Average Value Number Average Value Number Average Value Number Average Value Number Average Value Number Average Value
LOANS ORIGINATED 62 $133,097 165 $143,401 226 $115,544 47 $39,518 3 $172,090 31 $98,450 APPLICATIONS APPROVED, NOT ACCEPTED 2 $101,425 20 $149,982 55 $92,844 11 $39,554 0 $0 3 $132,007 APPLICATIONS DENIED 9 $125,966 37 $133,836 178 $102,726 45 $29,952 0 $0 10 $93,153 APPLICATIONS WITHDRAWN 7 $119,707 33 $130,076 120 $108,736 22 $40,571 0 $0 7 $78,123 FILES CLOSED FOR INCOMPLETENESS 3 $138,860 6 $131,323 29 $103,028 0 $0 0 $0 0 $0
Aggregated Statistics For Year 2000(Based on 6 partial tracts) A) FHA, FSA/RHS & VA B) Conventional C) Refinancings D) Home Improvement Loans F) Non-occupant Loans on Number Average Value Number Average Value Number Average Value Number Average Value Number Average Value
LOANS ORIGINATED 70 $112,754 107 $119,494 75 $84,814 40 $29,231 22 $77,403 APPLICATIONS APPROVED, NOT ACCEPTED 2 $72,035 29 $143,797 28 $78,300 14 $28,996 5 $93,884 APPLICATIONS DENIED 7 $123,534 51 $121,746 125 $72,906 41 $26,869 12 $68,526 APPLICATIONS WITHDRAWN 14 $119,669 20 $101,345 87 $73,266 5 $25,284 4 $58,958 FILES CLOSED FOR INCOMPLETENESS 1 $172,060 9 $134,336 13 $115,611 2 $35,865 2 $63,940
Aggregated Statistics For Year 1999(Based on 3 partial tracts) A) FHA, FSA/RHS & VA B) Conventional C) Refinancings D) Home Improvement Loans E) Loans on Dwellings For 5+ Families F) Non-occupant Loans on Number Average Value Number Average Value Number Average Value Number Average Value Number Average Value Number Average Value
LOANS ORIGINATED 21 $109,038 52 $111,170 55 $85,473 18 $18,019 1 $89,840 9 $86,801 APPLICATIONS APPROVED, NOT ACCEPTED 0 $0 9 $106,159 30 $115,548 5 $37,238 0 $0 3 $71,060 APPLICATIONS DENIED 5 $111,558 11 $91,326 42 $68,622 18 $31,758 0 $0 3 $62,017 APPLICATIONS WITHDRAWN 8 $100,829 10 $90,133 49 $72,620 6 $51,993 0 $0 3 $69,610 FILES CLOSED FOR INCOMPLETENESS 1 $80,050 3 $117,723 11 $79,632 0 $0 0 $0 1 $81,210
Detailed HMDA statistics for the following Tracts:
1594.04
,
1594.06 ,
1596.01
Private Mortgage Insurance Companies Aggregated Statistics For Year 2009(Based on 6 partial tracts) A) Conventional B) Refinancings Number Average Value Number Average Value
LOANS ORIGINATED 5 $266,818 1 $195,290 APPLICATIONS APPROVED, NOT ACCEPTED 1 $388,190 2 $256,410 APPLICATIONS DENIED 1 $517,910 2 $161,920 APPLICATIONS WITHDRAWN 2 $149,680 1 $285,800 FILES CLOSED FOR INCOMPLETENESS 0 $0 0 $0
Aggregated Statistics For Year 2008(Based on 6 partial tracts) A) Conventional B) Refinancings C) Non-occupant Loans on Number Average Value Number Average Value Number Average Value
LOANS ORIGINATED 16 $280,482 5 $295,390 1 $153,070 APPLICATIONS APPROVED, NOT ACCEPTED 14 $242,644 5 $276,384 2 $153,070 APPLICATIONS DENIED 7 $248,274 3 $277,533 2 $204,900 APPLICATIONS WITHDRAWN 0 $0 0 $0 0 $0 FILES CLOSED FOR INCOMPLETENESS 1 $258,060 1 $418,950 1 $408,230
Aggregated Statistics For Year 2007(Based on 6 partial tracts) A) Conventional B) Refinancings C) Non-occupant Loans on Number Average Value Number Average Value Number Average Value
LOANS ORIGINATED 25 $275,708 15 $290,062 2 $287,585 APPLICATIONS APPROVED, NOT ACCEPTED 4 $233,740 13 $282,584 0 $0 APPLICATIONS DENIED 1 $345,860 0 $0 0 $0 APPLICATIONS WITHDRAWN 2 $268,360 3 $278,227 0 $0 FILES CLOSED FOR INCOMPLETENESS 0 $0 1 $277,080 0 $0
Aggregated Statistics For Year 2006(Based on 6 partial tracts) A) Conventional B) Refinancings Number Average Value Number Average Value
LOANS ORIGINATED 14 $308,391 3 $334,660 APPLICATIONS APPROVED, NOT ACCEPTED 3 $269,423 4 $287,112 APPLICATIONS DENIED 0 $0 0 $0 APPLICATIONS WITHDRAWN 1 $205,590 0 $0 FILES CLOSED FOR INCOMPLETENESS 1 $293,630 0 $0
Aggregated Statistics For Year 2005(Based on 6 partial tracts) A) Conventional B) Refinancings C) Non-occupant Loans on Number Average Value Number Average Value Number Average Value
LOANS ORIGINATED 28 $251,379 10 $236,097 1 $259,060 APPLICATIONS APPROVED, NOT ACCEPTED 15 $233,925 1 $222,820 6 $162,920 APPLICATIONS DENIED 0 $0 0 $0 0 $0 APPLICATIONS WITHDRAWN 4 $274,812 1 $224,760 2 $198,605 FILES CLOSED FOR INCOMPLETENESS 0 $0 0 $0 0 $0
Aggregated Statistics For Year 2004(Based on 6 partial tracts) A) Conventional B) Refinancings C) Non-occupant Loans on Number Average Value Number Average Value Number Average Value
LOANS ORIGINATED 50 $230,389 4 $252,092 7 $158,744 APPLICATIONS APPROVED, NOT ACCEPTED 16 $198,516 3 $152,390 6 $152,908 APPLICATIONS DENIED 9 $213,928 0 $0 5 $208,952 APPLICATIONS WITHDRAWN 4 $215,652 0 $0 0 $0 FILES CLOSED FOR INCOMPLETENESS 0 $0 0 $0 0 $0
Aggregated Statistics For Year 2003(Based on 6 partial tracts) A) Conventional B) Refinancings C) Non-occupant Loans on Number Average Value Number Average Value Number Average Value
LOANS ORIGINATED 49 $201,725 12 $184,737 4 $167,075 APPLICATIONS APPROVED, NOT ACCEPTED 14 $195,921 8 $191,054 1 $234,480 APPLICATIONS DENIED 2 $218,660 0 $0 0 $0 APPLICATIONS WITHDRAWN 4 $167,602 0 $0 2 $155,010 FILES CLOSED FOR INCOMPLETENESS 1 $156,950 0 $0 0 $0
Aggregated Statistics For Year 2002(Based on 6 partial tracts) A) Conventional B) Refinancings C) Non-occupant Loans on Number Average Value Number Average Value Number Average Value
LOANS ORIGINATED 71 $153,585 20 $150,889 11 $104,953 APPLICATIONS APPROVED, NOT ACCEPTED 14 $157,832 7 $123,269 4 $110,635 APPLICATIONS DENIED 4 $163,795 0 $0 0 $0 APPLICATIONS WITHDRAWN 4 $163,370 1 $118,190 1 $99,790 FILES CLOSED FOR INCOMPLETENESS 2 $122,005 0 $0 0 $0
Aggregated Statistics For Year 2001(Based on 6 partial tracts) A) Conventional B) Refinancings C) Non-occupant Loans on Number Average Value Number Average Value Number Average Value
LOANS ORIGINATED 54 $135,603 12 $142,942 11 $90,891 APPLICATIONS APPROVED, NOT ACCEPTED 18 $137,194 6 $141,182 3 $84,930 APPLICATIONS DENIED 3 $133,943 1 $119,690 2 $98,335 APPLICATIONS WITHDRAWN 2 $141,710 0 $0 0 $0 FILES CLOSED FOR INCOMPLETENESS 2 $93,490 1 $161,940 0 $0
Aggregated Statistics For Year 2000(Based on 6 partial tracts) A) Conventional B) Refinancings C) Non-occupant Loans on Number Average Value Number Average Value Number Average Value
LOANS ORIGINATED 37 $121,820 6 $120,208 3 $76,680 APPLICATIONS APPROVED, NOT ACCEPTED 7 $126,770 0 $0 1 $72,660 APPLICATIONS DENIED 2 $124,085 0 $0 0 $0 APPLICATIONS WITHDRAWN 1 $66,730 0 $0 0 $0 FILES CLOSED FOR INCOMPLETENESS 0 $0 0 $0 0 $0
Aggregated Statistics For Year 1999(Based on 3 partial tracts) A) Conventional B) Refinancings C) Non-occupant Loans on Number Average Value Number Average Value Number Average Value
LOANS ORIGINATED 19 $111,635 5 $104,940 3 $69,310 APPLICATIONS APPROVED, NOT ACCEPTED 5 $128,616 0 $0 1 $54,100 APPLICATIONS DENIED 2 $55,860 0 $0 1 $86,460 APPLICATIONS WITHDRAWN 1 $75,710 0 $0 0 $0 FILES CLOSED FOR INCOMPLETENESS 0 $0 0 $0 0 $0
Detailed PMIC statistics for the following Tracts:
1594.04
,
1594.06 ,
1596.01
Most common first names in zip code 11955 among deceased individuals Name Count Lived (average)
John 30 75.2 years William 14 73.0 years Dorothy 12 78.6 years Robert 11 74.6 years Edward 11 71.5 years Helen 11 79.3 years Charles 11 75.5 years James 10 74.8 years Joseph 10 71.1 years Richard 8 72.0 years
Most common last names in zip code 11955 among deceased individuals Last name Count Lived (average)
Hulse 6 75.5 years Moran 4 79.8 years Jurgielewicz 3 77.7 years Bonanno 3 69.3 years Edwards 3 77.0 years Gamboni 3 88.0 years Foote 3 74.7 years Madison 3 84.3 years Mccarthy 3 78.3 years Oconnor 3 83.7 years


 Nearest zip codes: 11934, 11950, 11951, 11949, 11967, 11940.