Estimated zip code population in 2022: 1,200 Zip code population in 2010: 743 Zip code population in 2000: 662
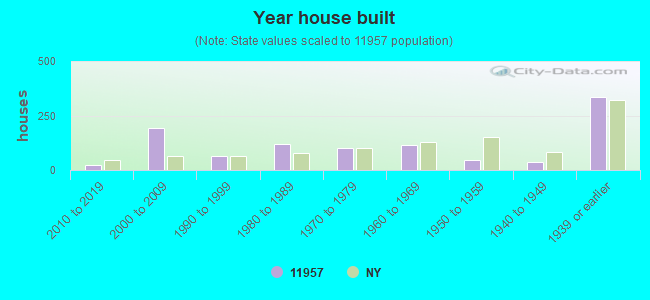
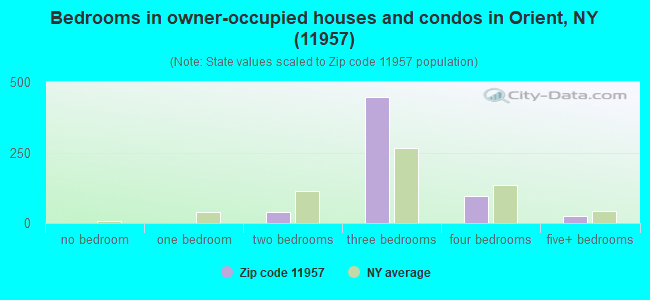
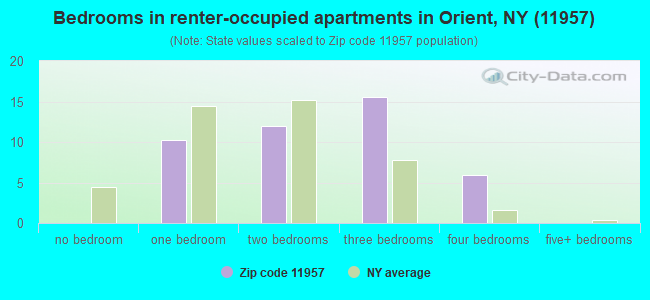
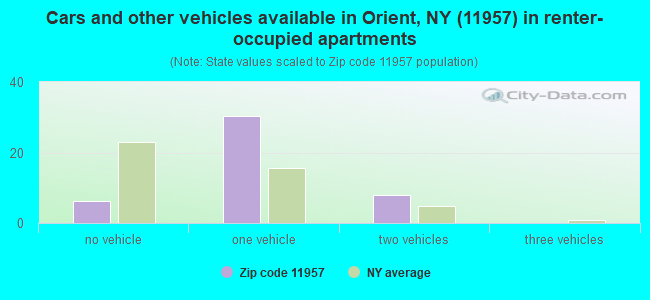
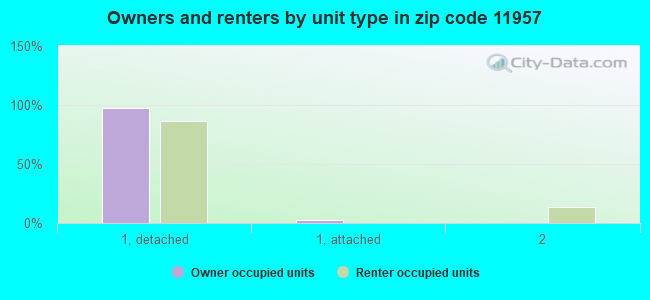
Houses and condos: 1,049 Renter-occupied apartments: 44
% of renters here:
7%
State:
46%
March 2022 cost of living index in zip code 11957: 130.2 (high, U.S. average is 100)
Land area: 6.5 sq. mi. Water area: 15.4 sq. mi.
Population density: 186 people per square mile
(very low).
OSM Map
General Map
Google Map
MSN Map
OSM Map
General Map
Google Map
MSN Map
OSM Map
General Map
Google Map
MSN Map
OSM Map
General Map
Google Map
MSN Map
Please wait while loading the map...
Real estate property taxes paid for housing units in 2022:
This zip code:
0.6% ($5,613)
New York:
1.5% ($6,180)
Median real estate property taxes paid for housing units with mortgages in 2022: $5,758 (0.7%) Median real estate property taxes paid for housing units with no mortgage in 2022: $5,130 (0.5%)
Business Search- 14 Million verified businesses
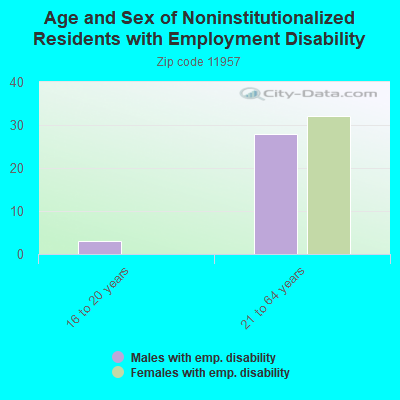
Males: 631
(52.6%)
Females: 568
(47.4%)
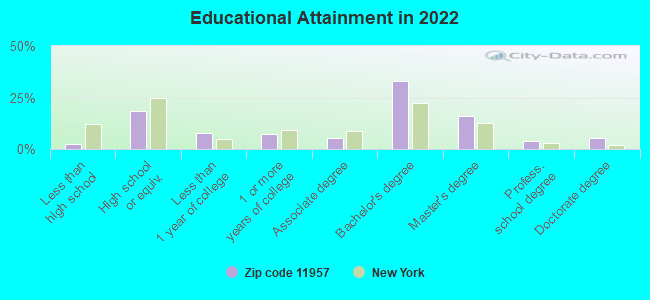
For population 25 years and over in 11957:
High school or higher: 98.8%
Bachelor's degree or higher: 59.0%
Graduate or professional degree: 25.8%
Unemployed: 7.0%
Mean travel time to work (commute): 24.6 minutes
For population 15 years and over in 11957:
Never married: 26.4%
Now married: 54.1%
Separated: 0.0%
Widowed: 10.6%
Divorced: 8.9%
Zip code 11957 compared to state average:
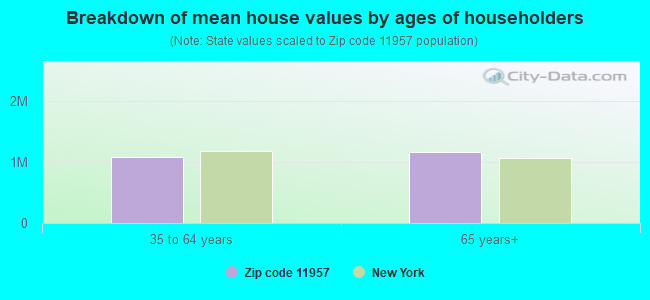
Median house value above state average.
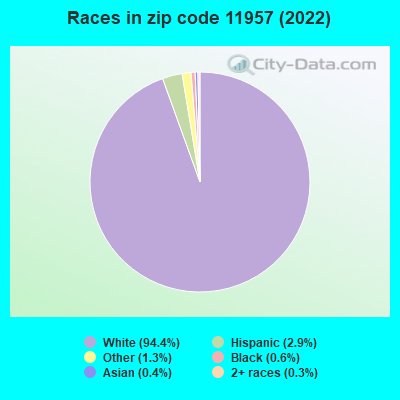
Black race population percentage significantly below state average.
Hispanic race population percentage significantly below state average.
Median age significantly above state average.
Foreign-born population percentage below state average.
Renting percentage significantly below state average.
Length of stay since moving in significantly above state average.
Number of rooms per house above state average.
Percentage of population with a bachelor's degree or higher above state average.
Estimated median house/condo value in 2022: $879,712
11957:
$879,712
New York:
$400,400
Median resident age:
This zip code:
65.9 years
New York median age:
40.0 years
Average household size:
This zip code:
1.8 people
New York:
2.5 people
Averages for the 2020 tax year for zip code 11957, filed in 2021:
Average Adjusted Gross Income (AGI) in 2020: $246,753 (Individual Income Tax Returns)
Here:
$246,753
State:
$90,930
Salary/wage: $144,671 (reported on 62.2% of returns)
Here:
$144,671
State:
$72,104
(% of AGI for various income ranges: 1212.5% for AGIs below $25k, 4376.7% for AGIs $25k-50k, 2720.0% for AGIs $50k-75k, 16435.0% for AGIs $100k-200k)
Taxable interest for individuals: $7,183 (reported on 64.4% of returns)
This zip code:
$7,183
New York:
$3,075
(% of AGI for various income ranges: 17.5% for AGIs below $25k, 106.7% for AGIs $25k-50k, 70.0% for AGIs $50k-75k, 745.0% for AGIs $100k-200k)
Ordinary dividends: $19,146 (reported on 57.8% of returns)
Here:
$19,146
State:
$11,095
(% of AGI for various income ranges: 110.0% for AGIs below $25k, 710.0% for AGIs $25k-50k, 255.0% for AGIs $50k-75k, 1522.5% for AGIs $100k-200k)
Net capital gain/loss in AGI: +$43,223 (reported on 48.9% of returns)
Here:
+$43,223
State:
+$44,925
(% of AGI for various income ranges: 563.3% for AGIs $25k-50k, 1912.5% for AGIs $100k-200k)
Profit/loss from business: +$48,036 (reported on 24.4% of returns)
Here:
+$48,036
State:
+$14,940
(% of AGI for various income ranges: 2103.3% for AGIs $25k-50k)
Taxable individual retirement arrangement distribution: $34,678 (reported on 20.0% of returns)
11957:
$34,678
New York:
$19,609
(% of AGI for various income ranges: 382.5% for AGIs below $25k, 1035.0% for AGIs $50k-75k, 2362.5% for AGIs $100k-200k)
Total itemized deductions: $35,254 (reported on 28.9% of returns)
Here:
$35,254
State:
$39,326
(% of AGI for various income ranges: 2342.5% for AGIs $50k-75k, 2795.0% for AGIs $100k-200k)
Charity contributions: $7,592 (reported on 26.7% of returns)
Here:
$7,592
State:
$15,420
(% of AGI for various income ranges: 286.7% for AGIs $25k-50k, 327.5% for AGIs $100k-200k)
Taxes paid: $8,938 (reported on 28.9% of returns)
11957:
$8,938
State:
$9,183
(% of AGI for various income ranges: 672.5% for AGIs $50k-75k, 695.0% for AGIs $100k-200k)
Earned income credit: $1,600 (reported on 4.4% of returns)
Here:
$1,600
State:
$2,138
(% of AGI for various income ranges: 80.0% for AGIs below $25k)
Percentage of individuals using paid preparers for their 2020 taxes: 93.3%
Here:
93%
State:
95%
(% for various income ranges: 88.9% for AGIs below $25k, 85.7% for AGIs $25k-50k, 100.0% for AGIs $50k-75k, 100.0% for AGIs $75k-100k, 100.0% for AGIs $100k-200k, 90.9% for AGIs over 200k)
Averages for the 2012 tax year for zip code 11957, filed in 2013:
Average Adjusted Gross Income (AGI) in 2012: $111,037 (Individual Income Tax Returns)
Here:
$111,037
State:
$77,088
Salary/wage: $75,693 (reported on 61.2% of returns)
Here:
$75,693
State:
$60,593
(% of AGI for various income ranges: 56.5% for AGIs below $25k, 48.2% for AGIs $25k-50k, 41.3% for AGIs $50k-75k, 37.8% for AGIs $75k-100k, 44.2% for AGIs $100k-200k, 39.8% for AGIs over 200k)
Taxable interest for individuals: $2,870 (reported on 67.3% of returns)
This zip code:
$2,870
New York:
$3,125
(% of AGI for various income ranges: 2.0% for AGIs below $25k, 2.4% for AGIs $25k-50k, 1.8% for AGIs $50k-75k, 2.5% for AGIs $75k-100k, 3.2% for AGIs $100k-200k, 0.9% for AGIs over 200k)
Ordinary dividends: $10,673 (reported on 53.1% of returns)
Here:
$10,673
State:
$10,299
(% of AGI for various income ranges: 6.0% for AGIs below $25k, 8.3% for AGIs $25k-50k, 5.5% for AGIs $50k-75k, 4.8% for AGIs $75k-100k, 3.3% for AGIs $100k-200k, 5.4% for AGIs over 200k)
Net capital gain/loss in AGI: +$16,714 (reported on 42.9% of returns)
Here:
+$16,714
State:
+$42,474
(% of AGI for various income ranges: 1.2% for AGIs $75k-100k, 4.0% for AGIs $100k-200k, 10.7% for AGIs over 200k)
Profit/loss from business: +$20,844 (reported on 18.4% of returns)
Here:
+$20,844
State:
+$16,168
Taxable individual retirement arrangement distribution: $26,940 (reported on 20.4% of returns)
11957:
$26,940
New York:
$17,621
(% of AGI for various income ranges: 20.3% for AGIs below $25k, 10.0% for AGIs $50k-75k, 16.3% for AGIs $100k-200k)
Total itemized deductions: $35,579 (22% of AGI, reported on 57.1% of returns)
Here:
$35,579
State:
$34,985
Here:
21.7% of AGI
State:
21.3% of AGI
(% of AGI for various income ranges: 27.9% for AGIs below $25k, 26.2% for AGIs $25k-50k, 21.6% for AGIs $50k-75k, 19.5% for AGIs $75k-100k, 19.7% for AGIs $100k-200k, 15.5% for AGIs over 200k)
Charity contributions: $4,175 (reported on 49.0% of returns)
Here:
$4,175
State:
$5,572
(% of AGI for various income ranges: 2.1% for AGIs $25k-50k, 2.4% for AGIs $50k-75k, 2.0% for AGIs $75k-100k, 2.6% for AGIs $100k-200k, 1.5% for AGIs over 200k)
Taxes paid: $18,841 (reported on 55.1% of returns)
11957:
$18,841
State:
$18,656
(% of AGI for various income ranges: 10.3% for AGIs below $25k, 8.5% for AGIs $25k-50k, 8.7% for AGIs $50k-75k, 8.7% for AGIs $75k-100k, 8.6% for AGIs $100k-200k, 9.9% for AGIs over 200k)
Earned income credit: $2,333 (reported on 6.1% of returns)
Here:
$2,333
State:
$2,230
(% of AGI for various income ranges: 4.7% for AGIs below $25k)
Percentage of individuals using paid preparers for their 2012 taxes: 79.6%
Here:
80%
State:
66%
(% for various income ranges: 69.2% for AGIs below $25k, 80.0% for AGIs $25k-50k, 71.4% for AGIs $50k-75k, 80.0% for AGIs $75k-100k, 88.9% for AGIs $100k-200k, 100.0% for AGIs over 200k)
Averages for the 2004 tax year for zip code 11957, filed in 2005:
Average Adjusted Gross Income (AGI) in 2004: $76,430 (Individual Income Tax Returns)
Here:
$76,430
State:
$59,519
Salary/wage: $60,696 (reported on 60.0% of returns)
Here:
$60,696
State:
$50,673
(% of AGI for various income ranges: 108.5% for AGIs below $10k, 36.6% for AGIs $10k-25k, 53.1% for AGIs $25k-50k, 48.9% for AGIs $50k-75k, 51.2% for AGIs $75k-100k, 46.2% for AGIs over 100k)
Taxable interest for individuals: $3,008 (reported on 76.2% of returns)
This zip code:
$3,008
New York:
$2,377
(% of AGI for various income ranges: 24.2% for AGIs below $10k, 6.2% for AGIs $10k-25k, 5.4% for AGIs $25k-50k, 2.7% for AGIs $50k-75k, 2.6% for AGIs $75k-100k, 2.3% for AGIs over 100k)
Taxable dividends: $6,517 (reported on 55.5% of returns)
Here:
$6,517
State:
$5,394
(% of AGI for various income ranges: 22.3% for AGIs below $10k, 7.7% for AGIs $10k-25k, 8.0% for AGIs $25k-50k, 5.8% for AGIs $50k-75k, 2.9% for AGIs $75k-100k, 3.9% for AGIs over 100k)
Net capital gain/loss: +$13,269 (reported on 44.3% of returns)
Here:
+$13,269
State:
+$23,581
(% of AGI for various income ranges: -14.2% for AGIs below $10k, 1.4% for AGIs $10k-25k, 0.6% for AGIs $25k-50k, 1.4% for AGIs $50k-75k, -0.3% for AGIs $75k-100k, 11.9% for AGIs over 100k)
Profit/loss from business: +$22,865 (reported on 18.2% of returns)
Here:
+$22,865
State:
+$13,809
(% of AGI for various income ranges: 15.8% for AGIs $10k-25k, 5.2% for AGIs $25k-50k, 1.0% for AGIs $50k-75k, 6.6% for AGIs over 100k)
IRA payment deduction: $4,095 (reported on 4.3% of returns)
11957:
$4,095
New York:
$3,115
Self-employed pension: $16,909 (reported on 2.3% of returns)
Here:
$16,909
New York:
$19,016
Total itemized deductions: $24,659 (21% of AGI, reported on 50.4% of returns)
Here:
$24,659
State:
$25,864
Here:
21.5% of AGI
State:
21.9% of AGI
(% of AGI for various income ranges: 23.4% for AGIs $10k-25k, 25.9% for AGIs $25k-50k, 17.4% for AGIs $50k-75k, 21.3% for AGIs $75k-100k, 13.4% for AGIs over 100k)
Charity contributions deductions: $2,860 (2% of AGI, reported on 46.9% of returns)
Here:
$2,860
State:
$4,439
Here:
2.5% of AGI
State:
3.6% of AGI
(% of AGI for various income ranges: 1.9% for AGIs $10k-25k, 3.1% for AGIs $25k-50k, 2.0% for AGIs $50k-75k, 2.1% for AGIs $75k-100k, 1.4% for AGIs over 100k)
Total tax: $15,734 (reported on 77.7% of returns)
11957:
$15,734
State:
$11,730
(% of AGI for various income ranges: 3.3% for AGIs below $10k, 5.1% for AGIs $10k-25k, 7.2% for AGIs $25k-50k, 10.1% for AGIs $50k-75k, 11.7% for AGIs $75k-100k, 20.1% for AGIs over 100k)
Earned income credit: $1,828 (reported on 5.9% of returns)
Here:
$1,828
State:
$1,757
Percentage of individuals using paid preparers for their 2004 taxes: 75.4%
Here:
75%
State:
67%
(% for various income ranges: 68.5% for AGIs below $10k, 64.8% for AGIs $10k-25k, 76.7% for AGIs $25k-50k, 74.0% for AGIs $50k-75k, 82.9% for AGIs $75k-100k, 89.7% for AGIs over 100k)
Notable locations in zip code 11957: United States Department of Agriculture (A), Orient Point Lighthouse (B), Plum Island Lighthouse (C), Long Beach Bar Lighthouse (D), Little Gull Island Light (E). Display/hide their locations on the map
Cemeteries: Orient Congregational Cemetery (1), Terry Hill Cemetery (2), Terry Cemetery (3), Latham Cemetery (4), Orient Central Cemetery (5). Display/hide their locations on the map
In group quarters: 14 (-1 institutionalized population)
Size of family households: 266 2-persons, 63 3-persons, 5 4-persons, 16 5-persons
Size of nonfamily households: 226 1-person, 82 2-persons
85.7% of residents of 11957 zip code speak English at home.
1.7% of residents speak Spanish at home (43% very well, 33% well, 10% not well, 14% not at all).
8.3% of residents speak other Indo-European language at home (95% very well, 5% well).
5.3% of residents speak Asian or Pacific Island language at home (9% very well, 91% well).
0.6% of residents speak other language at home (100% very well).
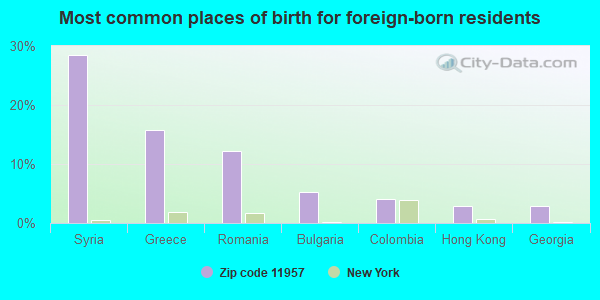
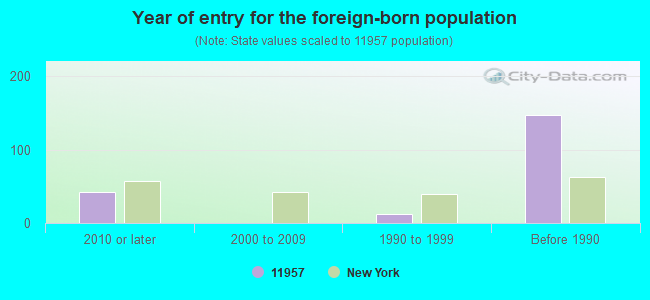
Foreign born population: 175 (14.6%) (96.7% of them are naturalized citizens)
This zip code:
14.6%
Whole state:
22.7%
28%Syria
16%Greece
12%Romania
5%Bulgaria
4%Colombia
3%Hong Kong
3%Georgia
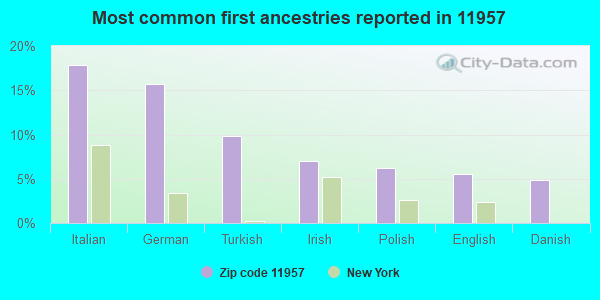
18%Italian
16%German
10%Turkish
7%Irish
6%Polish
6%English
5%Danish
Year of entry for the foreign-born population
422010 or later
02000 to 2009
121990 to 1999
147Before 1990
Facilities with environmental interests located in this zip code:
HANDS FUEL CO INC (MAIN RD in ORIENT, NY)
(Resource Conservation and Recovery Act (tracking hazardous waste))
Housing units lacking complete plumbing facilities: 2.5% Housing units lacking complete kitchen facilities: 1.5%
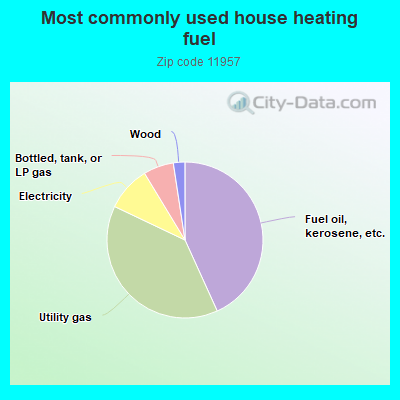
43.4%Fuel oil, kerosene, etc.
39.0%Utility gas
9.3%Electricity
6.3%Bottled, tank, or LP gas
2.4%Wood
Population in 1990: 817.
Place of birth for U.S.-born residents:
This state: 765
Northeast: 49
Midwest: 69
South: 96
West: 12
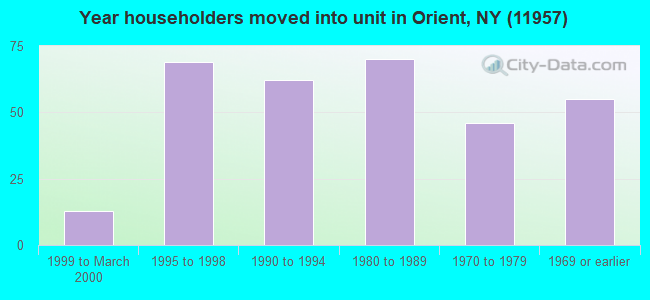
77% of the 11957 zip code residents lived in the same house 5 years ago. Out of people who lived in different houses, 68% lived in this county. Out of people who lived in different counties, 50% lived in New York.
94% of the 11957 zip code residents lived in the same house 1 year ago. Out of people who lived in different houses, 52% moved from this county. Out of people who lived in different houses, 44% moved from different county within same state.
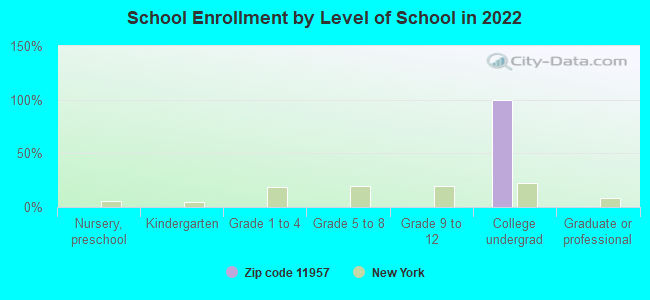
Students in private undergraduate colleges: 25
Here:
37.6%
New York:
39.2%
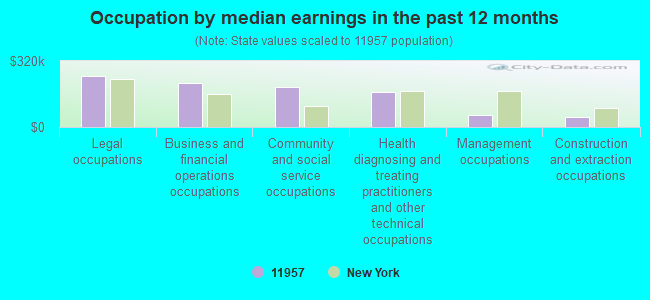
Occupation by median earnings in the past 12 months ($)
247,483Legal occupations
213,637Business and financial operations occupations
196,051Community and social service occupations
168,869Health diagnosing and treating practitioners and other technical occupations
55,823Management occupations
49,240Construction and extraction occupations
Top industries in this zip code by the number of employees in 2005:
Arts, Entertainment, and Recreation: Fitness and Recreational Sports Centers (5-9 employees: 1 establishment, 1-4 employees: 1 establishment)
Other Services (except Public Administration): Religious Organizations (5-9: 1)
Construction: Site Preparation Contractors (5-9: 1)
Arts, Entertainment, and Recreation: Independent Artists, Writers, and Performers (1-4: 3)
Construction: New Single-Family Housing Construction (except Operative Builders) (1-4: 2)
Administrative and Support and Waste Management and Remediation Services: Landscaping Services (1-4: 2)
Administrative and Support and Waste Management and Remediation Services: Travel Agencies (1-4: 1)
Fatal accident statistics in 2014:
Fatal accident count: 1
Vehicles involved in fatal accidents: 1
Fatal accidents caused by drunken drivers: 1
Fatalities: 1
Persons involved in fatal accidents: 2
Pedestrians involved in fatal accidents: 0
Home Mortgage Disclosure Act Aggregated Statistics For Year 2009 (Based on 2 partial tracts)
A) FHA, FSA/RHS & VA Home Purchase Loans
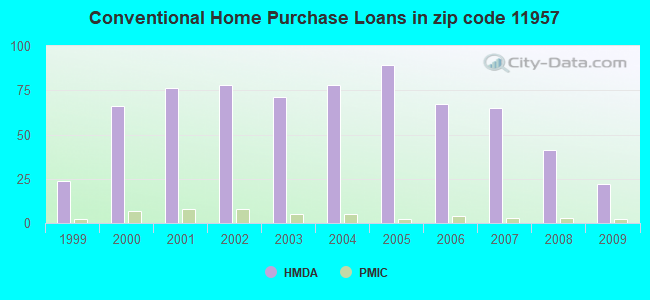
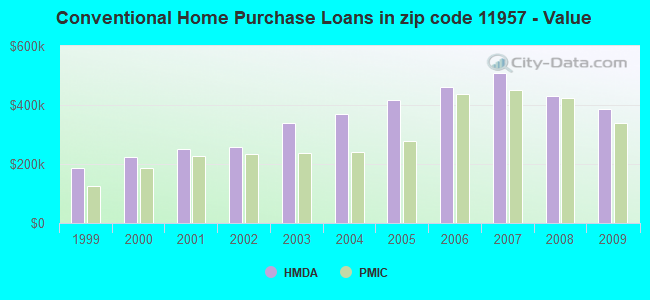
B) Conventional Home Purchase Loans
C) Refinancings
D) Home Improvement Loans
F) Non-occupant Loans on < 5 Family Dwellings (A B C & D)
Number
Average Value
Number
Average Value
Number
Average Value
Number
Average Value
Number
Average Value
LOANS ORIGINATED
3
$356,830
22
$386,405
69
$339,327
10
$246,359
47
$375,506
APPLICATIONS APPROVED, NOT ACCEPTED
0
$0
3
$441,077
7
$422,551
0
$0
4
$589,588
APPLICATIONS DENIED
0
$0
7
$497,967
47
$420,857
2
$67,715
28
$448,983
APPLICATIONS WITHDRAWN
1
$288,970
3
$256,767
31
$411,460
2
$159,150
16
$482,786
FILES CLOSED FOR INCOMPLETENESS
0
$0
2
$858,285
7
$500,677
1
$172,520
3
$1,240,130
Aggregated Statistics For Year 2008 (Based on 2 partial tracts)
A) FHA, FSA/RHS & VA Home Purchase Loans
B) Conventional Home Purchase Loans
C) Refinancings
D) Home Improvement Loans
F) Non-occupant Loans on < 5 Family Dwellings (A B C & D)
Number
Average Value
Number
Average Value
Number
Average Value
Number
Average Value
Number
Average Value
LOANS ORIGINATED
1
$307,090
41
$431,237
43
$311,559
8
$164,218
43
$428,813
APPLICATIONS APPROVED, NOT ACCEPTED
0
$0
5
$577,596
8
$220,394
1
$10,350
4
$615,035
APPLICATIONS DENIED
0
$0
9
$287,341
16
$337,384
7
$182,379
9
$360,759
APPLICATIONS WITHDRAWN
1
$111,280
3
$276,320
7
$371,780
0
$0
3
$491,970
FILES CLOSED FOR INCOMPLETENESS
1
$111,280
3
$424,113
4
$299,752
1
$34,500
3
$448,263
Aggregated Statistics For Year 2007 (Based on 2 partial tracts)
B) Conventional Home Purchase Loans
C) Refinancings
D) Home Improvement Loans
E) Loans on Dwellings For 5+ Families
F) Non-occupant Loans on < 5 Family Dwellings (A B C & D)
Number
Average Value
Number
Average Value
Number
Average Value
Number
Average Value
Number
Average Value
LOANS ORIGINATED
65
$508,310
69
$437,276
18
$115,876
0
$0
50
$655,490
APPLICATIONS APPROVED, NOT ACCEPTED
8
$760,382
10
$343,315
3
$225,140
1
$345,040
6
$657,013
APPLICATIONS DENIED
15
$473,740
33
$514,083
5
$117,314
0
$0
11
$590,254
APPLICATIONS WITHDRAWN
6
$558,533
21
$449,291
3
$279,483
0
$0
9
$506,538
FILES CLOSED FOR INCOMPLETENESS
3
$910,330
4
$346,765
0
$0
0
$0
2
$612,875
Aggregated Statistics For Year 2006 (Based on 2 partial tracts)
B) Conventional Home Purchase Loans
C) Refinancings
D) Home Improvement Loans
E) Loans on Dwellings For 5+ Families
F) Non-occupant Loans on < 5 Family Dwellings (A B C & D)
Number
Average Value
Number
Average Value
Number
Average Value
Number
Average Value
Number
Average Value
LOANS ORIGINATED
67
$459,894
85
$409,461
16
$166,212
1
$1,035,120
55
$563,968
APPLICATIONS APPROVED, NOT ACCEPTED
9
$371,301
13
$632,020
4
$188,910
0
$0
6
$1,141,077
APPLICATIONS DENIED
16
$363,909
33
$355,078
7
$71,473
0
$0
9
$501,746
APPLICATIONS WITHDRAWN
3
$422,100
28
$325,601
2
$85,395
0
$0
4
$677,358
FILES CLOSED FOR INCOMPLETENESS
0
$0
8
$307,732
1
$25,880
0
$0
1
$211,340
Aggregated Statistics For Year 2005 (Based on 2 partial tracts)
B) Conventional Home Purchase Loans
C) Refinancings
D) Home Improvement Loans
F) Non-occupant Loans on < 5 Family Dwellings (A B C & D)
Number
Average Value
Number
Average Value
Number
Average Value
Number
Average Value
LOANS ORIGINATED
89
$416,471
90
$316,066
22
$220,551
73
$461,999
APPLICATIONS APPROVED, NOT ACCEPTED
11
$305,204
15
$308,868
6
$159,582
6
$434,607
APPLICATIONS DENIED
16
$293,068
38
$383,085
9
$98,816
9
$477,497
APPLICATIONS WITHDRAWN
13
$342,518
25
$343,729
5
$190,118
10
$380,320
FILES CLOSED FOR INCOMPLETENESS
6
$508,647
16
$297,489
1
$43,130
1
$517,560
Aggregated Statistics For Year 2004 (Based on 2 partial tracts)
A) FHA, FSA/RHS & VA Home Purchase Loans
B) Conventional Home Purchase Loans
C) Refinancings
D) Home Improvement Loans
F) Non-occupant Loans on < 5 Family Dwellings (A B C & D)
Number
Average Value
Number
Average Value
Number
Average Value
Number
Average Value
Number
Average Value
LOANS ORIGINATED
1
$244,120
78
$369,292
110
$351,486
15
$139,281
71
$454,372
APPLICATIONS APPROVED, NOT ACCEPTED
1
$240,670
5
$297,770
27
$274,626
1
$201,850
7
$455,699
APPLICATIONS DENIED
0
$0
13
$369,591
48
$324,032
9
$165,332
15
$470,059
APPLICATIONS WITHDRAWN
0
$0
6
$251,017
28
$296,272
3
$84,823
7
$372,520
FILES CLOSED FOR INCOMPLETENESS
0
$0
3
$228,590
21
$310,002
1
$172,520
3
$483,630
Aggregated Statistics For Year 2003 (Based on 2 partial tracts)
A) FHA, FSA/RHS & VA Home Purchase Loans
B) Conventional Home Purchase Loans
C) Refinancings
D) Home Improvement Loans
F) Non-occupant Loans on < 5 Family Dwellings (A B C & D)
Number
Average Value
Number
Average Value
Number
Average Value
Number
Average Value
Number
Average Value
LOANS ORIGINATED
1
$101,790
71
$339,026
216
$269,483
11
$95,356
106
$330,351
APPLICATIONS APPROVED, NOT ACCEPTED
1
$131,980
6
$576,505
41
$218,027
3
$92,010
9
$495,228
APPLICATIONS DENIED
0
$0
5
$272,064
39
$234,384
4
$90,142
4
$210,260
APPLICATIONS WITHDRAWN
0
$0
8
$310,429
40
$251,728
2
$40,975
8
$148,906
FILES CLOSED FOR INCOMPLETENESS
0
$0
3
$133,127
13
$293,218
0
$0
4
$436,475
Aggregated Statistics For Year 2002 (Based on 2 partial tracts)
A) FHA, FSA/RHS & VA Home Purchase Loans
B) Conventional Home Purchase Loans
C) Refinancings
D) Home Improvement Loans
E) Loans on Dwellings For 5+ Families
F) Non-occupant Loans on < 5 Family Dwellings (A B C & D)
Number
Average Value
Number
Average Value
Number
Average Value
Number
Average Value
Number
Average Value
Number
Average Value
LOANS ORIGINATED
1
$161,310
78
$257,530
135
$242,237
16
$74,777
1
$184,600
79
$302,751
APPLICATIONS APPROVED, NOT ACCEPTED
0
$0
9
$257,726
19
$284,340
3
$48,880
0
$0
8
$404,236
APPLICATIONS DENIED
0
$0
9
$249,003
22
$205,064
10
$109,464
0
$0
9
$304,498
APPLICATIONS WITHDRAWN
0
$0
11
$329,592
22
$228,942
3
$97,187
0
$0
4
$300,832
FILES CLOSED FOR INCOMPLETENESS
0
$0
3
$370,917
9
$256,576
0
$0
0
$0
3
$296,160
Aggregated Statistics For Year 2001 (Based on 2 partial tracts)
B) Conventional Home Purchase Loans
C) Refinancings
D) Home Improvement Loans
F) Non-occupant Loans on < 5 Family Dwellings (A B C & D)
Number
Average Value
Number
Average Value
Number
Average Value
Number
Average Value
LOANS ORIGINATED
76
$249,518
89
$202,178
18
$62,347
52
$296,535
APPLICATIONS APPROVED, NOT ACCEPTED
3
$397,370
11
$198,555
5
$65,212
5
$229,796
APPLICATIONS DENIED
6
$308,810
22
$184,557
3
$51,180
8
$189,988
APPLICATIONS WITHDRAWN
8
$248,536
15
$209,439
3
$277,470
8
$322,074
FILES CLOSED FOR INCOMPLETENESS
6
$271,575
8
$236,676
1
$34,500
2
$224,705
Aggregated Statistics For Year 2000 (Based on 2 partial tracts)
A) FHA, FSA/RHS & VA Home Purchase Loans
B) Conventional Home Purchase Loans
C) Refinancings
D) Home Improvement Loans
F) Non-occupant Loans on < 5 Family Dwellings (A B C & D)
Number
Average Value
Number
Average Value
Number
Average Value
Number
Average Value
Number
Average Value
LOANS ORIGINATED
2
$117,315
66
$222,512
33
$168,808
9
$39,583
30
$259,326
APPLICATIONS APPROVED, NOT ACCEPTED
1
$76,770
5
$188,736
9
$228,398
1
$25,880
6
$202,712
APPLICATIONS DENIED
1
$119,900
9
$380,886
12
$272,582
5
$68,836
6
$398,808
APPLICATIONS WITHDRAWN
0
$0
6
$223,988
9
$68,720
3
$18,690
3
$196,097
FILES CLOSED FOR INCOMPLETENESS
0
$0
3
$299,323
7
$192,237
0
$0
1
$107,830
Aggregated Statistics For Year 1999 (Based on 1 partial tract)
B) Conventional Home Purchase Loans
C) Refinancings
D) Home Improvement Loans
F) Non-occupant Loans on < 5 Family Dwellings (A B C & D)


 Nearest zip codes: 06376, 06357, 06320, 11965, 06385, 11939.