Averages for the 2020 tax year for zip code 12046, filed in 2021:
Average Adjusted Gross Income (AGI) in 2020: $73,911 (Individual Income Tax Returns)
Here:
$73,911
State:
$90,930
Salary/wage: $62,514 (reported on 80.0% of returns)
Here:
$62,514
State:
$72,104
(% of AGI for various income ranges: 1148.0% for AGIs below $25k, 4074.3% for AGIs $25k-50k, 7053.3% for AGIs $50k-75k, 9166.7% for AGIs $75k-100k, 18424.0% for AGIs $100k-200k)
Taxable interest for individuals: $388 (reported on 45.7% of returns)
This zip code:
$388
New York:
$3,075
(% of AGI for various income ranges: 2.0% for AGIs below $25k, 8.6% for AGIs $25k-50k, 56.7% for AGIs $50k-75k, 36.7% for AGIs $75k-100k, 54.0% for AGIs $100k-200k)
Ordinary dividends: $2,786 (reported on 20.0% of returns)
Here:
$2,786
State:
$11,095
(% of AGI for various income ranges: 37.1% for AGIs $25k-50k, 338.0% for AGIs $100k-200k)
Net capital gain/loss in AGI: +$12,383 (reported on 17.1% of returns)
Here:
+$12,383
State:
+$44,925
(% of AGI for various income ranges: 32.9% for AGIs $25k-50k, 1440.0% for AGIs $100k-200k)
Profit/loss from business: +$10,233 (reported on 8.6% of returns)
Here:
+$10,233
State:
+$14,940
(% of AGI for various income ranges: 1023.3% for AGIs $50k-75k)
Taxable individual retirement arrangement distribution: $14,633 (reported on 8.6% of returns)
12046:
$14,633
New York:
$19,609
(% of AGI for various income ranges: 627.1% for AGIs $25k-50k)
Total itemized deductions: $25,500 (reported on 5.7% of returns)
Here:
$25,500
State:
$39,326
(% of AGI for various income ranges: 1700.0% for AGIs $50k-75k)
Taxes paid: $9,600 (reported on 5.7% of returns)
12046:
$9,600
State:
$9,183
(% of AGI for various income ranges: 640.0% for AGIs $50k-75k)
Earned income credit: $2,075 (reported on 11.4% of returns)
Here:
$2,075
State:
$2,138
(% of AGI for various income ranges: 166.0% for AGIs below $25k)
Percentage of individuals using paid preparers for their 2020 taxes: 97.1%
Here:
97%
State:
95%
(% for various income ranges: 100.0% for AGIs below $25k, 90.0% for AGIs $25k-50k, 100.0% for AGIs $50k-75k, 100.0% for AGIs $75k-100k, 100.0% for AGIs $100k-200k)
Averages for the 2012 tax year for zip code 12046, filed in 2013:
Average Adjusted Gross Income (AGI) in 2012: $56,964 (Individual Income Tax Returns)
Here:
$56,964
State:
$77,088
Salary/wage: $56,271 (reported on 77.8% of returns)
Here:
$56,271
State:
$60,593
(% of AGI for various income ranges: 74.6% for AGIs below $25k, 72.2% for AGIs $25k-50k, 81.7% for AGIs $50k-75k, 76.7% for AGIs $75k-100k, 77.0% for AGIs $100k-200k)
Taxable interest for individuals: $393 (reported on 41.7% of returns)
This zip code:
$393
New York:
$3,125
(% of AGI for various income ranges: 0.6% for AGIs below $25k, 0.2% for AGIs $25k-50k, 0.6% for AGIs $50k-75k, 0.1% for AGIs $75k-100k, 0.2% for AGIs $100k-200k)
Ordinary dividends: $2,143 (reported on 19.4% of returns)
Here:
$2,143
State:
$10,299
(% of AGI for various income ranges: 1.0% for AGIs below $25k, 0.2% for AGIs $50k-75k, 1.5% for AGIs $100k-200k)
Profit/loss from business: +$3,925 (reported on 11.1% of returns)
Here:
+$3,925
State:
+$16,168
Taxable individual retirement arrangement distribution: $8,033 (reported on 8.3% of returns)
12046:
$8,033
New York:
$17,621
Total itemized deductions: $20,277 (22% of AGI, reported on 36.1% of returns)
Here:
$20,277
State:
$34,985
Here:
21.7% of AGI
State:
21.3% of AGI
(% of AGI for various income ranges: 31.1% for AGIs below $25k, 13.7% for AGIs $50k-75k, 17.0% for AGIs $75k-100k, 13.5% for AGIs $100k-200k)
Charity contributions: $1,344 (reported on 25.0% of returns)
Here:
$1,344
State:
$5,572
(% of AGI for various income ranges: 1.2% for AGIs $50k-75k, 0.7% for AGIs $75k-100k, 0.6% for AGIs $100k-200k)
Taxes paid: $10,131 (reported on 36.1% of returns)
12046:
$10,131
State:
$18,656
(% of AGI for various income ranges: 13.2% for AGIs below $25k, 5.3% for AGIs $50k-75k, 7.6% for AGIs $75k-100k, 8.1% for AGIs $100k-200k)
Earned income credit: $1,633 (reported on 8.3% of returns)
Here:
$1,633
State:
$2,230
(% of AGI for various income ranges: 4.0% for AGIs below $25k)
Percentage of individuals using paid preparers for their 2012 taxes: 58.3%
Here:
58%
State:
66%
(% for various income ranges: 45.5% for AGIs below $25k, 66.7% for AGIs $25k-50k, 50.0% for AGIs $50k-75k, 75.0% for AGIs $75k-100k, 66.7% for AGIs $100k-200k)
Averages for the 2004 tax year for zip code 12046, filed in 2005:
Average Adjusted Gross Income (AGI) in 2004: $46,051 (Individual Income Tax Returns)
Here:
$46,051
State:
$59,519
Salary/wage: $45,112 (reported on 85.6% of returns)
Here:
$45,112
State:
$50,673
(% of AGI for various income ranges: 97.9% for AGIs below $10k, 69.7% for AGIs $10k-25k, 84.1% for AGIs $25k-50k, 85.3% for AGIs $50k-75k, 79.4% for AGIs $75k-100k, 88.7% for AGIs over 100k)
Taxable interest for individuals: $678 (reported on 49.0% of returns)
This zip code:
$678
New York:
$2,377
(% of AGI for various income ranges: 6.6% for AGIs below $10k, 0.4% for AGIs $10k-25k, 0.8% for AGIs $25k-50k, 0.5% for AGIs $50k-75k, 0.5% for AGIs $75k-100k, 0.8% for AGIs over 100k)
Taxable dividends: $642 (reported on 22.8% of returns)
Here:
$642
State:
$5,394
(% of AGI for various income ranges: 0.3% for AGIs $10k-25k, 0.1% for AGIs $25k-50k, 0.2% for AGIs $50k-75k, 0.2% for AGIs $75k-100k, 0.7% for AGIs over 100k)
Net capital gain/loss: +$4,453 (reported on 14.9% of returns)
Here:
+$4,453
State:
+$23,581
(% of AGI for various income ranges: 0.7% for AGIs $10k-25k, 3.0% for AGIs $50k-75k, 2.5% for AGIs over 100k)
Profit/loss from business: +$903 (reported on 8.7% of returns)
Here:
+$903
State:
+$13,809
Total itemized deductions: $15,839 (19% of AGI, reported on 31.5% of returns)
Here:
$15,839
State:
$25,864
Here:
19.3% of AGI
State:
21.9% of AGI
(% of AGI for various income ranges: 9.2% for AGIs $25k-50k, 10.8% for AGIs $50k-75k, 14.1% for AGIs $75k-100k, 13.0% for AGIs over 100k)
Charity contributions deductions: $1,396 (2% of AGI, reported on 27.0% of returns)
Here:
$1,396
State:
$4,439
Here:
1.7% of AGI
State:
3.6% of AGI
(% of AGI for various income ranges: 0.7% for AGIs $25k-50k, 0.7% for AGIs $50k-75k, 0.8% for AGIs $75k-100k, 1.2% for AGIs over 100k)
Total tax: $6,000 (reported on 80.0% of returns)
12046:
$6,000
State:
$11,730
(% of AGI for various income ranges: 3.7% for AGIs below $10k, 4.2% for AGIs $10k-25k, 7.9% for AGIs $25k-50k, 8.7% for AGIs $50k-75k, 9.6% for AGIs $75k-100k, 16.4% for AGIs over 100k)
Earned income credit: $1,533 (reported on 8.5% of returns)
Here:
$1,533
State:
$1,757
Percentage of individuals using paid preparers for their 2004 taxes: 57.5%
Here:
57%
State:
67%
(% for various income ranges: 40.6% for AGIs below $10k, 59.7% for AGIs $10k-25k, 62.4% for AGIs $25k-50k, 55.6% for AGIs $50k-75k, 59.0% for AGIs $75k-100k, 75.9% for AGIs over 100k)
Notable locations in zip code 12046: Keefers Corners (A), Rocking R Farm (B), Coeymans Hollow Volunteer Fire Department (C). Display/hide their locations on the map
Size of family households: 132 2-persons, 13 3-persons, 26 4-persons
Size of nonfamily households: 99 1-person
18 married couples with children.
65 single-parent households (65 men).
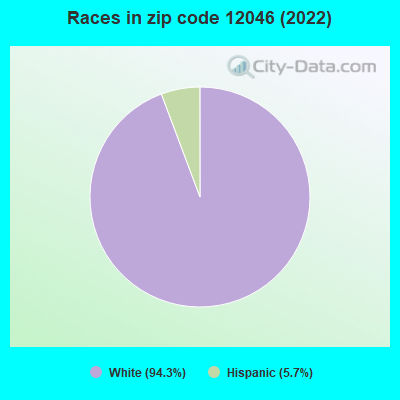
99.0% of residents of 12046 zip code speak English at home.
1.9% of residents speak Spanish at home (100% not well).
Foreign born population: 0 (0.0%)
:
0.0%
Whole state:
22.7%
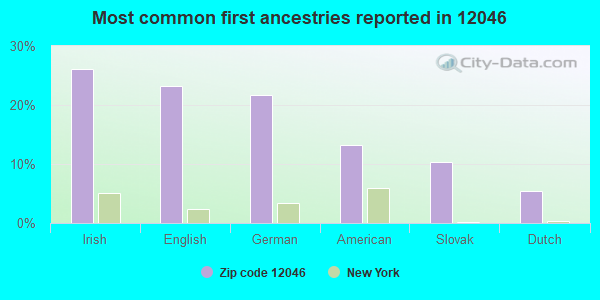
26%Irish
23%English
22%German
13%American
10%Slovak
5%Dutch
75.6%Fuel oil, kerosene, etc.
12.9%Bottled, tank, or LP gas
12.2%Wood
Population in 1990: 979.
Place of birth for U.S.-born residents:
This state: 469
Midwest: 24
South: 14
74% of the 12046 zip code residents lived in the same house 5 years ago. Out of people who lived in different houses, 52% lived in this county. Out of people who lived in different counties, 50% lived in New York.
100% of the 12046 zip code residents lived in the same house 1 year ago.
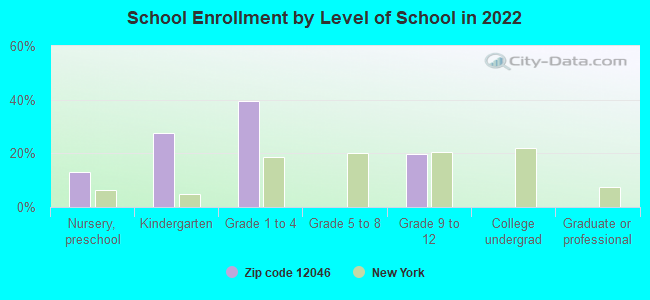
Private vs. public school enrollment:
Students in private schools in grades 1 to 8 (elementary and middle school):
Here:
0.0%
New York:
15.6%
Students in private schools in grades 9 to 12 (high school):
Here:
0.0%
New York:
15.0%
Top industries in this zip code by the number of employees in 2005:
Construction: Commercial and Institutional Building Construction (5-9 employees: 1 establishment)
Construction: Other Building Equipment Contractors (5-9: 1)
Other Services (except Public Administration): Appliance Repair and Maintenance (1-4: 1)
Construction: New Single-Family Housing Construction (except Operative Builders) (1-4: 1)
Information: Newspaper Publishers (1-4: 1)
Administrative and Support and Waste Management and Remediation Services: Employment Placement Agencies (1-4: 1)
Construction: Masonry Contractors (1-4: 1)
Construction: Plumbing, Heating, and Air-Conditioning Contractors (1-4: 1)
Construction: Residential Remodelers (1-4: 1)
Home Mortgage Disclosure Act Aggregated Statistics For Year 2009 (Based on 2 partial tracts)
A) FHA, FSA/RHS & VA Home Purchase Loans
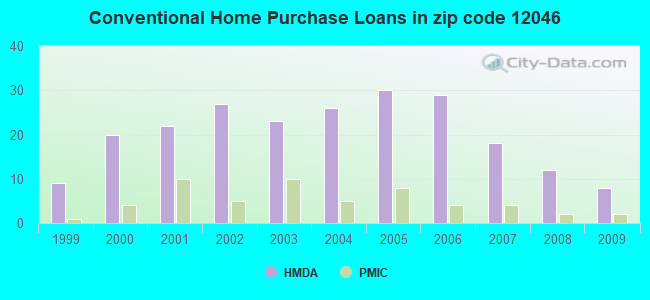
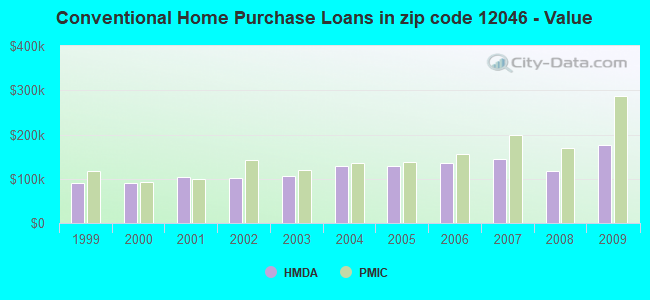
B) Conventional Home Purchase Loans
C) Refinancings
D) Home Improvement Loans
F) Non-occupant Loans on < 5 Family Dwellings (A B C & D)
G) Loans On Manufactured Home Dwelling (A B C & D)
Number
Average Value
Number
Average Value
Number
Average Value
Number
Average Value
Number
Average Value
Number
Average Value
LOANS ORIGINATED
8
$147,939
8
$177,240
36
$160,727
10
$32,420
2
$242,545
1
$48,210
APPLICATIONS APPROVED, NOT ACCEPTED
2
$138,600
2
$101,235
6
$161,798
1
$3,620
1
$56,640
1
$43,390
APPLICATIONS DENIED
2
$158,185
4
$137,392
17
$160,327
3
$29,727
2
$122,630
1
$10,850
APPLICATIONS WITHDRAWN
1
$236,220
0
$0
9
$148,909
0
$0
0
$0
0
$0
FILES CLOSED FOR INCOMPLETENESS
0
$0
0
$0
2
$159,990
0
$0
0
$0
0
$0
Aggregated Statistics For Year 2008 (Based on 2 partial tracts)
A) FHA, FSA/RHS & VA Home Purchase Loans
B) Conventional Home Purchase Loans
C) Refinancings
D) Home Improvement Loans
F) Non-occupant Loans on < 5 Family Dwellings (A B C & D)
G) Loans On Manufactured Home Dwelling (A B C & D)
Number
Average Value
Number
Average Value
Number
Average Value
Number
Average Value
Number
Average Value
Number
Average Value
LOANS ORIGINATED
5
$176,200
12
$117,206
27
$157,680
14
$51,436
2
$119,015
4
$33,745
APPLICATIONS APPROVED, NOT ACCEPTED
1
$324,200
2
$116,300
5
$75,566
1
$90,990
0
$0
1
$43,390
APPLICATIONS DENIED
1
$95,210
4
$109,975
19
$145,227
14
$39,083
1
$225,980
2
$22,600
APPLICATIONS WITHDRAWN
2
$166,620
2
$138,600
16
$160,480
3
$140,807
0
$0
1
$150,650
FILES CLOSED FOR INCOMPLETENESS
0
$0
0
$0
4
$128,655
0
$0
0
$0
0
$0
Aggregated Statistics For Year 2007 (Based on 2 partial tracts)
A) FHA, FSA/RHS & VA Home Purchase Loans
B) Conventional Home Purchase Loans
C) Refinancings
D) Home Improvement Loans
E) Loans on Dwellings For 5+ Families
F) Non-occupant Loans on < 5 Family Dwellings (A B C & D)
G) Loans On Manufactured Home Dwelling (A B C & D)
Number
Average Value
Number
Average Value
Number
Average Value
Number
Average Value
Number
Average Value
Number
Average Value
Number
Average Value
LOANS ORIGINATED
7
$155,816
18
$144,992
30
$127,751
17
$76,601
0
$0
2
$110,275
3
$53,430
APPLICATIONS APPROVED, NOT ACCEPTED
1
$121,120
6
$115,197
5
$87,256
4
$69,148
0
$0
0
$0
2
$35,555
APPLICATIONS DENIED
0
$0
13
$142,121
34
$152,493
18
$46,300
1
$177,160
2
$109,675
1
$54,840
APPLICATIONS WITHDRAWN
2
$160,895
4
$70,505
27
$137,348
2
$114,495
1
$122,930
2
$142,815
1
$25,910
FILES CLOSED FOR INCOMPLETENESS
0
$0
4
$137,392
6
$194,640
0
$0
1
$255,500
0
$0
0
$0
Aggregated Statistics For Year 2006 (Based on 2 partial tracts)
A) FHA, FSA/RHS & VA Home Purchase Loans
B) Conventional Home Purchase Loans
C) Refinancings
D) Home Improvement Loans
E) Loans on Dwellings For 5+ Families
F) Non-occupant Loans on < 5 Family Dwellings (A B C & D)
G) Loans On Manufactured Home Dwelling (A B C & D)
Number
Average Value
Number
Average Value
Number
Average Value
Number
Average Value
Number
Average Value
Number
Average Value
Number
Average Value
LOANS ORIGINATED
3
$140,003
29
$134,525
34
$127,875
20
$37,934
1
$15,070
4
$84,665
2
$39,770
APPLICATIONS APPROVED, NOT ACCEPTED
1
$107,260
3
$117,107
10
$131,307
6
$78,438
0
$0
0
$0
1
$29,530
APPLICATIONS DENIED
1
$122,330
7
$109,760
31
$161,108
14
$40,977
0
$0
1
$63,270
1
$47,610
APPLICATIONS WITHDRAWN
1
$96,420
3
$144,020
17
$187,444
1
$23,500
0
$0
0
$0
1
$43,390
FILES CLOSED FOR INCOMPLETENESS
0
$0
0
$0
7
$174,496
0
$0
0
$0
0
$0
0
$0
Aggregated Statistics For Year 2005 (Based on 2 partial tracts)
A) FHA, FSA/RHS & VA Home Purchase Loans
B) Conventional Home Purchase Loans
C) Refinancings
D) Home Improvement Loans
F) Non-occupant Loans on < 5 Family Dwellings (A B C & D)
G) Loans On Manufactured Home Dwelling (A B C & D)
Number
Average Value
Number
Average Value
Number
Average Value
Number
Average Value
Number
Average Value
Number
Average Value
LOANS ORIGINATED
2
$150,950
30
$129,338
44
$127,683
21
$47,060
4
$102,742
5
$91,596
APPLICATIONS APPROVED, NOT ACCEPTED
0
$0
1
$131,970
9
$101,772
2
$66,585
1
$12,050
0
$0
APPLICATIONS DENIED
1
$86,770
5
$43,266
34
$115,770
12
$19,132
1
$269,960
5
$36,758
APPLICATIONS WITHDRAWN
0
$0
4
$91,295
34
$107,032
2
$235,015
1
$54,230
0
$0
FILES CLOSED FOR INCOMPLETENESS
0
$0
1
$127,150
8
$158,108
0
$0
0
$0
0
$0
Aggregated Statistics For Year 2004 (Based on 2 partial tracts)
A) FHA, FSA/RHS & VA Home Purchase Loans
B) Conventional Home Purchase Loans
C) Refinancings
D) Home Improvement Loans
E) Loans on Dwellings For 5+ Families
F) Non-occupant Loans on < 5 Family Dwellings (A B C & D)
G) Loans On Manufactured Home Dwelling (A B C & D)
Number
Average Value
Number
Average Value
Number
Average Value
Number
Average Value
Number
Average Value
Number
Average Value
Number
Average Value
LOANS ORIGINATED
3
$135,787
26
$128,771
41
$99,018
14
$33,229
0
$0
3
$72,513
2
$49,715
APPLICATIONS APPROVED, NOT ACCEPTED
0
$0
2
$127,150
10
$118,833
2
$55,140
1
$54,840
0
$0
1
$43,390
APPLICATIONS DENIED
1
$24,100
5
$89,546
32
$105,361
13
$36,342
1
$1,810
1
$36,160
2
$26,515
APPLICATIONS WITHDRAWN
0
$0
2
$160,595
31
$109,732
4
$59,205
0
$0
0
$0
0
$0
FILES CLOSED FOR INCOMPLETENESS
0
$0
1
$109,670
4
$139,652
1
$48,210
0
$0
0
$0
1
$10,240
Aggregated Statistics For Year 2003 (Based on 2 partial tracts)
A) FHA, FSA/RHS & VA Home Purchase Loans
B) Conventional Home Purchase Loans
C) Refinancings
D) Home Improvement Loans
F) Non-occupant Loans on < 5 Family Dwellings (A B C & D)
Number
Average Value
Number
Average Value
Number
Average Value
Number
Average Value
Number
Average Value
LOANS ORIGINATED
2
$121,725
23
$106,948
90
$102,121
5
$31,576
2
$84,665
APPLICATIONS APPROVED, NOT ACCEPTED
0
$0
4
$60,410
22
$101,127
1
$21,090
1
$43,390
APPLICATIONS DENIED
1
$82,560
4
$62,820
39
$89,107
4
$28,020
1
$86,170
APPLICATIONS WITHDRAWN
0
$0
1
$48,210
27
$100,411
1
$16,270
0
$0
FILES CLOSED FOR INCOMPLETENESS
0
$0
1
$39,170
4
$117,055
1
$21,090
0
$0
Aggregated Statistics For Year 2002 (Based on 2 partial tracts)
A) FHA, FSA/RHS & VA Home Purchase Loans
B) Conventional Home Purchase Loans
C) Refinancings
D) Home Improvement Loans
F) Non-occupant Loans on < 5 Family Dwellings (A B C & D)
Number
Average Value
Number
Average Value
Number
Average Value
Number
Average Value
Number
Average Value
LOANS ORIGINATED
2
$73,515
27
$102,420
50
$87,895
10
$18,922
4
$71,710
APPLICATIONS APPROVED, NOT ACCEPTED
1
$72,310
3
$85,970
10
$81,291
2
$12,050
0
$0
APPLICATIONS DENIED
2
$66,285
7
$111,050
22
$81,899
4
$7,382
1
$95,210
APPLICATIONS WITHDRAWN
1
$58,450
4
$144,472
22
$90,116
1
$34,950
0
$0
FILES CLOSED FOR INCOMPLETENESS
0
$0
1
$48,810
2
$125,945
0
$0
0
$0
Aggregated Statistics For Year 2001 (Based on 2 partial tracts)
A) FHA, FSA/RHS & VA Home Purchase Loans
B) Conventional Home Purchase Loans
C) Refinancings
D) Home Improvement Loans
F) Non-occupant Loans on < 5 Family Dwellings (A B C & D)
Number
Average Value
Number
Average Value
Number
Average Value
Number
Average Value
Number
Average Value
LOANS ORIGINATED
8
$85,419
22
$103,730
39
$87,995
8
$22,598
2
$66,890
APPLICATIONS APPROVED, NOT ACCEPTED
1
$34,350
4
$87,980
8
$90,918
1
$25,910
1
$50,620
APPLICATIONS DENIED
1
$34,350
10
$54,174
22
$92,225
4
$13,558
1
$57,250
APPLICATIONS WITHDRAWN
0
$0
3
$66,287
13
$104,992
1
$3,620
0
$0
FILES CLOSED FOR INCOMPLETENESS
1
$34,950
1
$66,290
0
$0
0
$0
0
$0
Aggregated Statistics For Year 2000 (Based on 2 partial tracts)
A) FHA, FSA/RHS & VA Home Purchase Loans
B) Conventional Home Purchase Loans
C) Refinancings
D) Home Improvement Loans
E) Loans on Dwellings For 5+ Families
F) Non-occupant Loans on < 5 Family Dwellings (A B C & D)
Number
Average Value
Number
Average Value
Number
Average Value
Number
Average Value
Number
Average Value
Number
Average Value
LOANS ORIGINATED
5
$80,628
20
$89,667
21
$70,906
14
$26,299
1
$43,390
4
$41,430
APPLICATIONS APPROVED, NOT ACCEPTED
1
$83,760
8
$64,930
7
$52,254
3
$21,893
0
$0
1
$27,720
APPLICATIONS DENIED
1
$84,360
13
$51,592
21
$69,787
7
$20,833
0
$0
0
$0
APPLICATIONS WITHDRAWN
1
$37,960
2
$126,245
7
$86,947
0
$0
0
$0
0
$0
FILES CLOSED FOR INCOMPLETENESS
0
$0
0
$0
3
$112,887
1
$21,090
0
$0
0
$0
Aggregated Statistics For Year 1999 (Based on 1 partial tract)
A) FHA, FSA/RHS & VA Home Purchase Loans
B) Conventional Home Purchase Loans
C) Refinancings
D) Home Improvement Loans
F) Non-occupant Loans on < 5 Family Dwellings (A B C & D)

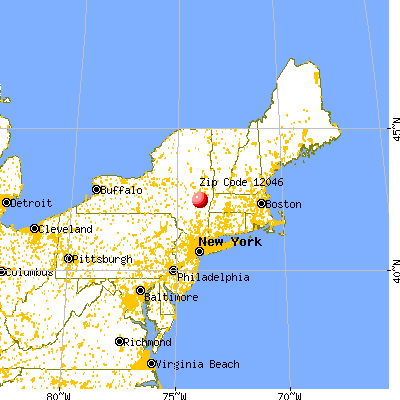


 Nearest zip codes: 12067, 12007, 12143, 12161, 12041, 12087.