Estimated zip code population in 2022: 1,965 Zip code population in 2010: 1,835 Zip code population in 2000: 1,713
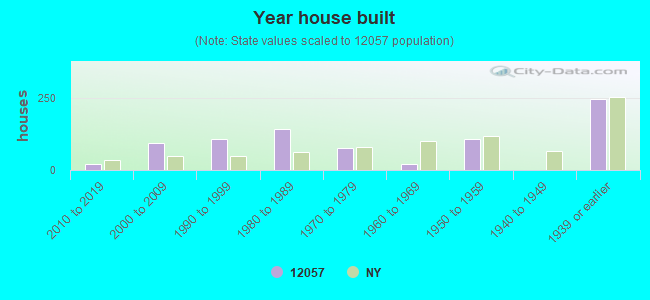
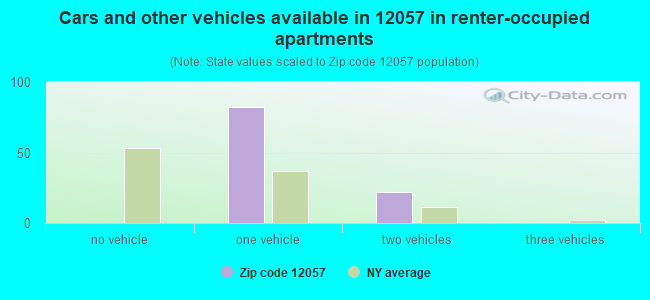
Houses and condos: 822 Renter-occupied apartments: 102
% of renters here:
14%
State:
46%
March 2022 cost of living index in zip code 12057: 95.8 (near average, U.S. average is 100)
Land area: 35.2 sq. mi. Water area: 0.0 sq. mi.
Population density: 56 people per square mile
(very low).
OSM Map
General Map
Google Map
MSN Map
OSM Map
General Map
Google Map
MSN Map
OSM Map
General Map
Google Map
MSN Map
OSM Map
General Map
Google Map
MSN Map
Please wait while loading the map...
Real estate property taxes paid for housing units in 2022:
This zip code:
1.7% ($3,847)
New York:
1.5% ($6,180)
Median real estate property taxes paid for housing units with mortgages in 2022: $5,009 (2.2%) Median real estate property taxes paid for housing units with no mortgage in 2022: $3,475 (1.6%)
Business Search- 14 Million verified businesses
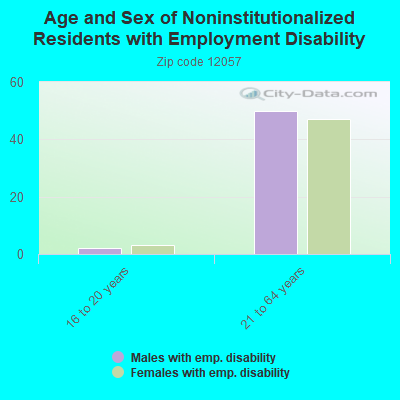
Males: 1,145
(58.3%)
Females: 819
(41.7%)
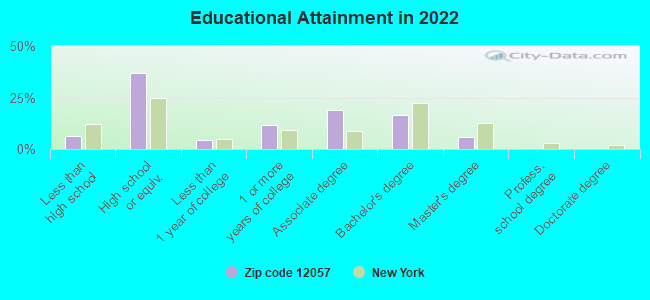
For population 25 years and over in 12057:
High school or higher: 92.7%
Bachelor's degree or higher: 21.8%
Graduate or professional degree: 5.7%
Unemployed: 2.6%
Mean travel time to work (commute): 41.3 minutes
For population 15 years and over in 12057:
Never married: 37.4%
Now married: 50.4%
Separated: 0.4%
Widowed: 2.8%
Divorced: 9.0%
Zip code 12057 compared to state average:
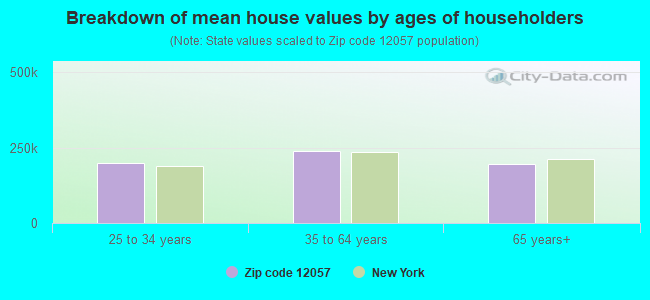
Median house value below state average.
Unemployed percentage below state average.
Black race population percentage significantly below state average.
Hispanic race population percentage significantly below state average.
Foreign-born population percentage significantly below state average.
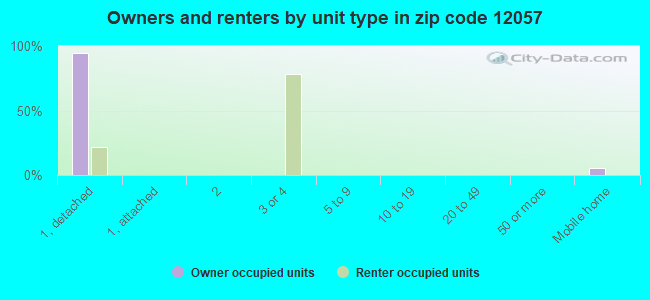
Renting percentage significantly below state average.
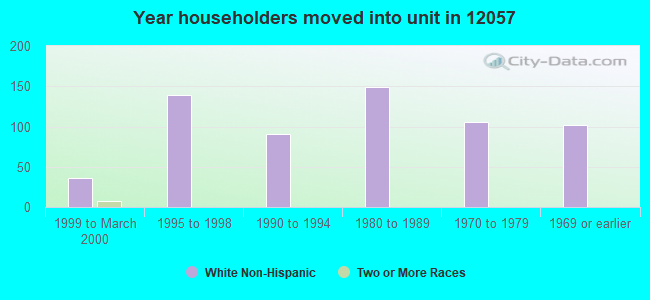
Length of stay since moving in significantly above state average.
Number of rooms per house above state average.
Number of college students significantly below state average.
Percentage of population with a bachelor's degree or higher below state average.
Averages for the 2020 tax year for zip code 12057, filed in 2021:
Average Adjusted Gross Income (AGI) in 2020: $56,604 (Individual Income Tax Returns)
Here:
$56,604
State:
$90,930
Salary/wage: $51,724 (reported on 84.0% of returns)
Here:
$51,724
State:
$72,104
(% of AGI for various income ranges: 1138.1% for AGIs below $25k, 3700.0% for AGIs $25k-50k, 7790.0% for AGIs $50k-75k, 9470.0% for AGIs $75k-100k, 18261.2% for AGIs $100k-200k)
Taxable interest for individuals: $524 (reported on 35.8% of returns)
This zip code:
$524
New York:
$3,075
(% of AGI for various income ranges: 31.2% for AGIs below $25k, 10.6% for AGIs $25k-50k, 11.4% for AGIs $50k-75k, 37.1% for AGIs $75k-100k, 61.3% for AGIs $100k-200k)
Ordinary dividends: $3,107 (reported on 17.3% of returns)
Here:
$3,107
State:
$11,095
(% of AGI for various income ranges: 12.5% for AGIs below $25k, 50.0% for AGIs $25k-50k, 82.9% for AGIs $75k-100k, 333.8% for AGIs $100k-200k)
Net capital gain/loss in AGI: +$9,327 (reported on 13.6% of returns)
Here:
+$9,327
State:
+$44,925
(% of AGI for various income ranges: 61.1% for AGIs $25k-50k, 188.6% for AGIs $50k-75k, 980.0% for AGIs $100k-200k)
Profit/loss from business: +$7,242 (reported on 14.8% of returns)
Here:
+$7,242
State:
+$14,940
(% of AGI for various income ranges: 120.6% for AGIs below $25k, 162.8% for AGIs $25k-50k, 207.1% for AGIs $50k-75k, 297.5% for AGIs $100k-200k)
Taxable individual retirement arrangement distribution: $11,575 (reported on 9.9% of returns)
12057:
$11,575
New York:
$19,609
(% of AGI for various income ranges: 71.9% for AGIs below $25k, 200.6% for AGIs $25k-50k, 642.9% for AGIs $75k-100k)
Total itemized deductions: $22,200 (reported on 2.5% of returns)
Here:
$22,200
State:
$39,326
(% of AGI for various income ranges: 277.5% for AGIs below $25k)
Taxes paid: $8,700 (reported on 2.5% of returns)
12057:
$8,700
State:
$9,183
(% of AGI for various income ranges: 96.7% for AGIs $25k-50k)
Earned income credit: $1,977 (reported on 16.0% of returns)
Here:
$1,977
State:
$2,138
(% of AGI for various income ranges: 88.1% for AGIs below $25k, 64.4% for AGIs $25k-50k)
Percentage of individuals using paid preparers for their 2020 taxes: 95.1%
Here:
95%
State:
95%
(% for various income ranges: 91.3% for AGIs below $25k, 100.0% for AGIs $25k-50k, 91.7% for AGIs $50k-75k, 90.0% for AGIs $75k-100k, 100.0% for AGIs $100k-200k)
Averages for the 2012 tax year for zip code 12057, filed in 2013:
Average Adjusted Gross Income (AGI) in 2012: $44,265 (Individual Income Tax Returns)
Here:
$44,265
State:
$77,088
Salary/wage: $40,292 (reported on 85.1% of returns)
Here:
$40,292
State:
$60,593
(% of AGI for various income ranges: 69.2% for AGIs below $25k, 81.6% for AGIs $25k-50k, 81.6% for AGIs $50k-75k, 86.6% for AGIs $75k-100k, 65.6% for AGIs $100k-200k)
Taxable interest for individuals: $810 (reported on 39.2% of returns)
This zip code:
$810
New York:
$3,125
(% of AGI for various income ranges: 2.1% for AGIs below $25k, 1.5% for AGIs $25k-50k, 0.2% for AGIs $50k-75k, 0.2% for AGIs $75k-100k, 0.4% for AGIs $100k-200k)
Ordinary dividends: $1,376 (reported on 23.0% of returns)
Here:
$1,376
State:
$10,299
(% of AGI for various income ranges: 0.7% for AGIs below $25k, 1.6% for AGIs $25k-50k, 0.5% for AGIs $50k-75k, 0.6% for AGIs $100k-200k)
Net capital gain/loss in AGI: +$4,212 (reported on 10.8% of returns)
Here:
+$4,212
State:
+$42,474
Profit/loss from business: +$6,836 (reported on 14.9% of returns)
Here:
+$6,836
State:
+$16,168
(% of AGI for various income ranges: 8.5% for AGIs below $25k, 2.4% for AGIs $25k-50k, 3.9% for AGIs $50k-75k)
Taxable individual retirement arrangement distribution: $7,567 (reported on 8.1% of returns)
12057:
$7,567
New York:
$17,621
Total itemized deductions: $17,114 (23% of AGI, reported on 28.4% of returns)
Here:
$17,114
State:
$34,985
Here:
23.2% of AGI
State:
21.3% of AGI
(% of AGI for various income ranges: 9.3% for AGIs below $25k, 8.9% for AGIs $25k-50k, 10.2% for AGIs $50k-75k, 12.6% for AGIs $75k-100k, 13.2% for AGIs $100k-200k)
Charity contributions: $1,880 (reported on 20.3% of returns)
Here:
$1,880
State:
$5,572
(% of AGI for various income ranges: 0.8% for AGIs $25k-50k, 0.6% for AGIs $50k-75k, 0.8% for AGIs $75k-100k, 1.6% for AGIs $100k-200k)
Taxes paid: $8,162 (reported on 28.4% of returns)
12057:
$8,162
State:
$18,656
(% of AGI for various income ranges: 5.1% for AGIs $25k-50k, 4.5% for AGIs $50k-75k, 6.3% for AGIs $75k-100k, 7.2% for AGIs $100k-200k)
Earned income credit: $2,150 (reported on 16.2% of returns)
Here:
$2,150
State:
$2,230
(% of AGI for various income ranges: 5.9% for AGIs below $25k, 1.0% for AGIs $25k-50k)
Percentage of individuals using paid preparers for their 2012 taxes: 56.8%
Here:
57%
State:
66%
(% for various income ranges: 48.1% for AGIs below $25k, 57.1% for AGIs $25k-50k, 61.5% for AGIs $50k-75k, 71.4% for AGIs $75k-100k, 66.7% for AGIs $100k-200k)
Averages for the 2004 tax year for zip code 12057, filed in 2005:
Average Adjusted Gross Income (AGI) in 2004: $36,653 (Individual Income Tax Returns)
Here:
$36,653
State:
$59,519
Salary/wage: $33,781 (reported on 85.5% of returns)
Here:
$33,781
State:
$50,673
(% of AGI for various income ranges: 89.6% for AGIs below $10k, 74.7% for AGIs $10k-25k, 83.0% for AGIs $25k-50k, 86.4% for AGIs $50k-75k, 82.0% for AGIs $75k-100k, 62.3% for AGIs over 100k)
Taxable interest for individuals: $737 (reported on 50.1% of returns)
This zip code:
$737
New York:
$2,377
(% of AGI for various income ranges: 2.1% for AGIs below $10k, 2.6% for AGIs $10k-25k, 1.5% for AGIs $25k-50k, 0.3% for AGIs $50k-75k, 0.3% for AGIs $75k-100k, 0.6% for AGIs over 100k)
Taxable dividends: $1,915 (reported on 25.1% of returns)
Here:
$1,915
State:
$5,394
(% of AGI for various income ranges: 2.9% for AGIs below $10k, 0.8% for AGIs $10k-25k, 1.1% for AGIs $25k-50k, 0.4% for AGIs $50k-75k, 1.0% for AGIs $75k-100k, 3.3% for AGIs over 100k)
Net capital gain/loss: +$8,124 (reported on 15.0% of returns)
Here:
+$8,124
State:
+$23,581
(% of AGI for various income ranges: 7.0% for AGIs below $10k, -0.1% for AGIs $10k-25k, 1.4% for AGIs $25k-50k, 0.1% for AGIs $50k-75k, 14.5% for AGIs over 100k)
Profit/loss from business: +$6,041 (reported on 16.2% of returns)
Here:
+$6,041
State:
+$13,809
(% of AGI for various income ranges: 12.1% for AGIs below $10k, 7.0% for AGIs $10k-25k, 2.4% for AGIs $25k-50k, 3.1% for AGIs $50k-75k)
Profit/loss from farming: +$583 (reported on 3.2% of returns)
Here:
+$583
State:
-$2,666
IRA payment deduction: $2,923 (reported on 1.7% of returns)
12057:
$2,923
New York:
$3,115
Total itemized deductions: $14,472 (21% of AGI, reported on 25.9% of returns)
Here:
$14,472
State:
$25,864
Here:
21.3% of AGI
State:
21.9% of AGI
(% of AGI for various income ranges: 9.5% for AGIs $10k-25k, 8.3% for AGIs $25k-50k, 11.2% for AGIs $50k-75k, 11.9% for AGIs $75k-100k, 12.2% for AGIs over 100k)
Charity contributions deductions: $1,628 (2% of AGI, reported on 22.8% of returns)
Here:
$1,628
State:
$4,439
Here:
2.3% of AGI
State:
3.6% of AGI
(% of AGI for various income ranges: 1.1% for AGIs $10k-25k, 0.6% for AGIs $25k-50k, 0.9% for AGIs $50k-75k, 0.8% for AGIs $75k-100k, 2.0% for AGIs over 100k)
Total tax: $4,465 (reported on 73.2% of returns)
12057:
$4,465
State:
$11,730
(% of AGI for various income ranges: 2.9% for AGIs below $10k, 4.3% for AGIs $10k-25k, 6.4% for AGIs $25k-50k, 8.1% for AGIs $50k-75k, 9.9% for AGIs $75k-100k, 16.8% for AGIs over 100k)
Earned income credit: $1,794 (reported on 16.7% of returns)
Here:
$1,794
State:
$1,757
Percentage of individuals using paid preparers for their 2004 taxes: 65.5%
Here:
65%
State:
67%
(% for various income ranges: 54.1% for AGIs below $10k, 66.7% for AGIs $10k-25k, 71.4% for AGIs $25k-50k, 63.5% for AGIs $50k-75k, 71.4% for AGIs $75k-100k, 76.7% for AGIs over 100k)
Likely homosexual households (counted as self-reported same-sex unmarried-partner households)
Lesbian couples: 0.0% of all households
Gay men: 1.4% of all households
Household received Food Stamps/SNAP in the past 12 months: 78 Household did not receive Food Stamps/SNAP in the past 12 months: 659
Women who had a birth in the past 12 months: 22 (22 now married, 0 unmarried) Women who did not have a birth in the past 12 months: 394 (164 now married, 228 unmarried)
Housing units in zip code 12057 with a mortgage: 324 (15 second mortgage, 15 both second mortgage and home equity loan) Median monthly owner costs for units with a mortgage: $1,509 Median monthly owner costs for units without a mortgage: $659
Residents with income below the poverty level in 2022:
This zip code:
3.7%
Whole state:
14.3%
Residents with income below 50% of the poverty level in 2022:
This zip code:
2.8%
Whole state:
6.8%
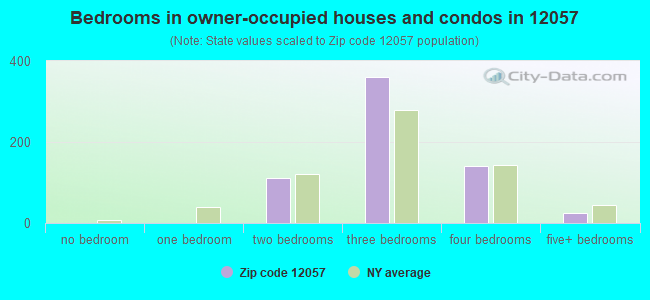
Median number of rooms in houses and condos:
Here:
6.6
State:
6.3
Median number of rooms in apartments:
Here:
4.1
State:
3.8
Notable locations in this zip code not listed on our city pages
Notable locations in zip code 12057: Hathaways Drive-In (A), Elm Spring Farm (B), Happenchance Farm (C), Post Corners (D), Perrys Orchard (E). Display/hide their locations on the map
Size of family households: 223 2-persons, 95 3-persons, 153 4-persons, 27 5-persons
Size of nonfamily households: 212 1-person, 27 2-persons
227 married couples with children.
78 single-parent households (66 men, 12 women).
95.1% of residents of 12057 zip code speak English at home.
0.9% of residents speak Spanish at home (100% not well).
4.1% of residents speak Asian or Pacific Island language at home (63% very well, 18% not well, 18% not at all).
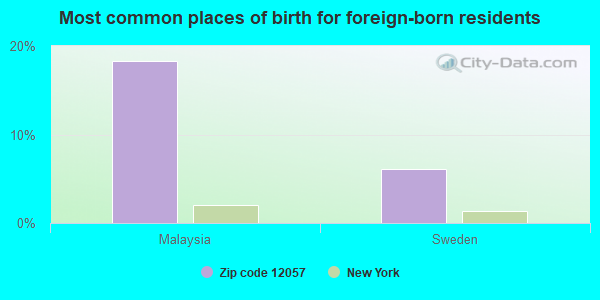
Foreign born population: 82 (4.2%) (75.7% of them are naturalized citizens)
This zip code:
4.2%
Whole state:
22.7%
18%Malaysia
6%Sweden
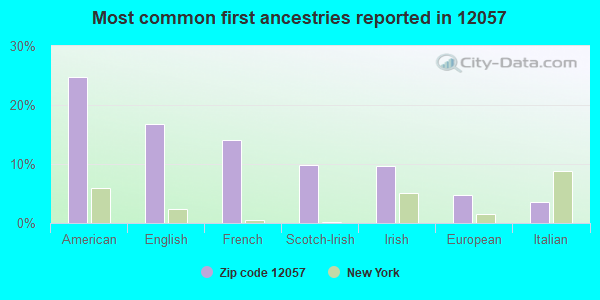
25%American
17%English
14%French
10%Scotch-Irish
10%Irish
5%European
4%Italian
Year of entry for the foreign-born population
62010 or later
442000 to 2009
271990 to 1999
0Before 1990
Facilities with environmental interests located in this zip code:
EAGLE BRIDGE MACHINE & TOOL (135 STATE RT 67 in EAGLE BRIDGE, NY)
Conditionally Exempt Small Quantity Generators, less than 100 kg/month of hazardous waste (Resource Conservation and Recovery Act (tracking hazardous waste)) Organizations: JOHN D NORTON (CONTACT/OPERATOR)
, ROBERT FARRARA (CONTACT/OWNER)
FAA VORTAC (1 SHAKER HOLLOW RD in WHITE CREEK, NY) . Federal Facility. FEDERAL AVIATION ADMINISTRATION
Conditionally Exempt Small Quantity Generators, less than 100 kg/month of hazardous waste (Resource Conservation and Recovery Act (tracking hazardous waste)) - notification Organizations: WALTER LOBER (CONTACT/OWNER)
Housing units lacking complete plumbing facilities: 4.3%
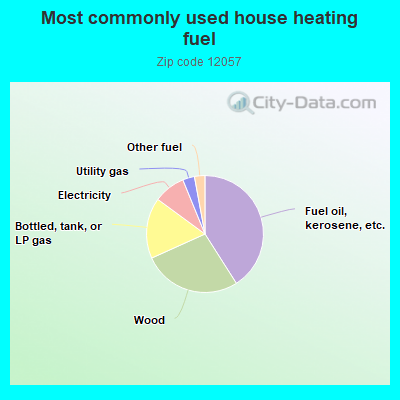
41.2%Fuel oil, kerosene, etc.
27.4%Wood
16.9%Bottled, tank, or LP gas
8.8%Electricity
3.3%Utility gas
2.9%Other fuel
Population in 1990: 2,252.
Place of birth for U.S.-born residents:
This state: 864
Northeast: 903
Midwest: 38
South: 54
West: 22
70% of the 12057 zip code residents lived in the same house 5 years ago. Out of people who lived in different houses, 28% lived in this county. Out of people who lived in different counties, 50% lived in New York.
93% of the 12057 zip code residents lived in the same house 1 year ago. Out of people who lived in different houses, 11% moved from different county within same state. Out of people who lived in different houses, 97% moved from different state.
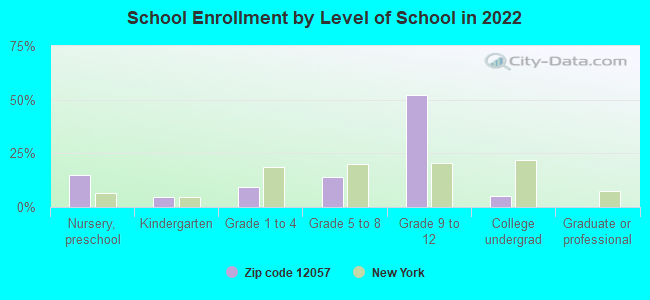
Private vs. public school enrollment:
Students in private schools in grades 1 to 8 (elementary and middle school):
Here:
0.0%
New York:
15.6%
Students in private schools in grades 9 to 12 (high school):
Here:
0.0%
New York:
15.0%
Students in private undergraduate colleges: 16
Here:
72.1%
New York:
39.2%
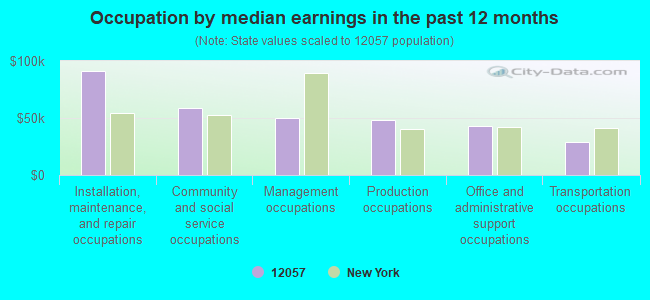
Occupation by median earnings in the past 12 months ($)
91,293Installation, maintenance, and repair occupations
58,603Community and social service occupations
50,105Management occupations
48,511Production occupations
43,127Office and administrative support occupations
29,217Transportation occupations
Top industries in this zip code by the number of employees in 2005:
Accommodation and Food Services: Full-Service Restaurants (10-19 employees: 1 establishment)
Construction: Framing Contractors (5-9: 1)
Other Services (except Public Administration): Business Associations (5-9: 1)
Administrative and Support and Waste Management and Remediation Services: Landscaping Services (1-4: 1)
People in group quarters in 2000:
8 people in agriculture workers' dormitories on farms
Fatal accident statistics in 2012:
Fatal accident count: 2
Vehicles involved in fatal accidents: 4
Fatal accidents caused by drunken drivers: 0
Fatalities: 3
Persons involved in fatal accidents: 6
Pedestrians involved in fatal accidents: 0
Fatal accident statistics in 2010:
Fatal accident count: 1
Vehicles involved in fatal accidents: 1
Fatal accidents caused by drunken drivers: 0
Fatalities: 1
Persons involved in fatal accidents: 1
Pedestrians involved in fatal accidents: 0
Home Mortgage Disclosure Act Aggregated Statistics For Year 2009 (Based on 6 partial tracts)
A) FHA, FSA/RHS & VA Home Purchase Loans
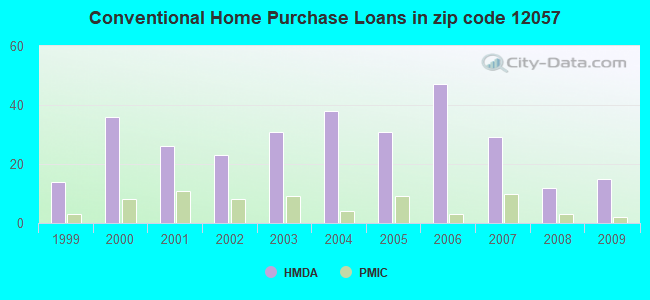
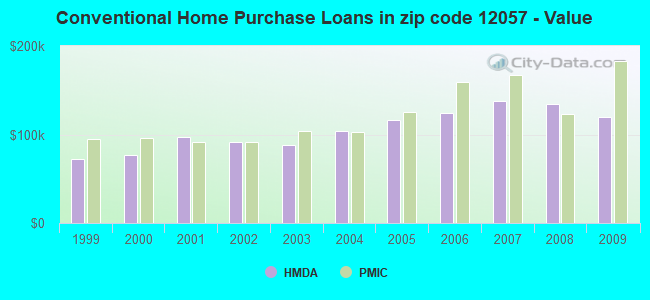
B) Conventional Home Purchase Loans
C) Refinancings
D) Home Improvement Loans
F) Non-occupant Loans on < 5 Family Dwellings (A B C & D)
G) Loans On Manufactured Home Dwelling (A B C & D)
Number
Average Value
Number
Average Value
Number
Average Value
Number
Average Value
Number
Average Value
Number
Average Value
LOANS ORIGINATED
11
$136,226
15
$119,880
44
$136,212
5
$55,012
4
$103,625
0
$0
APPLICATIONS APPROVED, NOT ACCEPTED
2
$91,075
2
$115,840
4
$138,145
1
$67,140
0
$0
1
$24,940
APPLICATIONS DENIED
4
$145,510
6
$119,642
31
$122,910
4
$35,892
1
$98,350
3
$81,280
APPLICATIONS WITHDRAWN
4
$129,845
2
$80,495
14
$160,336
1
$95,250
1
$108,080
0
$0
FILES CLOSED FOR INCOMPLETENESS
1
$102,030
1
$147,380
2
$103,580
0
$0
1
$147,380
0
$0
Aggregated Statistics For Year 2008 (Based on 6 partial tracts)
A) FHA, FSA/RHS & VA Home Purchase Loans
B) Conventional Home Purchase Loans
C) Refinancings
D) Home Improvement Loans
F) Non-occupant Loans on < 5 Family Dwellings (A B C & D)
G) Loans On Manufactured Home Dwelling (A B C & D)
Number
Average Value
Number
Average Value
Number
Average Value
Number
Average Value
Number
Average Value
Number
Average Value
LOANS ORIGINATED
8
$152,408
12
$134,888
36
$132,234
14
$37,622
3
$146,803
2
$68,340
APPLICATIONS APPROVED, NOT ACCEPTED
0
$0
6
$126,008
6
$98,533
5
$41,726
1
$235,810
3
$53,097
APPLICATIONS DENIED
2
$105,895
6
$94,230
36
$148,260
16
$31,444
2
$87,355
2
$59,300
APPLICATIONS WITHDRAWN
1
$61,220
2
$109,675
22
$155,066
1
$115,440
0
$0
0
$0
FILES CLOSED FOR INCOMPLETENESS
0
$0
1
$140,260
3
$140,093
2
$112,460
1
$103,540
0
$0
Aggregated Statistics For Year 2007 (Based on 6 partial tracts)
A) FHA, FSA/RHS & VA Home Purchase Loans
B) Conventional Home Purchase Loans
C) Refinancings
D) Home Improvement Loans
F) Non-occupant Loans on < 5 Family Dwellings (A B C & D)
G) Loans On Manufactured Home Dwelling (A B C & D)
Number
Average Value
Number
Average Value
Number
Average Value
Number
Average Value
Number
Average Value
Number
Average Value
LOANS ORIGINATED
4
$110,410
29
$137,753
47
$134,426
17
$38,964
5
$110,584
4
$76,902
APPLICATIONS APPROVED, NOT ACCEPTED
0
$0
4
$126,182
11
$108,838
2
$23,585
1
$121,800
1
$32,500
APPLICATIONS DENIED
0
$0
14
$135,433
36
$130,140
10
$55,888
4
$166,782
7
$58,027
APPLICATIONS WITHDRAWN
0
$0
7
$85,576
28
$132,476
6
$51,268
3
$102,283
0
$0
FILES CLOSED FOR INCOMPLETENESS
0
$0
0
$0
3
$143,773
1
$136,590
1
$97,500
0
$0
Aggregated Statistics For Year 2006 (Based on 6 partial tracts)
A) FHA, FSA/RHS & VA Home Purchase Loans
B) Conventional Home Purchase Loans
C) Refinancings
D) Home Improvement Loans
F) Non-occupant Loans on < 5 Family Dwellings (A B C & D)
G) Loans On Manufactured Home Dwelling (A B C & D)
Number
Average Value
Number
Average Value
Number
Average Value
Number
Average Value
Number
Average Value
Number
Average Value
LOANS ORIGINATED
6
$115,462
47
$124,446
45
$116,639
25
$42,396
8
$101,025
7
$81,919
APPLICATIONS APPROVED, NOT ACCEPTED
0
$0
6
$144,888
8
$127,522
1
$11,240
0
$0
2
$56,305
APPLICATIONS DENIED
3
$133,523
17
$82,005
53
$113,772
25
$38,805
5
$73,810
7
$89,613
APPLICATIONS WITHDRAWN
3
$127,017
10
$94,677
29
$124,867
4
$46,358
1
$80,110
0
$0
FILES CLOSED FOR INCOMPLETENESS
0
$0
1
$126,740
7
$119,024
1
$146,630
1
$108,080
0
$0
Aggregated Statistics For Year 2005 (Based on 6 partial tracts)
A) FHA, FSA/RHS & VA Home Purchase Loans
B) Conventional Home Purchase Loans
C) Refinancings
D) Home Improvement Loans
E) Loans on Dwellings For 5+ Families
F) Non-occupant Loans on < 5 Family Dwellings (A B C & D)
G) Loans On Manufactured Home Dwelling (A B C & D)
Number
Average Value
Number
Average Value
Number
Average Value
Number
Average Value
Number
Average Value
Number
Average Value
Number
Average Value
LOANS ORIGINATED
2
$123,105
31
$116,719
60
$104,320
24
$29,925
0
$0
7
$98,516
3
$58,970
APPLICATIONS APPROVED, NOT ACCEPTED
0
$0
13
$106,090
9
$107,552
4
$22,075
0
$0
2
$167,420
4
$37,362
APPLICATIONS DENIED
2
$90,990
14
$102,054
67
$106,488
16
$47,354
1
$68,020
3
$188,257
9
$81,974
APPLICATIONS WITHDRAWN
0
$0
4
$123,885
43
$123,893
7
$96,490
0
$0
2
$90,085
3
$87,790
FILES CLOSED FOR INCOMPLETENESS
0
$0
2
$78,405
10
$118,008
1
$21,160
0
$0
0
$0
0
$0
Aggregated Statistics For Year 2004 (Based on 6 partial tracts)
A) FHA, FSA/RHS & VA Home Purchase Loans
B) Conventional Home Purchase Loans
C) Refinancings
D) Home Improvement Loans
F) Non-occupant Loans on < 5 Family Dwellings (A B C & D)
G) Loans On Manufactured Home Dwelling (A B C & D)
Number
Average Value
Number
Average Value
Number
Average Value
Number
Average Value
Number
Average Value
Number
Average Value
LOANS ORIGINATED
4
$112,042
38
$104,409
70
$96,545
20
$32,363
8
$102,460
6
$76,293
APPLICATIONS APPROVED, NOT ACCEPTED
0
$0
6
$77,752
13
$104,581
3
$35,773
2
$69,535
1
$39,640
APPLICATIONS DENIED
0
$0
11
$99,161
52
$93,247
15
$31,290
1
$114,450
7
$47,951
APPLICATIONS WITHDRAWN
1
$91,900
3
$122,817
57
$95,947
5
$79,020
3
$79,837
2
$66,345
FILES CLOSED FOR INCOMPLETENESS
0
$0
3
$72,810
7
$106,839
2
$37,690
1
$71,050
0
$0
Aggregated Statistics For Year 2003 (Based on 6 partial tracts)
A) FHA, FSA/RHS & VA Home Purchase Loans
B) Conventional Home Purchase Loans
C) Refinancings
D) Home Improvement Loans
F) Non-occupant Loans on < 5 Family Dwellings (A B C & D)
Number
Average Value
Number
Average Value
Number
Average Value
Number
Average Value
Number
Average Value
LOANS ORIGINATED
6
$91,257
31
$88,065
94
$88,819
13
$19,930
4
$94,812
APPLICATIONS APPROVED, NOT ACCEPTED
2
$59,990
6
$130,577
21
$84,272
1
$18,470
0
$0
APPLICATIONS DENIED
2
$120,830
8
$110,290
38
$78,031
6
$26,053
1
$114,030
APPLICATIONS WITHDRAWN
0
$0
2
$97,685
42
$90,845
1
$19,160
0
$0
FILES CLOSED FOR INCOMPLETENESS
0
$0
1
$82,380
3
$90,547
0
$0
0
$0
Aggregated Statistics For Year 2002 (Based on 6 partial tracts)
A) FHA, FSA/RHS & VA Home Purchase Loans
B) Conventional Home Purchase Loans
C) Refinancings
D) Home Improvement Loans
F) Non-occupant Loans on < 5 Family Dwellings (A B C & D)
Number
Average Value
Number
Average Value
Number
Average Value
Number
Average Value
Number
Average Value
LOANS ORIGINATED
6
$94,750
23
$91,139
61
$83,744
12
$31,595
5
$66,310
APPLICATIONS APPROVED, NOT ACCEPTED
0
$0
3
$107,103
10
$86,256
2
$5,670
1
$45,350
APPLICATIONS DENIED
0
$0
14
$68,356
29
$95,000
9
$18,437
3
$35,533
APPLICATIONS WITHDRAWN
1
$58,200
3
$104,787
27
$76,790
5
$13,530
0
$0
FILES CLOSED FOR INCOMPLETENESS
0
$0
1
$71,800
4
$72,902
0
$0
0
$0
Aggregated Statistics For Year 2001 (Based on 6 partial tracts)
A) FHA, FSA/RHS & VA Home Purchase Loans
B) Conventional Home Purchase Loans
C) Refinancings
D) Home Improvement Loans
F) Non-occupant Loans on < 5 Family Dwellings (A B C & D)
Number
Average Value
Number
Average Value
Number
Average Value
Number
Average Value
Number
Average Value
LOANS ORIGINATED
4
$77,018
26
$97,722
48
$81,578
9
$10,694
5
$122,800
APPLICATIONS APPROVED, NOT ACCEPTED
0
$0
3
$45,990
13
$79,658
3
$26,137
2
$93,610
APPLICATIONS DENIED
1
$89,450
9
$80,157
36
$72,197
13
$14,312
3
$46,697
APPLICATIONS WITHDRAWN
1
$50,620
2
$32,790
26
$78,063
4
$14,915
0
$0
FILES CLOSED FOR INCOMPLETENESS
0
$0
1
$155,800
6
$64,888
1
$37,790
0
$0
Aggregated Statistics For Year 2000 (Based on 6 partial tracts)
A) FHA, FSA/RHS & VA Home Purchase Loans
B) Conventional Home Purchase Loans
C) Refinancings
D) Home Improvement Loans
F) Non-occupant Loans on < 5 Family Dwellings (A B C & D)
Number
Average Value
Number
Average Value
Number
Average Value
Number
Average Value
Number
Average Value
LOANS ORIGINATED
3
$96,973
36
$76,958
21
$68,079
16
$12,409
3
$39,630
APPLICATIONS APPROVED, NOT ACCEPTED
2
$87,210
5
$66,462
11
$81,205
6
$38,357
0
$0
APPLICATIONS DENIED
2
$49,505
21
$62,106
39
$47,656
10
$31,883
1
$13,600
APPLICATIONS WITHDRAWN
1
$49,640
3
$66,100
24
$59,917
4
$26,882
2
$78,590
FILES CLOSED FOR INCOMPLETENESS
0
$0
0
$0
6
$62,325
1
$43,080
0
$0
Aggregated Statistics For Year 1999 (Based on 3 partial tracts)
A) FHA, FSA/RHS & VA Home Purchase Loans
B) Conventional Home Purchase Loans
C) Refinancings
D) Home Improvement Loans
F) Non-occupant Loans on < 5 Family Dwellings (A B C & D)


+$583
-$2,666
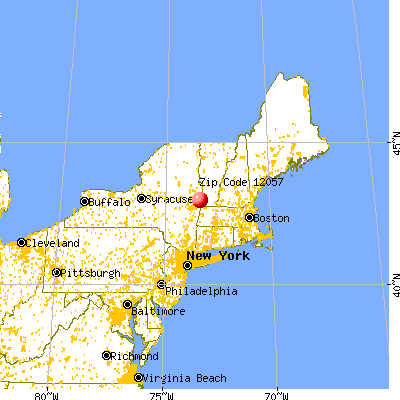
 Nearest zip codes: 12816, 05257, 12090, 12028, 12089, 12873.