Estimated zip code population in 2022: 599 Zip code population in 2010: 444 Zip code population in 2000: 192
March 2022 cost of living index in zip code 12063: 93.6 (less than average, U.S. average is 100)
Land area: 1.4 sq. mi. Water area: 0.0 sq. mi.
Population density: 420 people per square mile
(low).
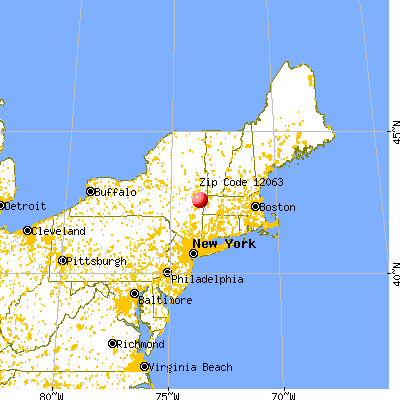
OSM Map
General Map
Google Map
MSN Map
OSM Map
General Map
Google Map
MSN Map
OSM Map
General Map
Google Map
MSN Map
OSM Map
General Map
Google Map
MSN Map
Please wait while loading the map...
Median real estate property taxes paid for housing units with mortgages in 2022: $7,106 Median real estate property taxes paid for housing units with no mortgage in 2022: $9,755
Business Search- 14 Million verified businesses
Males: 202
(33.8%)
Females: 396
(66.2%)
For population 25 years and over in 12063:
High school or higher: 99.1%
Bachelor's degree or higher: 35.7%
Graduate or professional degree: 22.4%
Mean travel time to work (commute): 22.0 minutes
For population 15 years and over in 12063:
Never married: 18.2%
Now married: 53.0%
Separated: 0.0%
Widowed: 19.3%
Divorced: 9.4%
Zip code 12063 compared to state average:
Median house value below state average.
Unemployed percentage significantly below state average.
Black race population percentage significantly below state average.
Hispanic race population percentage significantly below state average.
Median age significantly above state average.
Foreign-born population percentage significantly below state average.
Renting percentage significantly below state average.
Length of stay since moving in above state average.
Number of rooms per house significantly above state average.
Estimated median house/condo value in 2022: $255,084
12063:
$255,084
New York:
$400,400
Median resident age:
This zip code:
53.9 years
New York median age:
40.0 years
Average household size:
This zip code:
2.1 people
New York:
2.5 people
Averages for the 2020 tax year for zip code 12063, filed in 2021:
Average Adjusted Gross Income (AGI) in 2020: $83,061 (Individual Income Tax Returns)
Here:
$83,061
State:
$90,930
Salary/wage: $79,214 (reported on 75.0% of returns)
Here:
$79,214
State:
$72,104
(% of AGI for various income ranges: 884.0% for AGIs below $25k, 3615.0% for AGIs $25k-50k, 4625.0% for AGIs $50k-75k, 13740.0% for AGIs $100k-200k)
Taxable interest for individuals: $300 (reported on 42.9% of returns)
This zip code:
$300
New York:
$3,075
(% of AGI for various income ranges: 14.0% for AGIs below $25k, 17.5% for AGIs $50k-75k, 22.5% for AGIs $100k-200k)
Ordinary dividends: $3,317 (reported on 21.4% of returns)
Here:
$3,317
State:
$11,095
(% of AGI for various income ranges: 46.0% for AGIs below $25k, 440.0% for AGIs $100k-200k)
Net capital gain/loss in AGI: +$5,875 (reported on 14.3% of returns)
Here:
+$5,875
State:
+$44,925
(% of AGI for various income ranges: 587.5% for AGIs $100k-200k)
Profit/loss from business: +$9,225 (reported on 14.3% of returns)
Here:
+$9,225
State:
+$14,940
(% of AGI for various income ranges: 922.5% for AGIs $100k-200k)
Taxable individual retirement arrangement distribution: $5,550 (reported on 7.1% of returns)
12063:
$5,550
New York:
$19,609
(% of AGI for various income ranges: 222.0% for AGIs below $25k)
Earned income credit: $1,033 (reported on 10.7% of returns)
Here:
$1,033
State:
$2,138
(% of AGI for various income ranges: 62.0% for AGIs below $25k)
Percentage of individuals using paid preparers for their 2020 taxes: 92.9%
Here:
93%
State:
95%
(% for various income ranges: 100.0% for AGIs below $25k, 83.3% for AGIs $25k-50k, 100.0% for AGIs $50k-75k, 100.0% for AGIs $75k-100k, 83.3% for AGIs $100k-200k, 100.0% for AGIs over 200k)
Averages for the 2012 tax year for zip code 12063, filed in 2013:
Average Adjusted Gross Income (AGI) in 2012: $69,340 (Individual Income Tax Returns)
Here:
$69,340
State:
$77,088
Salary/wage: $59,896 (reported on 80.0% of returns)
Here:
$59,896
State:
$60,593
(% of AGI for various income ranges: 65.2% for AGIs below $25k, 80.1% for AGIs $25k-50k, 65.7% for AGIs $50k-75k, 82.3% for AGIs $75k-100k, 64.9% for AGIs $100k-200k)
Taxable interest for individuals: $354 (reported on 43.3% of returns)
This zip code:
$354
New York:
$3,125
(% of AGI for various income ranges: 0.6% for AGIs $25k-50k, 0.3% for AGIs $50k-75k, 0.2% for AGIs $100k-200k)
Ordinary dividends: $1,200 (reported on 23.3% of returns)
Here:
$1,200
State:
$10,299
Net capital gain/loss in AGI: +$100 (reported on 13.3% of returns)
Here:
+$100
State:
+$42,474
Profit/loss from business: +$9,225 (reported on 13.3% of returns)
Here:
+$9,225
State:
+$16,168
Taxable individual retirement arrangement distribution: $5,650 (reported on 6.7% of returns)
12063:
$5,650
New York:
$17,621
Total itemized deductions: $22,823 (19% of AGI, reported on 43.3% of returns)
Here:
$22,823
State:
$34,985
Here:
19.3% of AGI
State:
21.3% of AGI
(% of AGI for various income ranges: 12.1% for AGIs $25k-50k, 12.3% for AGIs $50k-75k, 14.7% for AGIs $75k-100k, 16.1% for AGIs $100k-200k)
Charity contributions: $1,910 (reported on 33.3% of returns)
Here:
$1,910
State:
$5,572
(% of AGI for various income ranges: 0.7% for AGIs $25k-50k, 2.5% for AGIs $50k-75k, 0.9% for AGIs $100k-200k)
Taxes paid: $12,962 (reported on 43.3% of returns)
12063:
$12,962
State:
$18,656
(% of AGI for various income ranges: 5.3% for AGIs $25k-50k, 6.0% for AGIs $50k-75k, 8.0% for AGIs $75k-100k, 9.8% for AGIs $100k-200k)
Earned income credit: $1,500 (reported on 6.7% of returns)
Here:
$1,500
State:
$2,230
(% of AGI for various income ranges: 3.4% for AGIs below $25k)
Percentage of individuals using paid preparers for their 2012 taxes: 53.3%
Here:
53%
State:
66%
(% for various income ranges: 50.0% for AGIs below $25k, 50.0% for AGIs $25k-50k, 100.0% for AGIs $50k-75k, 57.1% for AGIs $100k-200k)
Averages for the 2004 tax year for zip code 12063, filed in 2005:
Average Adjusted Gross Income (AGI) in 2004: $50,341 (Individual Income Tax Returns)
Here:
$50,341
State:
$59,519
Salary/wage: $44,932 (reported on 88.0% of returns)
Here:
$44,932
State:
$50,673
(% of AGI for various income ranges: 86.2% for AGIs below $10k, 78.2% for AGIs $10k-25k, 80.9% for AGIs $25k-50k, 85.0% for AGIs $50k-75k, 85.4% for AGIs $75k-100k, 71.2% for AGIs over 100k)
Taxable interest for individuals: $531 (reported on 56.5% of returns)
This zip code:
$531
New York:
$2,377
(% of AGI for various income ranges: 0.4% for AGIs below $10k, 0.5% for AGIs $10k-25k, 0.9% for AGIs $25k-50k, 0.6% for AGIs $50k-75k, 0.9% for AGIs $75k-100k, 0.4% for AGIs over 100k)
Taxable dividends: $956 (reported on 28.7% of returns)
Here:
$956
State:
$5,394
(% of AGI for various income ranges: 5.0% for AGIs below $10k, 0.6% for AGIs $25k-50k, 0.7% for AGIs $50k-75k, 0.4% for AGIs $75k-100k, 0.4% for AGIs over 100k)
Net capital gain/loss: +$6,847 (reported on 18.6% of returns)
Here:
+$6,847
State:
+$23,581
(% of AGI for various income ranges: -1.9% for AGIs $10k-25k, 0.2% for AGIs $50k-75k, 6.8% for AGIs over 100k)
Profit/loss from business: +$4,727 (reported on 13.9% of returns)
Here:
+$4,727
State:
+$13,809
(% of AGI for various income ranges: 25.4% for AGIs below $10k, 3.5% for AGIs $10k-25k, 2.1% for AGIs $25k-50k, 1.8% for AGIs $75k-100k)
Total itemized deductions: $18,460 (21% of AGI, reported on 39.7% of returns)
Here:
$18,460
State:
$25,864
Here:
20.8% of AGI
State:
21.9% of AGI
(% of AGI for various income ranges: 13.6% for AGIs $10k-25k, 8.2% for AGIs $25k-50k, 15.6% for AGIs $50k-75k, 18.5% for AGIs $75k-100k, 15.8% for AGIs over 100k)
Charity contributions deductions: $2,119 (2% of AGI, reported on 37.2% of returns)
Here:
$2,119
State:
$4,439
Here:
2.3% of AGI
State:
3.6% of AGI
(% of AGI for various income ranges: 2.9% for AGIs below $10k, 1.0% for AGIs $25k-50k, 1.4% for AGIs $50k-75k, 1.6% for AGIs $75k-100k, 2.1% for AGIs over 100k)
Total tax: $7,246 (reported on 83.3% of returns)
12063:
$7,246
State:
$11,730
(% of AGI for various income ranges: 4.6% for AGIs below $10k, 5.6% for AGIs $10k-25k, 8.2% for AGIs $25k-50k, 9.8% for AGIs $50k-75k, 9.7% for AGIs $75k-100k, 17.2% for AGIs over 100k)
Earned income credit: $1,667 (reported on 8.5% of returns)
Here:
$1,667
State:
$1,757
Percentage of individuals using paid preparers for their 2004 taxes: 47.3%
Here:
47%
State:
67%
(% for various income ranges: 35.7% for AGIs below $10k, 52.9% for AGIs $10k-25k, 37.8% for AGIs $25k-50k, 56.5% for AGIs $50k-75k, 56.2% for AGIs $75k-100k, 53.8% for AGIs over 100k)
Household received Food Stamps/SNAP in the past 12 months: 0 Household did not receive Food Stamps/SNAP in the past 12 months: 282
Women who did not have a birth in the past 12 months: 93 (64 now married, 27 unmarried)
Housing units in zip code 12063 with a mortgage: 129 Median monthly owner costs for units with a mortgage: $1,856 Median monthly owner costs for units without a mortgage: $1,487
Residents with income below the poverty level in 2022:
This zip code:
8.1%
Whole state:
14.3%
Residents with income below 50% of the poverty level in 2022:
This zip code:
8.1%
Whole state:
6.8%
Median number of rooms in houses and condos:
Here:
7.9
State:
6.3
Notable locations in this zip code not listed on our city pages
Size of family households: 111 2-persons, 71 3-persons, 23 4-persons
Size of nonfamily households: 80 1-person
34 married couples with children.
25 single-parent households (25 women).
99.7% of residents of 12063 zip code speak English at home.
Foreign born population: 0 (0.0%)
:
0.0%
Whole state:
22.7%
29%German
28%French
19%Polish
95.8%Fuel oil, kerosene, etc.
4.3%Utility gas
Place of birth for U.S.-born residents:
This state: 498
Northeast: 48
South: 49
73% of the 12063 zip code residents lived in the same house 5 years ago. Out of people who lived in different houses, 63% lived in this county. Out of people who lived in different counties, 50% lived in New York.
88% of the 12063 zip code residents lived in the same house 1 year ago. Out of people who lived in different houses, 51% moved from this county. Out of people who lived in different houses, 46% moved from different county within same state.
Private vs. public school enrollment:
Students in private schools in grades 1 to 8 (elementary and middle school):
Here:
0.0%
New York:
15.6%
Students in private undergraduate colleges:
Here:
0.0%
New York:
39.2%
Top industries in this zip code by the number of employees in 2005:
Accommodation and Food Services: Limited-Service Restaurants (10-19 employees: 1 establishment)
Administrative and Support and Waste Management and Remediation Services: Exterminating and Pest Control Services (10-19: 1)
Accommodation and Food Services: Full-Service Restaurants (5-9: 1)
Construction: Land Subdivision (1-4: 1)
Other Services (except Public Administration): Religious Organizations (1-4: 1)
Construction: Electrical Contractors (1-4: 1)
Professional, Scientific, and Technical Services: Tax Preparation Services (1-4: 1)
Home Mortgage Disclosure Act Aggregated Statistics For Year 2009 (Based on 2 partial tracts)
A) FHA, FSA/RHS & VA Home Purchase Loans
B) Conventional Home Purchase Loans
C) Refinancings
D) Home Improvement Loans
Number
Average Value
Number
Average Value
Number
Average Value
Number
Average Value
LOANS ORIGINATED
1
$149,860
2
$189,845
6
$181,582
1
$53,250
APPLICATIONS APPROVED, NOT ACCEPTED
0
$0
0
$0
1
$142,660
0
$0
APPLICATIONS DENIED
0
$0
0
$0
2
$229,800
0
$0
APPLICATIONS WITHDRAWN
0
$0
0
$0
1
$215,640
0
$0
FILES CLOSED FOR INCOMPLETENESS
0
$0
0
$0
0
$0
0
$0
Aggregated Statistics For Year 2008 (Based on 2 partial tracts)
A) FHA, FSA/RHS & VA Home Purchase Loans
B) Conventional Home Purchase Loans
C) Refinancings
D) Home Improvement Loans
Number
Average Value
Number
Average Value
Number
Average Value
Number
Average Value
LOANS ORIGINATED
1
$98,500
3
$184,300
3
$178,387
1
$45,870
APPLICATIONS APPROVED, NOT ACCEPTED
0
$0
1
$146,720
1
$116,060
0
$0
APPLICATIONS DENIED
0
$0
1
$100,730
2
$197,085
1
$40,610
APPLICATIONS WITHDRAWN
0
$0
0
$0
1
$156,670
0
$0
FILES CLOSED FOR INCOMPLETENESS
0
$0
0
$0
0
$0
0
$0
Aggregated Statistics For Year 2007 (Based on 2 partial tracts)
B) Conventional Home Purchase Loans
C) Refinancings
D) Home Improvement Loans
Number
Average Value
Number
Average Value
Number
Average Value
LOANS ORIGINATED
3
$187,807
3
$165,860
2
$36,410
APPLICATIONS APPROVED, NOT ACCEPTED
1
$82,770
1
$83,970
0
$0
APPLICATIONS DENIED
0
$0
2
$203,575
1
$38,900
APPLICATIONS WITHDRAWN
0
$0
1
$185,730
0
$0
FILES CLOSED FOR INCOMPLETENESS
0
$0
1
$96,730
0
$0
Aggregated Statistics For Year 2006 (Based on 2 partial tracts)
B) Conventional Home Purchase Loans
C) Refinancings
D) Home Improvement Loans
F) Non-occupant Loans on < 5 Family Dwellings (A B C & D)
Number
Average Value
Number
Average Value
Number
Average Value
Number
Average Value
LOANS ORIGINATED
4
$165,338
4
$131,375
1
$70,130
0
$0
APPLICATIONS APPROVED, NOT ACCEPTED
1
$100,390
1
$160,900
0
$0
0
$0
APPLICATIONS DENIED
1
$101,300
4
$141,642
1
$47,130
1
$100,330
APPLICATIONS WITHDRAWN
1
$116,000
2
$111,625
0
$0
0
$0
FILES CLOSED FOR INCOMPLETENESS
0
$0
0
$0
0
$0
0
$0
Aggregated Statistics For Year 2005 (Based on 2 partial tracts)
B) Conventional Home Purchase Loans
C) Refinancings
D) Home Improvement Loans
F) Non-occupant Loans on < 5 Family Dwellings (A B C & D)
Number
Average Value
Number
Average Value
Number
Average Value
Number
Average Value
LOANS ORIGINATED
4
$166,265
5
$133,550
2
$19,735
1
$35,010
APPLICATIONS APPROVED, NOT ACCEPTED
1
$71,560
1
$79,280
0
$0
0
$0
APPLICATIONS DENIED
1
$102,960
3
$129,310
1
$70,010
0
$0
APPLICATIONS WITHDRAWN
0
$0
2
$169,285
0
$0
0
$0
FILES CLOSED FOR INCOMPLETENESS
0
$0
1
$98,440
0
$0
0
$0
Aggregated Statistics For Year 2004 (Based on 2 partial tracts)
B) Conventional Home Purchase Loans
C) Refinancings
D) Home Improvement Loans
Number
Average Value
Number
Average Value
Number
Average Value
LOANS ORIGINATED
4
$149,708
5
$119,284
1
$77,160
APPLICATIONS APPROVED, NOT ACCEPTED
1
$88,370
2
$119,375
0
$0
APPLICATIONS DENIED
0
$0
3
$126,183
1
$52,450
APPLICATIONS WITHDRAWN
0
$0
2
$132,505
0
$0
FILES CLOSED FOR INCOMPLETENESS
0
$0
0
$0
0
$0
Aggregated Statistics For Year 2003 (Based on 2 partial tracts)
B) Conventional Home Purchase Loans
C) Refinancings
Number
Average Value
Number
Average Value
LOANS ORIGINATED
3
$144,583
10
$119,050
APPLICATIONS APPROVED, NOT ACCEPTED
0
$0
2
$119,835
APPLICATIONS DENIED
1
$51,940
3
$104,467
APPLICATIONS WITHDRAWN
0
$0
2
$97,355
FILES CLOSED FOR INCOMPLETENESS
0
$0
1
$47,990
Aggregated Statistics For Year 2002 (Based on 2 partial tracts)
B) Conventional Home Purchase Loans
C) Refinancings
Number
Average Value
Number
Average Value
LOANS ORIGINATED
3
$117,947
6
$104,123
APPLICATIONS APPROVED, NOT ACCEPTED
0
$0
1
$93,460
APPLICATIONS DENIED
0
$0
2
$98,210
APPLICATIONS WITHDRAWN
0
$0
2
$93,635
FILES CLOSED FOR INCOMPLETENESS
0
$0
0
$0
Aggregated Statistics For Year 2001 (Based on 2 partial tracts)
A) FHA, FSA/RHS & VA Home Purchase Loans
B) Conventional Home Purchase Loans
C) Refinancings
D) Home Improvement Loans
Number
Average Value
Number
Average Value
Number
Average Value
Number
Average Value
LOANS ORIGINATED
1
$53,020
3
$100,747
4
$96,610
1
$18,130
APPLICATIONS APPROVED, NOT ACCEPTED
0
$0
0
$0
1
$90,320
0
$0
APPLICATIONS DENIED
0
$0
1
$48,330
2
$82,080
1
$15,960
APPLICATIONS WITHDRAWN
0
$0
0
$0
2
$67,125
0
$0
FILES CLOSED FOR INCOMPLETENESS
0
$0
0
$0
0
$0
0
$0
Aggregated Statistics For Year 2000 (Based on 2 partial tracts)
A) FHA, FSA/RHS & VA Home Purchase Loans
B) Conventional Home Purchase Loans
C) Refinancings
D) Home Improvement Loans
Number
Average Value
Number
Average Value
Number
Average Value
Number
Average Value
LOANS ORIGINATED
1
$55,430
2
$138,080
2
$68,440
1
$25,280
APPLICATIONS APPROVED, NOT ACCEPTED
0
$0
0
$0
1
$48,110
1
$16,240
APPLICATIONS DENIED
0
$0
1
$20,020
3
$70,337
1
$6,460
APPLICATIONS WITHDRAWN
0
$0
0
$0
1
$69,900
0
$0
FILES CLOSED FOR INCOMPLETENESS
0
$0
0
$0
1
$44,840
0
$0
Aggregated Statistics For Year 1999 (Based on 1 partial tract)
Detailed PMIC statistics for the following Tracts:0525.02
2004 - 2018 National Fire Incident Reporting System (NFIRS) incidents
Based on the data from the years 2004 - 2018 the average number of fires per year is 15. The highest number of reported fires - 25 took place in 2010, and the least - 1 in 2011. The data has an increasing trend.
When looking into fire subcategories, the most reports belonged to: Structure Fires (52.5%), and Outside Fires (37.6%).
Fire incident types reported to NFIRS in Zip Code 12063


 Nearest zip codes: 12061, 12123, 12196, 12033, 12132, 12144.


 Based on the data from the years 2004 - 2018 the average number of fires per year is 15. The highest number of reported fires - 25 took place in 2010, and the least - 1 in 2011. The data has an increasing trend.
 When looking into fire subcategories, the most reports belonged to: Structure Fires (52.5%), and Outside Fires (37.6%).