Estimated zip code population in 2022: 3,108 Zip code population in 2010: 3,418 Zip code population in 2000: 3,106
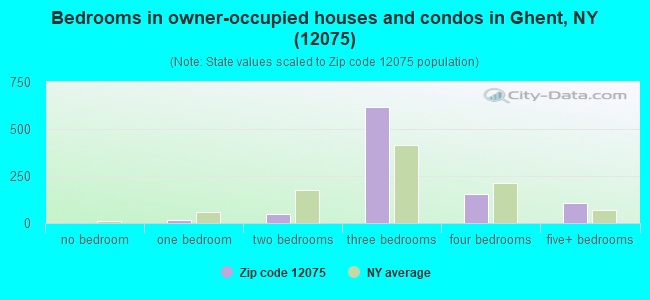
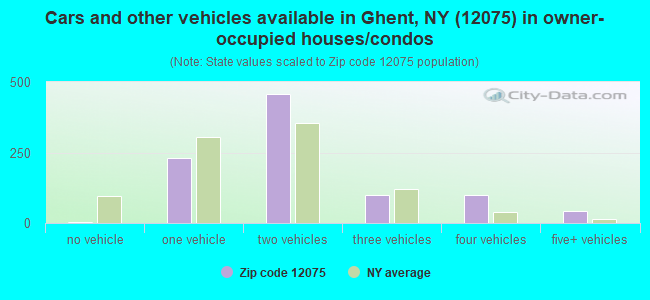
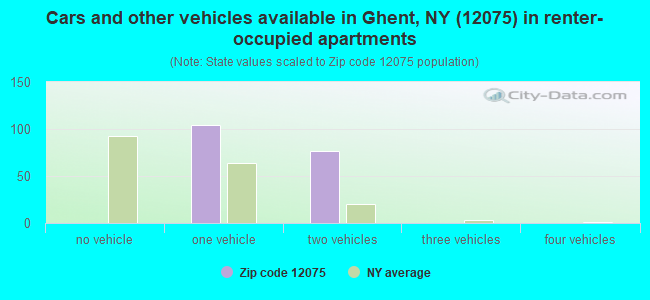
Houses and condos: 1,484 Renter-occupied apartments: 180
% of renters here:
16%
State:
46%
March 2022 cost of living index in zip code 12075: 97.6 (near average, U.S. average is 100)
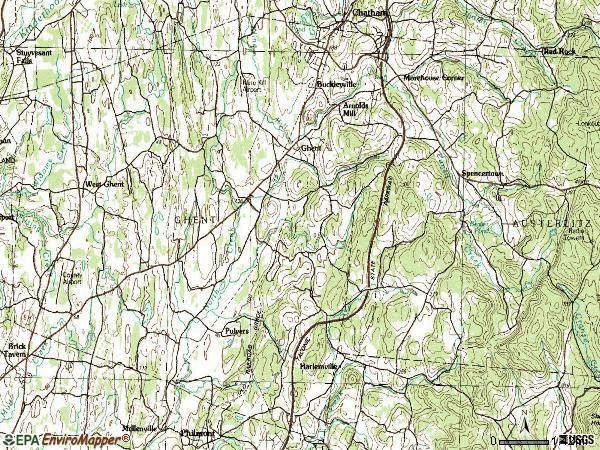
Land area: 39.3 sq. mi. Water area: 0.2 sq. mi.
Population density: 79 people per square mile
(very low).
OSM Map
General Map
Google Map
MSN Map
OSM Map
General Map
Google Map
MSN Map
OSM Map
General Map
Google Map
MSN Map
OSM Map
General Map
Google Map
MSN Map
Please wait while loading the map...
Real estate property taxes paid for housing units in 2022:
This zip code:
1.5% ($5,376)
New York:
1.5% ($6,180)
Median real estate property taxes paid for housing units with mortgages in 2022: $5,366 (1.6%) Median real estate property taxes paid for housing units with no mortgage in 2022: $5,425 (1.4%)
Averages for the 2020 tax year for zip code 12075, filed in 2021:
Average Adjusted Gross Income (AGI) in 2020: $91,738 (Individual Income Tax Returns)
Here:
$91,738
State:
$90,930
Salary/wage: $68,631 (reported on 74.7% of returns)
Here:
$68,631
State:
$72,104
(% of AGI for various income ranges: 1338.8% for AGIs below $25k, 3778.3% for AGIs $25k-50k, 6708.5% for AGIs $50k-75k, 10095.0% for AGIs $75k-100k, 17945.7% for AGIs $100k-200k, 88513.3% for AGIs over 200k)
Taxable interest for individuals: $1,257 (reported on 53.7% of returns)
This zip code:
$1,257
New York:
$3,075
(% of AGI for various income ranges: 31.2% for AGIs below $25k, 30.4% for AGIs $25k-50k, 73.8% for AGIs $50k-75k, 65.0% for AGIs $75k-100k, 95.7% for AGIs $100k-200k, 2150.0% for AGIs over 200k)
Ordinary dividends: $7,619 (reported on 29.6% of returns)
Here:
$7,619
State:
$11,095
(% of AGI for various income ranges: 65.4% for AGIs below $25k, 72.9% for AGIs $25k-50k, 176.2% for AGIs $50k-75k, 172.0% for AGIs $75k-100k, 728.6% for AGIs $100k-200k, 6303.3% for AGIs over 200k)
Net capital gain/loss in AGI: +$34,854 (reported on 22.8% of returns)
Here:
+$34,854
State:
+$44,925
(% of AGI for various income ranges: 9.6% for AGIs below $25k, 80.8% for AGIs $25k-50k, 253.8% for AGIs $50k-75k, 302.0% for AGIs $75k-100k, 1262.9% for AGIs $100k-200k, 34256.7% for AGIs over 200k)
Profit/loss from business: +$17,116 (reported on 22.8% of returns)
Here:
+$17,116
State:
+$14,940
(% of AGI for various income ranges: 216.9% for AGIs below $25k, 362.1% for AGIs $25k-50k, 679.2% for AGIs $50k-75k, 535.0% for AGIs $75k-100k, 1232.9% for AGIs $100k-200k, 5853.3% for AGIs over 200k)
Taxable individual retirement arrangement distribution: $20,053 (reported on 11.7% of returns)
12075:
$20,053
New York:
$19,609
(% of AGI for various income ranges: 92.3% for AGIs below $25k, 95.0% for AGIs $25k-50k, 352.3% for AGIs $50k-75k, 609.0% for AGIs $75k-100k, 1625.0% for AGIs $100k-200k)
Self-employed (Keogh) retirement plans: $16,433 (reported on 1.9% of returns)
12075:
$16,433
New York:
$32,497
(% of AGI for various income ranges: 352.1% for AGIs $100k-200k)
Total itemized deductions: $35,359 (reported on 10.5% of returns)
Here:
$35,359
State:
$39,326
(% of AGI for various income ranges: 198.1% for AGIs below $25k, 520.0% for AGIs $50k-75k, 612.0% for AGIs $75k-100k, 1005.0% for AGIs $100k-200k, 9336.7% for AGIs over 200k)
Charity contributions: $9,438 (reported on 8.0% of returns)
Here:
$9,438
State:
$15,420
(% of AGI for various income ranges: 17.7% for AGIs below $25k, 107.7% for AGIs $50k-75k, 248.6% for AGIs $100k-200k, 2310.0% for AGIs over 200k)
Taxes paid: $8,676 (reported on 10.5% of returns)
12075:
$8,676
State:
$9,183
(% of AGI for various income ranges: 68.1% for AGIs below $25k, 106.2% for AGIs $50k-75k, 208.0% for AGIs $75k-100k, 328.6% for AGIs $100k-200k, 1640.0% for AGIs over 200k)
Earned income credit: $1,782 (reported on 10.5% of returns)
Here:
$1,782
State:
$2,138
(% of AGI for various income ranges: 63.1% for AGIs below $25k, 57.9% for AGIs $25k-50k)
Percentage of individuals using paid preparers for their 2020 taxes: 95.1%
Here:
95%
State:
95%
(% for various income ranges: 93.5% for AGIs below $25k, 94.4% for AGIs $25k-50k, 95.5% for AGIs $50k-75k, 94.4% for AGIs $75k-100k, 96.6% for AGIs $100k-200k, 100.0% for AGIs over 200k)
Averages for the 2012 tax year for zip code 12075, filed in 2013:
Average Adjusted Gross Income (AGI) in 2012: $66,560 (Individual Income Tax Returns)
Here:
$66,560
State:
$77,088
Salary/wage: $53,171 (reported on 79.9% of returns)
Here:
$53,171
State:
$60,593
(% of AGI for various income ranges: 69.3% for AGIs below $25k, 72.0% for AGIs $25k-50k, 71.6% for AGIs $50k-75k, 64.8% for AGIs $75k-100k, 70.9% for AGIs $100k-200k, 46.4% for AGIs over 200k)
Taxable interest for individuals: $1,118 (reported on 49.7% of returns)
This zip code:
$1,118
New York:
$3,125
(% of AGI for various income ranges: 1.2% for AGIs below $25k, 1.1% for AGIs $25k-50k, 1.2% for AGIs $50k-75k, 0.7% for AGIs $75k-100k, 0.8% for AGIs $100k-200k, 0.6% for AGIs over 200k)
Ordinary dividends: $5,459 (reported on 29.5% of returns)
Here:
$5,459
State:
$10,299
(% of AGI for various income ranges: 2.2% for AGIs below $25k, 2.8% for AGIs $25k-50k, 2.2% for AGIs $50k-75k, 2.9% for AGIs $75k-100k, 2.3% for AGIs $100k-200k, 2.3% for AGIs over 200k)
Net capital gain/loss in AGI: +$9,457 (reported on 18.8% of returns)
Here:
+$9,457
State:
+$42,474
(% of AGI for various income ranges: 1.4% for AGIs $50k-75k, 1.3% for AGIs $75k-100k, 0.6% for AGIs $100k-200k, 8.2% for AGIs over 200k)
Profit/loss from business: +$15,571 (reported on 22.8% of returns)
Here:
+$15,571
State:
+$16,168
(% of AGI for various income ranges: 13.4% for AGIs below $25k, 6.1% for AGIs $25k-50k, 5.6% for AGIs $50k-75k, 1.8% for AGIs $75k-100k, 9.5% for AGIs $100k-200k)
Taxable individual retirement arrangement distribution: $12,250 (reported on 10.7% of returns)
12075:
$12,250
New York:
$17,621
(% of AGI for various income ranges: 2.6% for AGIs below $25k, 2.9% for AGIs $25k-50k, 1.2% for AGIs $50k-75k, 2.5% for AGIs $75k-100k, 3.4% for AGIs $100k-200k)
Self-employment retirement plans: $18,850 (reported on 1.3% of returns)
12075:
$18,850
New York:
$27,330
Total itemized deductions: $25,653 (21% of AGI, reported on 38.3% of returns)
Here:
$25,653
State:
$34,985
Here:
20.9% of AGI
State:
21.3% of AGI
(% of AGI for various income ranges: 12.3% for AGIs below $25k, 12.6% for AGIs $25k-50k, 14.9% for AGIs $50k-75k, 14.4% for AGIs $75k-100k, 16.5% for AGIs $100k-200k, 14.4% for AGIs over 200k)
Charity contributions: $2,874 (reported on 31.5% of returns)
Here:
$2,874
State:
$5,572
(% of AGI for various income ranges: 1.0% for AGIs below $25k, 0.9% for AGIs $25k-50k, 1.2% for AGIs $50k-75k, 1.2% for AGIs $75k-100k, 1.4% for AGIs $100k-200k, 1.8% for AGIs over 200k)
Taxes paid: $12,758 (reported on 38.3% of returns)
12075:
$12,758
State:
$18,656
(% of AGI for various income ranges: 4.4% for AGIs below $25k, 4.4% for AGIs $25k-50k, 5.8% for AGIs $50k-75k, 6.7% for AGIs $75k-100k, 9.0% for AGIs $100k-200k, 8.5% for AGIs over 200k)
Earned income credit: $1,944 (reported on 12.1% of returns)
Here:
$1,944
State:
$2,230
(% of AGI for various income ranges: 4.1% for AGIs below $25k, 0.9% for AGIs $25k-50k)
Percentage of individuals using paid preparers for their 2012 taxes: 64.4%
Here:
64%
State:
66%
(% for various income ranges: 55.8% for AGIs below $25k, 59.4% for AGIs $25k-50k, 69.6% for AGIs $50k-75k, 73.3% for AGIs $75k-100k, 72.7% for AGIs $100k-200k, 100.0% for AGIs over 200k)
Averages for the 2004 tax year for zip code 12075, filed in 2005:
Average Adjusted Gross Income (AGI) in 2004: $47,415 (Individual Income Tax Returns)
Here:
$47,415
State:
$59,519
Salary/wage: $40,336 (reported on 79.5% of returns)
Here:
$40,336
State:
$50,673
(% of AGI for various income ranges: 105.6% for AGIs below $10k, 63.7% for AGIs $10k-25k, 75.7% for AGIs $25k-50k, 75.5% for AGIs $50k-75k, 80.6% for AGIs $75k-100k, 52.4% for AGIs over 100k)
Taxable interest for individuals: $1,227 (reported on 64.4% of returns)
This zip code:
$1,227
New York:
$2,377
(% of AGI for various income ranges: 8.1% for AGIs below $10k, 3.0% for AGIs $10k-25k, 1.3% for AGIs $25k-50k, 1.3% for AGIs $50k-75k, 1.4% for AGIs $75k-100k, 1.6% for AGIs over 100k)
Taxable dividends: $2,697 (reported on 36.5% of returns)
Here:
$2,697
State:
$5,394
(% of AGI for various income ranges: 7.5% for AGIs below $10k, 2.7% for AGIs $10k-25k, 1.9% for AGIs $25k-50k, 1.8% for AGIs $50k-75k, 1.5% for AGIs $75k-100k, 2.3% for AGIs over 100k)
Net capital gain/loss: +$8,756 (reported on 24.8% of returns)
Here:
+$8,756
State:
+$23,581
(% of AGI for various income ranges: -5.2% for AGIs below $10k, 0.7% for AGIs $10k-25k, 0.2% for AGIs $25k-50k, 0.3% for AGIs $50k-75k, 1.6% for AGIs $75k-100k, 11.7% for AGIs over 100k)
Profit/loss from business: +$13,605 (reported on 21.9% of returns)
Here:
+$13,605
State:
+$13,809
(% of AGI for various income ranges: 18.9% for AGIs below $10k, 14.9% for AGIs $10k-25k, 7.6% for AGIs $25k-50k, 3.7% for AGIs $50k-75k, 3.9% for AGIs $75k-100k, 5.8% for AGIs over 100k)
IRA payment deduction: $3,830 (reported on 3.3% of returns)
12075:
$3,830
New York:
$3,115
Self-employed pension: $13,286 (reported on 1.5% of returns)
Here:
$13,286
New York:
$19,016
Total itemized deductions: $19,801 (23% of AGI, reported on 36.4% of returns)
Here:
$19,801
State:
$25,864
Here:
22.6% of AGI
State:
21.9% of AGI
(% of AGI for various income ranges: 20.4% for AGIs below $10k, 11.6% for AGIs $10k-25k, 11.2% for AGIs $25k-50k, 15.4% for AGIs $50k-75k, 15.9% for AGIs $75k-100k, 17.3% for AGIs over 100k)
Charity contributions deductions: $2,834 (3% of AGI, reported on 33.8% of returns)
Here:
$2,834
State:
$4,439
Here:
3.2% of AGI
State:
3.6% of AGI
(% of AGI for various income ranges: 1.0% for AGIs below $10k, 0.6% for AGIs $10k-25k, 0.9% for AGIs $25k-50k, 1.6% for AGIs $50k-75k, 1.7% for AGIs $75k-100k, 3.3% for AGIs over 100k)
Total tax: $6,665 (reported on 79.5% of returns)
12075:
$6,665
State:
$11,730
(% of AGI for various income ranges: 5.4% for AGIs below $10k, 5.9% for AGIs $10k-25k, 7.4% for AGIs $25k-50k, 8.5% for AGIs $50k-75k, 9.7% for AGIs $75k-100k, 16.6% for AGIs over 100k)
Earned income credit: $1,559 (reported on 11.3% of returns)
Here:
$1,559
State:
$1,757
Percentage of individuals using paid preparers for their 2004 taxes: 66.2%
Here:
66%
State:
67%
(% for various income ranges: 57.3% for AGIs below $10k, 66.1% for AGIs $10k-25k, 63.4% for AGIs $25k-50k, 75.6% for AGIs $50k-75k, 63.8% for AGIs $75k-100k, 80.7% for AGIs over 100k)
Notable locations in zip code 12075: Meadowgreens Golf Course (A), Hawthorne Valley Farm (B), Whittier Place Assisted Living Center (C), Whittier Rehabilitation and Skilled Nursing Center (D), Ghent Town Hall (E), Mellenville Volunteer Fire Company 1 (F). Display/hide their locations on the map
Churches in zip code 12075 include: Ghent Reformed Church (A), Emanuel Lutheran Church (B), Bible Baptist Church (C). Display/hide their locations on the map
Cemeteries: German Church Cemetery (1), West Ghent Cemetery (2), Snyder Cemetery (3), Columbia County Cemetery (4), Ghent Union Cemetery (5), Harlemville Cemetery (6). Display/hide their locations on the map
In group quarters: 186 (-1 institutionalized population)
Size of family households: 330 2-persons, 197 3-persons, 127 4-persons, 94 5-persons, 12 7-or-more-persons
Size of nonfamily households: 241 1-person, 113 2-persons, 8 5-persons
346 married couples with children.
58 single-parent households (33 men, 25 women).
91.5% of residents of 12075 zip code speak English at home.
1.7% of residents speak Spanish at home (90% very well, 10% well).
7.0% of residents speak other Indo-European language at home (93% very well, 6% well, 1% not well).
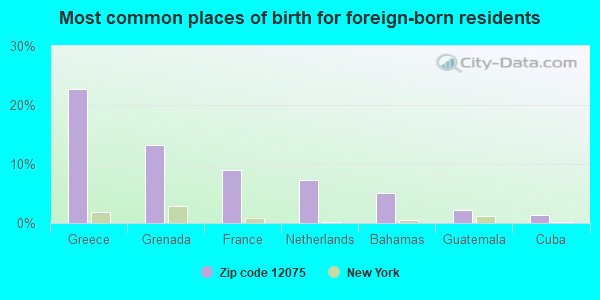
Foreign born population: 238 (7.7%) (93.6% of them are naturalized citizens)
This zip code:
7.7%
Whole state:
22.7%
23%Greece
13%Grenada
9%France
7%Netherlands
5%Bahamas
2%Guatemala
1%Cuba
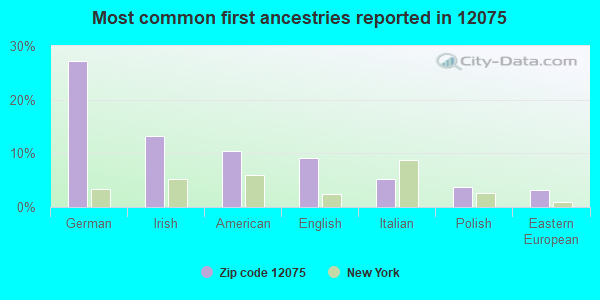
27%German
13%Irish
10%American
9%English
5%Italian
4%Polish
3%Eastern European
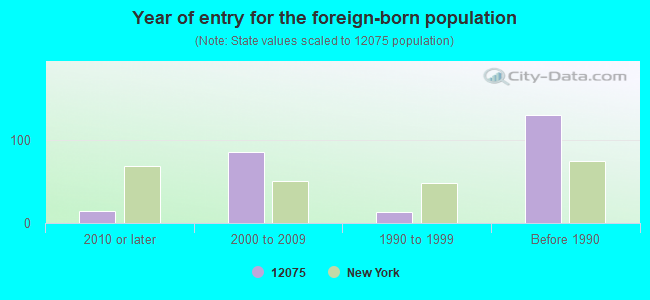
Year of entry for the foreign-born population
142010 or later
852000 to 2009
131990 to 1999
130Before 1990
Facilities with environmental interests located in this zip code:
GHENT NICE N EASY (RTE 66 & WATER ST in GHENT, NY)
(Resource Conservation and Recovery Act (tracking hazardous waste)) Organizations: VALLEY OIL CO INC (CONTACT/OPERATOR)
COLUMBIA CO COM CTR W & SD (ROUTE 66 & 9H in GHENT, NY)
National Pollutant Discharge Elimination System NON-MAJOR (Tracking pollutant discharge elimination systems) - permit Business SIC classification: SEWERAGE SYSTEMS
COLUMBIA COUNTY OF DPW BIN 3342380 (COUNTY RTE 9 OVER NORTH CREEK in GHENT, NY)
(Resource Conservation and Recovery Act (tracking hazardous waste)) Organizations: COLUMBIA CO DEPT OF PUBLIC WKS (CONTACT/OWNER)
CONNERS W GHENT AUTO WRECKING & SALVAGE (RD 1 RTE 9H in GHENT, NY)
Conditionally Exempt Small Quantity Generators, less than 100 kg/month of hazardous waste (Resource Conservation and Recovery Act (tracking hazardous waste)) - notification
Housing units lacking complete plumbing facilities: 2.2% Housing units lacking complete kitchen facilities: 4.2%
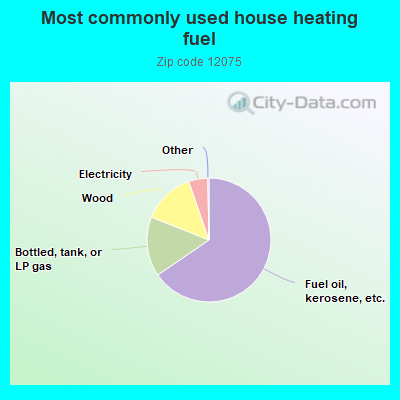
65.6%Fuel oil, kerosene, etc.
15.6%Bottled, tank, or LP gas
13.7%Wood
5.0%Electricity
Population in 1990: 2,381. Population change in the 1990s: +725 (+30.4%).
Place of birth for U.S.-born residents:
This state: 2,110
Northeast: 446
Midwest: 141
South: 60
West: 98
63% of the 12075 zip code residents lived in the same house 5 years ago. Out of people who lived in different houses, 61% lived in this county. Out of people who lived in different counties, 50% lived in New York.
95% of the 12075 zip code residents lived in the same house 1 year ago. Out of people who lived in different houses, 59% moved from different county within same state. Out of people who lived in different houses, 28% moved from different state. Out of people who lived in different houses, 14% moved from abroad.
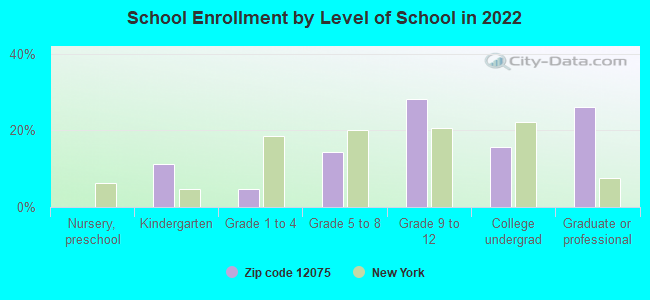
Private vs. public school enrollment:
Students in private schools in grades 1 to 8 (elementary and middle school): 56
Here:
56.7%
New York:
15.6%
Students in private schools in grades 9 to 12 (high school): 46
Here:
32.4%
New York:
15.0%
Students in private undergraduate colleges:
Here:
0.0%
New York:
39.2%
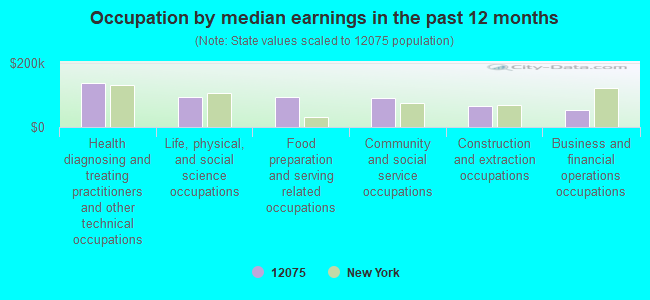
Occupation by median earnings in the past 12 months ($)
137,696Health diagnosing and treating practitioners and other technical occupations
94,745Life, physical, and social science occupations
92,810Food preparation and serving related occupations
91,517Community and social service occupations
66,194Construction and extraction occupations
53,744Business and financial operations occupations
Top industries in this zip code by the number of employees in 2005:
Health Care and Social Assistance: Nursing Care Facilities (100-249 employees: 1 establishment)
Educational Services: Elementary and Secondary Schools (100-249: 1)
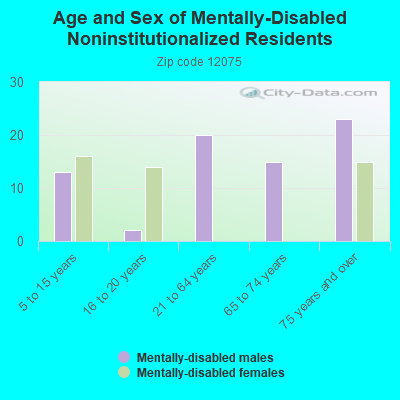
Health Care and Social Assistance: Residential Mental Retardation Facilities (50-99: 1)
Wholesale Trade: Recyclable Material Merchant Wholesalers (20-49: 1)
Health Care and Social Assistance: Kidney Dialysis Centers (20-49: 1)
Construction: New Single-Family Housing Construction (except Operative Builders) (10-19: 1, 1-4: 4)
Accommodation and Food Services: Limited-Service Restaurants (10-19: 1, 1-4: 1)
Construction: Plumbing, Heating, and Air-Conditioning Contractors (5-9: 2, 1-4: 1)
People in group quarters in 2010:
160 people in nursing facilities/skilled-nursing facilities
5 people in workers' group living quarters and job corps centers
2 people in group homes intended for adults
People in group quarters in 2000:
195 people in nursing homes
3 people in homes for the mentally retarded
Fatal accident statistics in 2014:
Fatal accident count: 1
Vehicles involved in fatal accidents: 2
Fatal accidents caused by drunken drivers: 2
Fatalities: 1
Persons involved in fatal accidents: 4
Pedestrians involved in fatal accidents: 0
Fatal accident statistics in 2011:
Fatal accident count: 1
Vehicles involved in fatal accidents: 1
Fatal accidents caused by drunken drivers: 1
Fatalities: 1
Persons involved in fatal accidents: 1
Pedestrians involved in fatal accidents: 0
2002 - 2018 National Fire Incident Reporting System (NFIRS) incidents
According to the data from the years 2002 - 2018 the average number of fires per year is 15. The highest number of reported fires - 22 took place in 2010, and the least - 5 in 2007. The data has an increasing trend.
When looking into fire subcategories, the most reports belonged to: Structure Fires (56.3%), and Outside Fires (22.3%).
Fire incident types reported to NFIRS in Zip Code 12075

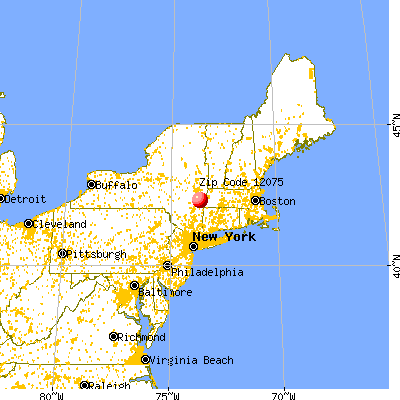


 Nearest zip codes: 12565, 12037, 12172, 12530, 12174, 12106.


 According to the data from the years 2002 - 2018 the average number of fires per year is 15. The highest number of reported fires - 22 took place in 2010, and the least - 5 in 2007. The data has an increasing trend.
 When looking into fire subcategories, the most reports belonged to: Structure Fires (56.3%), and Outside Fires (22.3%).