Estimated zip code population in 2022: 1,329 Zip code population in 2010: 1,920 Zip code population in 2000: 1,807
Houses and condos: 947 Renter-occupied apartments: 91
% of renters here:
16%
State:
46%
March 2022 cost of living index in zip code 12116: 93.9 (less than average, U.S. average is 100)
Land area: 38.5 sq. mi. Water area: 0.8 sq. mi.
Population density: 35 people per square mile
(very low).
OSM Map
General Map
Google Map
MSN Map
OSM Map
General Map
Google Map
MSN Map
OSM Map
General Map
Google Map
MSN Map
OSM Map
General Map
Google Map
MSN Map
Please wait while loading the map...
Real estate property taxes paid for housing units in 2022:
This zip code:
1.8% ($2,333)
New York:
1.5% ($6,180)
Median real estate property taxes paid for housing units with mortgages in 2022: $2,512 (1.9%) Median real estate property taxes paid for housing units with no mortgage in 2022: $2,066 (1.7%)
Business Search- 14 Million verified businesses
Males: 541
(40.7%)
Females: 788
(59.3%)
For population 25 years and over in 12116:
High school or higher: 95.8%
Bachelor's degree or higher: 29.4%
Graduate or professional degree: 10.6%
Unemployed: 2.6%
Mean travel time to work (commute): 25.4 minutes
For population 15 years and over in 12116:
Never married: 27.1%
Now married: 50.5%
Separated: 0.5%
Widowed: 8.7%
Divorced: 13.1%
Zip code 12116 compared to state average:
Median house value significantly below state average.
Unemployed percentage below state average.
Black race population percentage significantly below state average.
Hispanic race population percentage significantly below state average.
Median age significantly above state average.
Foreign-born population percentage significantly below state average.
Renting percentage significantly below state average.
Length of stay since moving in significantly above state average.
Estimated median house/condo value in 2022: $129,471
12116:
$129,471
New York:
$400,400
According to our research of New York and other state lists, there were 2 registered sex offenders living in 12116 zip code as of May 30, 2024. The ratio of all residents to sex offenders in zip code 12116 is 964 to 1. The ratio of registered sex offenders to all residents in this zip code is near the state average.
Median resident age:
This zip code:
48.4 years
New York median age:
40.0 years
Average household size:
This zip code:
2.3 people
New York:
2.5 people
Averages for the 2020 tax year for zip code 12116, filed in 2021:
Average Adjusted Gross Income (AGI) in 2020: $54,319 (Individual Income Tax Returns)
Here:
$54,319
State:
$90,930
Salary/wage: $45,667 (reported on 79.5% of returns)
Here:
$45,667
State:
$72,104
(% of AGI for various income ranges: 1105.6% for AGIs below $25k, 3147.5% for AGIs $25k-50k, 6234.4% for AGIs $50k-75k, 7680.0% for AGIs $75k-100k, 19393.3% for AGIs $100k-200k)
Taxable interest for individuals: $750 (reported on 33.7% of returns)
This zip code:
$750
New York:
$3,075
(% of AGI for various income ranges: 15.6% for AGIs below $25k, 10.5% for AGIs $25k-50k, 56.7% for AGIs $50k-75k, 75.0% for AGIs $75k-100k, 108.3% for AGIs $100k-200k)
Ordinary dividends: $2,606 (reported on 20.5% of returns)
Here:
$2,606
State:
$11,095
(% of AGI for various income ranges: 13.9% for AGIs below $25k, 40.0% for AGIs $25k-50k, 52.2% for AGIs $50k-75k, 180.0% for AGIs $75k-100k, 305.0% for AGIs $100k-200k)
Net capital gain/loss in AGI: +$3,764 (reported on 16.9% of returns)
Here:
+$3,764
State:
+$44,925
(% of AGI for various income ranges: 1.1% for AGIs below $25k, 37.0% for AGIs $25k-50k, 52.2% for AGIs $50k-75k, 306.7% for AGIs $75k-100k, 366.7% for AGIs $100k-200k)
Profit/loss from business: +$8,042 (reported on 14.5% of returns)
Here:
+$8,042
State:
+$14,940
(% of AGI for various income ranges: 114.4% for AGIs below $25k, 137.5% for AGIs $25k-50k, 161.1% for AGIs $50k-75k, 565.0% for AGIs $100k-200k)
Taxable individual retirement arrangement distribution: $15,560 (reported on 12.0% of returns)
12116:
$15,560
New York:
$19,609
(% of AGI for various income ranges: 123.9% for AGIs below $25k, 374.4% for AGIs $50k-75k, 1660.0% for AGIs $75k-100k)
Earned income credit: $2,183 (reported on 14.5% of returns)
Here:
$2,183
State:
$2,138
(% of AGI for various income ranges: 85.0% for AGIs below $25k, 54.5% for AGIs $25k-50k)
Percentage of individuals using paid preparers for their 2020 taxes: 96.4%
Here:
96%
State:
95%
(% for various income ranges: 95.8% for AGIs below $25k, 100.0% for AGIs $25k-50k, 92.9% for AGIs $50k-75k, 88.9% for AGIs $75k-100k, 100.0% for AGIs $100k-200k)
Averages for the 2012 tax year for zip code 12116, filed in 2013:
Average Adjusted Gross Income (AGI) in 2012: $43,226 (Individual Income Tax Returns)
Here:
$43,226
State:
$77,088
Salary/wage: $37,664 (reported on 81.5% of returns)
Here:
$37,664
State:
$60,593
(% of AGI for various income ranges: 71.5% for AGIs below $25k, 82.0% for AGIs $25k-50k, 65.9% for AGIs $50k-75k, 80.2% for AGIs $75k-100k, 61.1% for AGIs $100k-200k)
Taxable interest for individuals: $1,100 (reported on 37.0% of returns)
This zip code:
$1,100
New York:
$3,125
(% of AGI for various income ranges: 1.4% for AGIs below $25k, 0.4% for AGIs $25k-50k, 0.7% for AGIs $50k-75k, 0.4% for AGIs $75k-100k, 1.7% for AGIs $100k-200k)
Ordinary dividends: $1,622 (reported on 22.2% of returns)
Here:
$1,622
State:
$10,299
(% of AGI for various income ranges: 2.6% for AGIs below $25k, 0.5% for AGIs $25k-50k, 0.4% for AGIs $50k-75k, 0.5% for AGIs $75k-100k, 0.8% for AGIs $100k-200k)
Net capital gain/loss in AGI: +$3,160 (reported on 12.3% of returns)
Here:
+$3,160
State:
+$42,474
(% of AGI for various income ranges: 0.6% for AGIs below $25k, 1.6% for AGIs $50k-75k, 1.7% for AGIs $100k-200k)
Profit/loss from business: +$5,800 (reported on 16.0% of returns)
Here:
+$5,800
State:
+$16,168
(% of AGI for various income ranges: 5.7% for AGIs below $25k, 1.2% for AGIs $25k-50k, 2.3% for AGIs $50k-75k, 4.2% for AGIs $75k-100k)
Taxable individual retirement arrangement distribution: $10,300 (reported on 11.1% of returns)
12116:
$10,300
New York:
$17,621
(% of AGI for various income ranges: 3.0% for AGIs below $25k, 2.1% for AGIs $25k-50k, 3.9% for AGIs $50k-75k, 5.9% for AGIs $75k-100k)
Total itemized deductions: $17,513 (20% of AGI, reported on 18.5% of returns)
Here:
$17,513
State:
$34,985
Here:
20.1% of AGI
State:
21.3% of AGI
(% of AGI for various income ranges: 6.4% for AGIs below $25k, 4.4% for AGIs $25k-50k, 5.7% for AGIs $50k-75k, 11.2% for AGIs $75k-100k, 9.7% for AGIs $100k-200k)
Charity contributions: $1,950 (reported on 12.3% of returns)
Here:
$1,950
State:
$5,572
(% of AGI for various income ranges: 0.7% for AGIs below $25k, 0.9% for AGIs $50k-75k, 0.9% for AGIs $100k-200k)
Taxes paid: $7,967 (reported on 18.5% of returns)
12116:
$7,967
State:
$18,656
(% of AGI for various income ranges: 1.9% for AGIs below $25k, 1.7% for AGIs $25k-50k, 2.2% for AGIs $50k-75k, 4.4% for AGIs $75k-100k, 5.8% for AGIs $100k-200k)
Earned income credit: $1,900 (reported on 21.0% of returns)
Here:
$1,900
State:
$2,230
(% of AGI for various income ranges: 5.3% for AGIs below $25k, 1.2% for AGIs $25k-50k)
Percentage of individuals using paid preparers for their 2012 taxes: 51.9%
Here:
52%
State:
66%
(% for various income ranges: 47.1% for AGIs below $25k, 42.9% for AGIs $25k-50k, 61.5% for AGIs $50k-75k, 57.1% for AGIs $75k-100k, 83.3% for AGIs $100k-200k)
Averages for the 2004 tax year for zip code 12116, filed in 2005:
Average Adjusted Gross Income (AGI) in 2004: $33,542 (Individual Income Tax Returns)
Here:
$33,542
State:
$59,519
Salary/wage: $32,149 (reported on 82.6% of returns)
Here:
$32,149
State:
$50,673
(% of AGI for various income ranges: 90.9% for AGIs below $10k, 73.1% for AGIs $10k-25k, 80.5% for AGIs $25k-50k, 81.9% for AGIs $50k-75k, 81.7% for AGIs $75k-100k, 74.6% for AGIs over 100k)
Taxable interest for individuals: $1,199 (reported on 47.2% of returns)
This zip code:
$1,199
New York:
$2,377
(% of AGI for various income ranges: 4.4% for AGIs below $10k, 3.5% for AGIs $10k-25k, 1.5% for AGIs $25k-50k, 0.8% for AGIs $50k-75k, 0.7% for AGIs $75k-100k, 1.9% for AGIs over 100k)
Taxable dividends: $1,632 (reported on 23.7% of returns)
Here:
$1,632
State:
$5,394
(% of AGI for various income ranges: 3.5% for AGIs below $10k, 1.6% for AGIs $10k-25k, 0.6% for AGIs $25k-50k, 0.6% for AGIs $50k-75k, 0.5% for AGIs $75k-100k, 2.6% for AGIs over 100k)
Net capital gain/loss: +$1,394 (reported on 15.3% of returns)
Here:
+$1,394
State:
+$23,581
(% of AGI for various income ranges: 1.3% for AGIs below $10k, 1.1% for AGIs $10k-25k, 1.5% for AGIs $25k-50k, 0.3% for AGIs $50k-75k, -0.3% for AGIs $75k-100k, -0.2% for AGIs over 100k)
Profit/loss from business: +$2,849 (reported on 14.6% of returns)
Here:
+$2,849
State:
+$13,809
(% of AGI for various income ranges: 0.8% for AGIs below $10k, 5.1% for AGIs $10k-25k, 0.4% for AGIs $25k-50k, 0.8% for AGIs $50k-75k, 0.8% for AGIs over 100k)
IRA payment deduction: $2,921 (reported on 4.4% of returns)
12116:
$2,921
New York:
$3,115
Total itemized deductions: $14,109 (22% of AGI, reported on 20.3% of returns)
Here:
$14,109
State:
$25,864
Here:
21.6% of AGI
State:
21.9% of AGI
(% of AGI for various income ranges: 7.6% for AGIs $10k-25k, 6.1% for AGIs $25k-50k, 9.7% for AGIs $50k-75k, 11.4% for AGIs $75k-100k, 11.1% for AGIs over 100k)
Charity contributions deductions: $1,710 (2% of AGI, reported on 16.0% of returns)
Here:
$1,710
State:
$4,439
Here:
2.4% of AGI
State:
3.6% of AGI
(% of AGI for various income ranges: 0.4% for AGIs $10k-25k, 0.3% for AGIs $25k-50k, 1.0% for AGIs $50k-75k, 1.2% for AGIs $75k-100k, 1.6% for AGIs over 100k)
Total tax: $3,959 (reported on 74.2% of returns)
12116:
$3,959
State:
$11,730
(% of AGI for various income ranges: 2.8% for AGIs below $10k, 4.6% for AGIs $10k-25k, 6.5% for AGIs $25k-50k, 8.2% for AGIs $50k-75k, 10.4% for AGIs $75k-100k, 17.2% for AGIs over 100k)
Earned income credit: $1,689 (reported on 15.7% of returns)
Here:
$1,689
State:
$1,757
Percentage of individuals using paid preparers for their 2004 taxes: 55.2%
Here:
55%
State:
67%
(% for various income ranges: 50.0% for AGIs below $10k, 50.2% for AGIs $10k-25k, 57.5% for AGIs $25k-50k, 63.2% for AGIs $50k-75k, 63.4% for AGIs $75k-100k, 69.7% for AGIs over 100k)
Household received Food Stamps/SNAP in the past 12 months: 98 Household did not receive Food Stamps/SNAP in the past 12 months: 488
Women who had a birth in the past 12 months: 1 (1 now married, 0 unmarried) Women who did not have a birth in the past 12 months: 298 (99 now married, 199 unmarried)
Housing units in zip code 12116 with a mortgage: 236 (49 second mortgage, 40 both second mortgage and home equity loan) Houses without a mortgage: 15
Median monthly owner costs for units with a mortgage: $1,304 Median monthly owner costs for units without a mortgage: $480
Residents with income below the poverty level in 2022:
This zip code:
8.0%
Whole state:
14.3%
Residents with income below 50% of the poverty level in 2022:
This zip code:
2.1%
Whole state:
6.8%
Median number of rooms in houses and condos:
Here:
5.8
State:
6.3
Median number of rooms in apartments:
Here:
5.5
State:
3.8
Notable locations in this zip code not listed on our city pages
Size of family households: 222 2-persons, 70 3-persons, 62 4-persons, 24 5-persons, 9 6-persons
Size of nonfamily households: 156 1-person, 35 2-persons, 5 3-persons
128 married couples with children.
117 single-parent households (24 men, 93 women).
99.1% of residents of 12116 zip code speak English at home.
0.9% of residents speak Spanish at home (100% very well).
0.3% of residents speak other Indo-European language at home (100% very well).
Foreign born population: 29 (2.2%) (54.6% of them are naturalized citizens)
This zip code:
2.2%
Whole state:
22.7%
62%France
14%Denmark
26%European
25%Italian
11%English
7%German
7%American
5%Polish
4%Scottish
Year of entry for the foreign-born population
02010 or later
02000 to 2009
01990 to 1999
37Before 1990
Housing units lacking complete plumbing facilities: 6.5% Housing units lacking complete kitchen facilities: 10.4%
38.3%Fuel oil, kerosene, etc.
36.1%Bottled, tank, or LP gas
13.8%Wood
8.2%Electricity
2.1%Other fuel
1.6%No fuel used
Population in 1990: 871. Population change in the 1990s: +936 (+107.5%).
Place of birth for U.S.-born residents:
This state: 1,100
Northeast: 112
Midwest: 16
South: 43
West: 12
70% of the 12116 zip code residents lived in the same house 5 years ago. Out of people who lived in different houses, 59% lived in this county. Out of people who lived in different counties, 50% lived in New York.
92% of the 12116 zip code residents lived in the same house 1 year ago. Out of people who lived in different houses, 42% moved from this county. Out of people who lived in different houses, 57% moved from different county within same state.
Private vs. public school enrollment:
Students in private schools in grades 1 to 8 (elementary and middle school): 25
Here:
13.9%
New York:
15.6%
Students in private schools in grades 9 to 12 (high school):
Here:
0.0%
New York:
15.0%
Students in private undergraduate colleges: 12
Here:
56.1%
New York:
39.2%
Occupation by median earnings in the past 12 months ($)
169,756Business and financial operations occupations
89,288Computer and mathematical occupations
88,400Health diagnosing and treating practitioners and other technical occupations
67,316Management occupations
61,566Law enforcement workers including supervisors
49,612Education, training, and library occupations
Top industries in this zip code by the number of employees in 2005:
Administrative and Support and Waste Management and Remediation Services: Janitorial Services (10-19 employees: 1 establishment)
Accommodation and Food Services: Full-Service Restaurants (10-19: 1)
Finance and Insurance: Insurance Agencies and Brokerages (5-9: 1)
Construction: New Single-Family Housing Construction (except Operative Builders) (1-4: 2)
Other Services (except Public Administration): Religious Organizations (1-4: 1)
Administrative and Support and Waste Management and Remediation Services: Solid Waste Collection (1-4: 1)
Real Estate and Rental and Leasing: Lessors of Residential Buildings and Dwellings (1-4: 1)
Other Services (except Public Administration): Cemeteries and Crematories (1-4: 1)

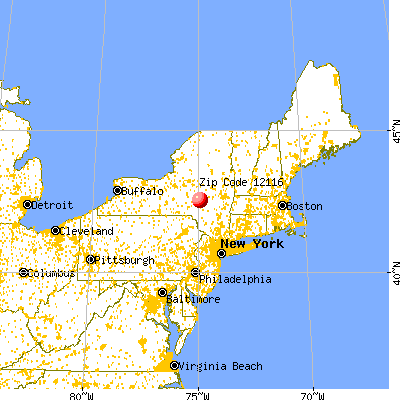


 Nearest zip codes: 13834, 13751, 13750, 13860, 12155, 13807.


