Estimated zip code population in 2022: 691 Zip code population in 2010: 814 Zip code population in 2000: 902
Houses and condos: 471 Renter-occupied apartments: 16
% of renters here:
5%
State:
46%
March 2022 cost of living index in zip code 12153: 94.2 (less than average, U.S. average is 100)
Land area: 18.0 sq. mi. Water area: 0.1 sq. mi.
Population density: 38 people per square mile
(very low).
OSM Map
General Map
Google Map
MSN Map
OSM Map
General Map
Google Map
MSN Map
OSM Map
General Map
Google Map
MSN Map
OSM Map
General Map
Google Map
MSN Map
Please wait while loading the map...
Real estate property taxes paid for housing units in 2022:
This zip code:
2.4% ($7,243)
New York:
1.5% ($6,180)
Median real estate property taxes paid for housing units with mortgages in 2022: $8,625 (2.1%) Median real estate property taxes paid for housing units with no mortgage in 2022: $5,704 (2.4%)
Business Search- 14 Million verified businesses
Males: 383
(55.5%)
Females: 307
(44.5%)
For population 25 years and over in 12153:
High school or higher: 88.9%
Bachelor's degree or higher: 23.1%
Graduate or professional degree: 8.2%
Unemployed: 4.4%
Mean travel time to work (commute): 26.4 minutes
For population 15 years and over in 12153:
Never married: 8.5%
Now married: 76.6%
Separated: 3.0%
Widowed: 5.5%
Divorced: 6.4%
Zip code 12153 compared to state average:
Black race population percentage significantly below state average.
Hispanic race population percentage significantly below state average.
Median age significantly above state average.
Foreign-born population percentage significantly below state average.
Renting percentage significantly below state average.
Length of stay since moving in significantly below state average.
Number of rooms per house above state average.
Number of college students significantly below state average.
Percentage of population with a bachelor's degree or higher below state average.
Estimated median house/condo value in 2022: $298,450
12153:
$298,450
New York:
$400,400
Median resident age:
This zip code:
52.5 years
New York median age:
40.0 years
Average household size:
This zip code:
2.2 people
New York:
2.5 people
Averages for the 2020 tax year for zip code 12153, filed in 2021:
Average Adjusted Gross Income (AGI) in 2020: $76,232 (Individual Income Tax Returns)
Here:
$76,232
State:
$90,930
Salary/wage: $70,971 (reported on 74.5% of returns)
Here:
$70,971
State:
$72,104
(% of AGI for various income ranges: 925.0% for AGIs below $25k, 3685.7% for AGIs $25k-50k, 5568.3% for AGIs $50k-75k, 10130.0% for AGIs $75k-100k, 20445.7% for AGIs $100k-200k)
Taxable interest for individuals: $474 (reported on 48.9% of returns)
This zip code:
$474
New York:
$3,075
(% of AGI for various income ranges: 11.7% for AGIs below $25k, 8.6% for AGIs $25k-50k, 73.3% for AGIs $50k-75k, 10.0% for AGIs $75k-100k, 68.6% for AGIs $100k-200k)
Ordinary dividends: $2,275 (reported on 25.5% of returns)
Here:
$2,275
State:
$11,095
(% of AGI for various income ranges: 138.3% for AGIs below $25k, 143.3% for AGIs $50k-75k, 148.6% for AGIs $100k-200k)
Net capital gain/loss in AGI: +$3,600 (reported on 17.0% of returns)
Here:
+$3,600
State:
+$44,925
(% of AGI for various income ranges: 1.7% for AGIs below $25k, 145.0% for AGIs $50k-75k, 285.7% for AGIs $100k-200k)
Profit/loss from business: +$9,371 (reported on 14.9% of returns)
Here:
+$9,371
State:
+$14,940
(% of AGI for various income ranges: 221.4% for AGIs $25k-50k, 715.7% for AGIs $100k-200k)
Taxable individual retirement arrangement distribution: $12,133 (reported on 12.8% of returns)
12153:
$12,133
New York:
$19,609
(% of AGI for various income ranges: 500.0% for AGIs $25k-50k, 945.0% for AGIs $75k-100k)
Total itemized deductions: $16,525 (reported on 8.5% of returns)
Here:
$16,525
State:
$39,326
(% of AGI for various income ranges: 1652.5% for AGIs $75k-100k)
Taxes paid: $8,150 (reported on 8.5% of returns)
12153:
$8,150
State:
$9,183
(% of AGI for various income ranges: 815.0% for AGIs $75k-100k)
Earned income credit: $1,500 (reported on 6.4% of returns)
Here:
$1,500
State:
$2,138
(% of AGI for various income ranges: 75.0% for AGIs below $25k)
Percentage of individuals using paid preparers for their 2020 taxes: 91.5%
Here:
91%
State:
95%
(% for various income ranges: 90.0% for AGIs below $25k, 90.0% for AGIs $25k-50k, 87.5% for AGIs $50k-75k, 85.7% for AGIs $75k-100k, 100.0% for AGIs $100k-200k, 100.0% for AGIs over 200k)
Averages for the 2012 tax year for zip code 12153, filed in 2013:
Average Adjusted Gross Income (AGI) in 2012: $59,404 (Individual Income Tax Returns)
Here:
$59,404
State:
$77,088
Salary/wage: $52,882 (reported on 81.2% of returns)
Here:
$52,882
State:
$60,593
(% of AGI for various income ranges: 60.2% for AGIs below $25k, 73.6% for AGIs $25k-50k, 74.7% for AGIs $50k-75k, 76.6% for AGIs $75k-100k, 70.5% for AGIs $100k-200k)
Taxable interest for individuals: $361 (reported on 47.9% of returns)
This zip code:
$361
New York:
$3,125
(% of AGI for various income ranges: 0.5% for AGIs below $25k, 1.2% for AGIs $25k-50k, 0.1% for AGIs $50k-75k, 0.2% for AGIs $75k-100k, 0.1% for AGIs $100k-200k)
Ordinary dividends: $1,850 (reported on 25.0% of returns)
Here:
$1,850
State:
$10,299
(% of AGI for various income ranges: 3.1% for AGIs $25k-50k, 0.2% for AGIs $50k-75k, 0.8% for AGIs $75k-100k, 0.4% for AGIs $100k-200k)
Net capital gain/loss in AGI: +$275 (reported on 16.7% of returns)
Here:
+$275
State:
+$42,474
Profit/loss from business: +$8,600 (reported on 18.8% of returns)
Here:
+$8,600
State:
+$16,168
(% of AGI for various income ranges: 15.1% for AGIs below $25k, 1.8% for AGIs $50k-75k, 3.6% for AGIs $100k-200k)
Taxable individual retirement arrangement distribution: $10,640 (reported on 10.4% of returns)
12153:
$10,640
New York:
$17,621
Total itemized deductions: $18,936 (21% of AGI, reported on 45.8% of returns)
Here:
$18,936
State:
$34,985
Here:
20.8% of AGI
State:
21.3% of AGI
(% of AGI for various income ranges: 16.4% for AGIs $25k-50k, 13.1% for AGIs $50k-75k, 17.9% for AGIs $75k-100k, 15.0% for AGIs $100k-200k)
Charity contributions: $2,513 (reported on 31.2% of returns)
Here:
$2,513
State:
$5,572
(% of AGI for various income ranges: 1.3% for AGIs $25k-50k, 0.5% for AGIs $50k-75k, 2.1% for AGIs $75k-100k, 1.4% for AGIs $100k-200k)
Taxes paid: $9,977 (reported on 45.8% of returns)
12153:
$9,977
State:
$18,656
(% of AGI for various income ranges: 7.7% for AGIs $25k-50k, 5.8% for AGIs $50k-75k, 9.0% for AGIs $75k-100k, 8.8% for AGIs $100k-200k)
Earned income credit: $1,117 (reported on 12.5% of returns)
Here:
$1,117
State:
$2,230
(% of AGI for various income ranges: 4.0% for AGIs below $25k)
Percentage of individuals using paid preparers for their 2012 taxes: 54.2%
Here:
54%
State:
66%
(% for various income ranges: 46.7% for AGIs below $25k, 60.0% for AGIs $25k-50k, 50.0% for AGIs $50k-75k, 57.1% for AGIs $75k-100k, 62.5% for AGIs $100k-200k)
Averages for the 2004 tax year for zip code 12153, filed in 2005:
Average Adjusted Gross Income (AGI) in 2004: $46,030 (Individual Income Tax Returns)
Here:
$46,030
State:
$59,519
Salary/wage: $43,040 (reported on 86.9% of returns)
Here:
$43,040
State:
$50,673
(% of AGI for various income ranges: 78.8% for AGIs below $10k, 80.4% for AGIs $10k-25k, 82.4% for AGIs $25k-50k, 82.6% for AGIs $50k-75k, 88.6% for AGIs $75k-100k, 72.9% for AGIs over 100k)
Taxable interest for individuals: $636 (reported on 57.9% of returns)
This zip code:
$636
New York:
$2,377
(% of AGI for various income ranges: 5.8% for AGIs below $10k, 1.7% for AGIs $10k-25k, 0.4% for AGIs $25k-50k, 1.0% for AGIs $50k-75k, 0.3% for AGIs $75k-100k, 0.7% for AGIs over 100k)
Taxable dividends: $1,458 (reported on 28.7% of returns)
Here:
$1,458
State:
$5,394
(% of AGI for various income ranges: 5.8% for AGIs below $10k, 2.1% for AGIs $10k-25k, 0.8% for AGIs $25k-50k, 1.2% for AGIs $50k-75k, 0.3% for AGIs $75k-100k, 0.6% for AGIs over 100k)
Net capital gain/loss: +$2,461 (reported on 18.9% of returns)
Here:
+$2,461
State:
+$23,581
(% of AGI for various income ranges: 0.9% for AGIs $10k-25k, 1.0% for AGIs $25k-50k, 1.4% for AGIs $50k-75k, 0.4% for AGIs $75k-100k, 1.3% for AGIs over 100k)
Profit/loss from business: +$3,759 (reported on 15.3% of returns)
Here:
+$3,759
State:
+$13,809
(% of AGI for various income ranges: 7.8% for AGIs $10k-25k, 2.7% for AGIs $25k-50k, 0.7% for AGIs $50k-75k, 0.2% for AGIs $75k-100k, 0.1% for AGIs over 100k)
IRA payment deduction: $2,700 (reported on 3.7% of returns)
12153:
$2,700
New York:
$3,115
Total itemized deductions: $15,854 (20% of AGI, reported on 39.2% of returns)
Here:
$15,854
State:
$25,864
Here:
20.2% of AGI
State:
21.9% of AGI
(% of AGI for various income ranges: 33.0% for AGIs below $10k, 10.5% for AGIs $25k-50k, 15.6% for AGIs $50k-75k, 17.6% for AGIs $75k-100k, 12.2% for AGIs over 100k)
Charity contributions deductions: $2,116 (3% of AGI, reported on 35.1% of returns)
Here:
$2,116
State:
$4,439
Here:
2.7% of AGI
State:
3.6% of AGI
(% of AGI for various income ranges: 2.2% for AGIs below $10k, 1.4% for AGIs $25k-50k, 2.2% for AGIs $50k-75k, 1.7% for AGIs $75k-100k, 1.5% for AGIs over 100k)
Total tax: $6,268 (reported on 78.7% of returns)
12153:
$6,268
State:
$11,730
(% of AGI for various income ranges: 2.4% for AGIs below $10k, 5.1% for AGIs $10k-25k, 8.0% for AGIs $25k-50k, 8.7% for AGIs $50k-75k, 9.8% for AGIs $75k-100k, 17.3% for AGIs over 100k)
Earned income credit: $1,308 (reported on 7.2% of returns)
Here:
$1,308
State:
$1,757
Percentage of individuals using paid preparers for their 2004 taxes: 56.7%
Here:
57%
State:
67%
(% for various income ranges: 40.9% for AGIs below $10k, 56.1% for AGIs $10k-25k, 61.0% for AGIs $25k-50k, 60.6% for AGIs $50k-75k, 61.8% for AGIs $75k-100k, 72.1% for AGIs over 100k)
Household received Food Stamps/SNAP in the past 12 months: 19 Household did not receive Food Stamps/SNAP in the past 12 months: 286
Women who had a birth in the past 12 months: 2 (2 now married, 0 unmarried) Women who did not have a birth in the past 12 months: 84 (69 now married, 12 unmarried)
Housing units in zip code 12153 with a mortgage: 129 (3 second mortgage, 3 both second mortgage and home equity loan) Median monthly owner costs for units with a mortgage: $2,382 Median monthly owner costs for units without a mortgage: $790
Residents with income below the poverty level in 2022:
This zip code:
21.0%
Whole state:
14.3%
Residents with income below 50% of the poverty level in 2022:
This zip code:
4.7%
Whole state:
6.8%
Median number of rooms in houses and condos:
Here:
6.0
State:
6.3
Notable locations in this zip code not listed on our city pages
ANTHONY J HILL INC (120 MOSHER RD in SAND LAKE, NY)
Small Quantity Generators, between 100 kg and 1000 kg of hazardous waste/month (Resource Conservation and Recovery Act (tracking hazardous waste))
Housing units lacking complete plumbing facilities: 1.0%
44.8%Wood
39.5%Bottled, tank, or LP gas
9.6%Fuel oil, kerosene, etc.
6.6%Electricity
Population in 1990: 851. Population change in the 1990s: +51 (+6.0%).
Place of birth for U.S.-born residents:
This state: 456
Northeast: 130
Midwest: 15
South: 48
81% of the 12153 zip code residents lived in the same house 5 years ago. Out of people who lived in different houses, 49% lived in this county. Out of people who lived in different counties, 50% lived in New York.
98% of the 12153 zip code residents lived in the same house 1 year ago. Out of people who lived in different houses, 92% moved from this county.
Private vs. public school enrollment:
Students in private schools in grades 1 to 8 (elementary and middle school):
Here:
0.0%
New York:
15.6%
Students in private schools in grades 9 to 12 (high school):
Here:
0.0%
New York:
15.0%
Occupation by median earnings in the past 12 months ($)
40,181Office and administrative support occupations
39,705Sales and related occupations
9,378Management occupations
Top industries in this zip code by the number of employees in 2005:
Construction: All Other Specialty Trade Contractors (10-19 employees: 1 establishment)
Construction: New Single-Family Housing Construction (except Operative Builders) (5-9: 1)
Construction: Drywall and Insulation Contractors (1-4: 2)
Arts, Entertainment, and Recreation: Independent Artists, Writers, and Performers (1-4: 1)
Accommodation and Food Services: Drinking Places (Alcoholic Beverages) (1-4: 1)
Administrative and Support and Waste Management and Remediation Services: Landscaping Services (1-4: 1)
Professional, Scientific, and Technical Services: All Other Professional, Scientific, and Technical Services (1-4: 1)
Finance and Insurance: Direct Property and Casualty Insurance Carriers (1-4: 1)
Construction: Roofing Contractors (1-4: 1)
Home Mortgage Disclosure Act Aggregated Statistics For Year 2009 (Based on 4 partial tracts)
A) FHA, FSA/RHS & VA Home Purchase Loans
B) Conventional Home Purchase Loans
C) Refinancings
D) Home Improvement Loans
E) Loans on Dwellings For 5+ Families
F) Non-occupant Loans on < 5 Family Dwellings (A B C & D)
G) Loans On Manufactured Home Dwelling (A B C & D)
Number
Average Value
Number
Average Value
Number
Average Value
Number
Average Value
Number
Average Value
Number
Average Value
Number
Average Value
LOANS ORIGINATED
20
$168,778
29
$198,398
125
$170,993
10
$64,241
1
$208,740
3
$145,730
2
$89,335
APPLICATIONS APPROVED, NOT ACCEPTED
0
$0
2
$222,455
11
$213,744
1
$243,930
0
$0
1
$157,450
1
$20,280
APPLICATIONS DENIED
0
$0
4
$129,430
37
$193,473
13
$38,625
0
$0
1
$150,280
2
$43,575
APPLICATIONS WITHDRAWN
2
$116,675
3
$182,103
22
$155,045
1
$80,510
0
$0
2
$121,665
0
$0
FILES CLOSED FOR INCOMPLETENESS
1
$77,530
1
$99,600
5
$213,290
1
$29,820
0
$0
0
$0
0
$0
Aggregated Statistics For Year 2008 (Based on 4 partial tracts)
A) FHA, FSA/RHS & VA Home Purchase Loans
B) Conventional Home Purchase Loans
C) Refinancings
D) Home Improvement Loans
F) Non-occupant Loans on < 5 Family Dwellings (A B C & D)
G) Loans On Manufactured Home Dwelling (A B C & D)
Number
Average Value
Number
Average Value
Number
Average Value
Number
Average Value
Number
Average Value
Number
Average Value
LOANS ORIGINATED
16
$183,428
35
$188,550
74
$161,031
19
$63,931
4
$107,508
1
$98,540
APPLICATIONS APPROVED, NOT ACCEPTED
2
$115,440
7
$208,314
11
$191,979
3
$115,387
1
$136,470
1
$23,860
APPLICATIONS DENIED
1
$104,970
7
$144,740
39
$171,100
13
$60,584
2
$142,840
1
$72,720
APPLICATIONS WITHDRAWN
2
$164,080
6
$223,118
20
$191,942
3
$79,567
1
$155,060
0
$0
FILES CLOSED FOR INCOMPLETENESS
1
$57,250
2
$161,900
3
$184,030
1
$84,090
1
$66,620
0
$0
Aggregated Statistics For Year 2007 (Based on 4 partial tracts)
A) FHA, FSA/RHS & VA Home Purchase Loans
B) Conventional Home Purchase Loans
C) Refinancings
D) Home Improvement Loans
F) Non-occupant Loans on < 5 Family Dwellings (A B C & D)
G) Loans On Manufactured Home Dwelling (A B C & D)
Number
Average Value
Number
Average Value
Number
Average Value
Number
Average Value
Number
Average Value
Number
Average Value
LOANS ORIGINATED
5
$190,968
72
$181,318
81
$140,186
18
$41,695
8
$179,780
3
$42,573
APPLICATIONS APPROVED, NOT ACCEPTED
1
$224,690
7
$167,406
13
$146,270
6
$52,663
1
$466,380
1
$62,620
APPLICATIONS DENIED
2
$230,730
19
$164,578
47
$151,632
17
$32,892
4
$241,095
4
$51,760
APPLICATIONS WITHDRAWN
1
$75,740
5
$141,812
25
$156,366
4
$70,830
1
$50,230
0
$0
FILES CLOSED FOR INCOMPLETENESS
0
$0
3
$198,403
8
$211,961
2
$124,650
1
$178,920
0
$0
Aggregated Statistics For Year 2006 (Based on 4 partial tracts)
A) FHA, FSA/RHS & VA Home Purchase Loans
B) Conventional Home Purchase Loans
C) Refinancings
D) Home Improvement Loans
E) Loans on Dwellings For 5+ Families
F) Non-occupant Loans on < 5 Family Dwellings (A B C & D)
G) Loans On Manufactured Home Dwelling (A B C & D)
Number
Average Value
Number
Average Value
Number
Average Value
Number
Average Value
Number
Average Value
Number
Average Value
Number
Average Value
LOANS ORIGINATED
3
$190,653
70
$155,147
80
$138,472
21
$58,145
1
$149,100
10
$140,000
2
$58,815
APPLICATIONS APPROVED, NOT ACCEPTED
1
$189,660
12
$129,285
16
$124,276
5
$45,134
0
$0
2
$99,895
1
$71,850
APPLICATIONS DENIED
1
$72,160
8
$75,986
49
$138,138
18
$34,484
0
$0
4
$74,965
3
$48,883
APPLICATIONS WITHDRAWN
0
$0
6
$181,810
31
$140,977
5
$95,320
0
$0
1
$75,150
0
$0
FILES CLOSED FOR INCOMPLETENESS
1
$99,770
2
$182,500
13
$139,149
1
$131,800
0
$0
2
$101,090
0
$0
Aggregated Statistics For Year 2005 (Based on 4 partial tracts)
A) FHA, FSA/RHS & VA Home Purchase Loans
B) Conventional Home Purchase Loans
C) Refinancings
D) Home Improvement Loans
F) Non-occupant Loans on < 5 Family Dwellings (A B C & D)
G) Loans On Manufactured Home Dwelling (A B C & D)
Number
Average Value
Number
Average Value
Number
Average Value
Number
Average Value
Number
Average Value
Number
Average Value
LOANS ORIGINATED
5
$116,050
88
$150,997
102
$126,435
27
$54,810
7
$153,550
2
$37,545
APPLICATIONS APPROVED, NOT ACCEPTED
0
$0
10
$109,949
16
$102,139
1
$23,080
2
$60,295
4
$55,942
APPLICATIONS DENIED
0
$0
13
$102,852
69
$124,908
19
$63,574
2
$172,060
6
$71,212
APPLICATIONS WITHDRAWN
1
$230,810
6
$149,662
61
$136,667
7
$115,394
2
$127,455
1
$85,980
FILES CLOSED FOR INCOMPLETENESS
0
$0
6
$168,982
11
$116,385
1
$24,450
1
$36,980
1
$52,480
Aggregated Statistics For Year 2004 (Based on 4 partial tracts)
A) FHA, FSA/RHS & VA Home Purchase Loans
B) Conventional Home Purchase Loans
C) Refinancings
D) Home Improvement Loans
E) Loans on Dwellings For 5+ Families
F) Non-occupant Loans on < 5 Family Dwellings (A B C & D)
G) Loans On Manufactured Home Dwelling (A B C & D)
Number
Average Value
Number
Average Value
Number
Average Value
Number
Average Value
Number
Average Value
Number
Average Value
Number
Average Value
LOANS ORIGINATED
4
$132,348
79
$148,800
109
$106,633
23
$36,002
0
$0
11
$111,925
3
$75,637
APPLICATIONS APPROVED, NOT ACCEPTED
1
$37,570
8
$212,029
14
$131,583
7
$56,616
0
$0
1
$201,330
0
$0
APPLICATIONS DENIED
1
$100,910
15
$82,626
49
$101,490
18
$34,284
0
$0
2
$50,100
10
$58,494
APPLICATIONS WITHDRAWN
1
$82,900
5
$142,300
58
$116,831
5
$35,908
1
$38,340
1
$110,930
1
$53,680
FILES CLOSED FOR INCOMPLETENESS
0
$0
3
$97,810
11
$104,676
2
$43,645
0
$0
0
$0
0
$0
Aggregated Statistics For Year 2003 (Based on 4 partial tracts)
A) FHA, FSA/RHS & VA Home Purchase Loans
B) Conventional Home Purchase Loans
C) Refinancings
D) Home Improvement Loans
E) Loans on Dwellings For 5+ Families
F) Non-occupant Loans on < 5 Family Dwellings (A B C & D)
Number
Average Value
Number
Average Value
Number
Average Value
Number
Average Value
Number
Average Value
Number
Average Value
LOANS ORIGINATED
7
$94,613
69
$140,577
203
$111,377
9
$22,129
1
$69,780
5
$138,598
APPLICATIONS APPROVED, NOT ACCEPTED
0
$0
6
$100,567
34
$102,216
3
$24,470
0
$0
4
$105,300
APPLICATIONS DENIED
0
$0
10
$86,801
60
$104,189
7
$31,951
0
$0
3
$90,193
APPLICATIONS WITHDRAWN
1
$96,510
9
$128,614
56
$122,351
1
$47,710
0
$0
2
$103,475
FILES CLOSED FOR INCOMPLETENESS
1
$35,190
1
$150,290
5
$134,094
1
$5,960
0
$0
0
$0
Aggregated Statistics For Year 2002 (Based on 4 partial tracts)
A) FHA, FSA/RHS & VA Home Purchase Loans
B) Conventional Home Purchase Loans
C) Refinancings
D) Home Improvement Loans
F) Non-occupant Loans on < 5 Family Dwellings (A B C & D)
Number
Average Value
Number
Average Value
Number
Average Value
Number
Average Value
Number
Average Value
LOANS ORIGINATED
11
$91,467
69
$118,542
125
$100,546
14
$35,821
9
$98,944
APPLICATIONS APPROVED, NOT ACCEPTED
0
$0
8
$91,480
21
$100,989
2
$25,050
0
$0
APPLICATIONS DENIED
2
$93,355
17
$59,813
39
$92,118
6
$24,337
1
$23,380
APPLICATIONS WITHDRAWN
1
$54,270
3
$99,887
29
$105,058
5
$30,536
0
$0
FILES CLOSED FOR INCOMPLETENESS
1
$47,710
1
$121,670
7
$125,551
0
$0
0
$0
Aggregated Statistics For Year 2001 (Based on 4 partial tracts)
A) FHA, FSA/RHS & VA Home Purchase Loans
B) Conventional Home Purchase Loans
C) Refinancings
D) Home Improvement Loans
F) Non-occupant Loans on < 5 Family Dwellings (A B C & D)
Number
Average Value
Number
Average Value
Number
Average Value
Number
Average Value
Number
Average Value
LOANS ORIGINATED
13
$90,372
54
$134,205
94
$100,001
11
$26,057
5
$94,934
APPLICATIONS APPROVED, NOT ACCEPTED
0
$0
6
$80,748
16
$77,912
6
$45,833
0
$0
APPLICATIONS DENIED
1
$91,850
9
$74,694
46
$70,475
9
$15,121
0
$0
APPLICATIONS WITHDRAWN
2
$88,940
6
$99,543
26
$95,041
4
$11,720
3
$50,927
FILES CLOSED FOR INCOMPLETENESS
0
$0
1
$39,960
6
$76,330
1
$1,790
0
$0
Aggregated Statistics For Year 2000 (Based on 4 partial tracts)
A) FHA, FSA/RHS & VA Home Purchase Loans
B) Conventional Home Purchase Loans
C) Refinancings
D) Home Improvement Loans
E) Loans on Dwellings For 5+ Families
F) Non-occupant Loans on < 5 Family Dwellings (A B C & D)
Number
Average Value
Number
Average Value
Number
Average Value
Number
Average Value
Number
Average Value
Number
Average Value
LOANS ORIGINATED
10
$90,184
41
$103,721
41
$73,128
28
$18,324
0
$0
2
$107,485
APPLICATIONS APPROVED, NOT ACCEPTED
0
$0
8
$57,514
9
$54,533
3
$28,190
1
$62,620
0
$0
APPLICATIONS DENIED
0
$0
16
$54,084
44
$60,736
12
$23,551
0
$0
2
$79,200
APPLICATIONS WITHDRAWN
1
$112,120
2
$120,150
23
$81,688
2
$33,995
0
$0
0
$0
FILES CLOSED FOR INCOMPLETENESS
0
$0
0
$0
7
$113,150
0
$0
0
$0
1
$23,860
Aggregated Statistics For Year 1999 (Based on 2 partial tracts)
A) FHA, FSA/RHS & VA Home Purchase Loans
B) Conventional Home Purchase Loans
C) Refinancings
D) Home Improvement Loans
F) Non-occupant Loans on < 5 Family Dwellings (A B C & D)

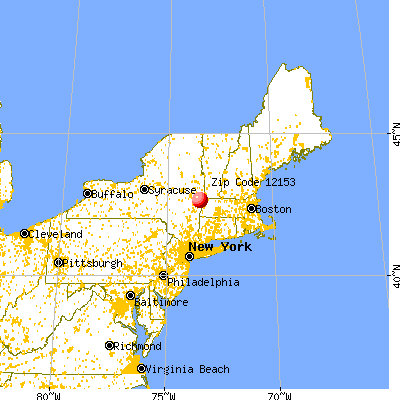


 Nearest zip codes: 12169, 12018, 12140, 12062, 12168, 12040.


