Estimated zip code population in 2022: 817 Zip code population in 2010: 848 Zip code population in 2000: 923
Houses and condos: 313 Renter-occupied apartments: 19
% of renters here:
7%
State:
46%
March 2022 cost of living index in zip code 12156: 92.6 (less than average, U.S. average is 100)
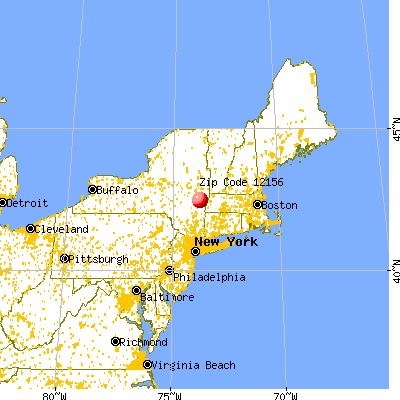
Land area: 14.3 sq. mi. Water area: 0.7 sq. mi.
Population density: 57 people per square mile
(very low).
OSM Map
General Map
Google Map
MSN Map
OSM Map
General Map
Google Map
MSN Map
OSM Map
General Map
Google Map
MSN Map
OSM Map
General Map
Google Map
MSN Map
Please wait while loading the map...
Real estate property taxes paid for housing units in 2022:
This zip code:
2.1% ($4,591)
New York:
1.5% ($6,180)
Median real estate property taxes paid for housing units with mortgages in 2022: $4,687 (2.5%) Median real estate property taxes paid for housing units with no mortgage in 2022: $4,485 (2.0%)
Business Search- 14 Million verified businesses
Males: 440
(53.8%)
Females: 377
(46.2%)
For population 25 years and over in 12156:
High school or higher: 98.0%
Bachelor's degree or higher: 33.9%
Graduate or professional degree: 8.8%
Unemployed: 4.1%
Mean travel time to work (commute): 33.9 minutes
For population 15 years and over in 12156:
Never married: 30.4%
Now married: 53.1%
Separated: 0.0%
Widowed: 10.6%
Divorced: 5.9%
Zip code 12156 compared to state average:
Median house value below state average.
Black race population percentage significantly below state average.
Median age above state average.
Foreign-born population percentage significantly below state average.
Renting percentage significantly below state average.
Length of stay since moving in significantly above state average.
Estimated median house/condo value in 2022: $217,348
12156:
$217,348
New York:
$400,400
According to our research of New York and other state lists, there was 1 registered sex offender living in 12156 zip code as of May 28, 2024. The ratio of all residents to sex offenders in zip code 12156 is 1,148 to 1. The ratio of registered sex offenders to all residents in this zip code is near the state average.
Median resident age:
This zip code:
44.3 years
New York median age:
40.0 years
Average household size:
This zip code:
2.9 people
New York:
2.5 people
Averages for the 2020 tax year for zip code 12156, filed in 2021:
Average Adjusted Gross Income (AGI) in 2020: $74,393 (Individual Income Tax Returns)
Here:
$74,393
State:
$90,930
Salary/wage: $65,824 (reported on 73.3% of returns)
Here:
$65,824
State:
$72,104
(% of AGI for various income ranges: 1090.0% for AGIs below $25k, 3115.7% for AGIs $25k-50k, 6068.0% for AGIs $50k-75k, 8265.0% for AGIs $75k-100k, 20911.7% for AGIs $100k-200k)
Taxable interest for individuals: $648 (reported on 46.7% of returns)
This zip code:
$648
New York:
$3,075
(% of AGI for various income ranges: 23.3% for AGIs below $25k, 8.6% for AGIs $25k-50k, 26.0% for AGIs $50k-75k, 35.0% for AGIs $75k-100k, 148.3% for AGIs $100k-200k)
Ordinary dividends: $4,600 (reported on 24.4% of returns)
Here:
$4,600
State:
$11,095
(% of AGI for various income ranges: 30.0% for AGIs below $25k, 494.0% for AGIs $50k-75k, 401.7% for AGIs $100k-200k)
Net capital gain/loss in AGI: +$8,230 (reported on 22.2% of returns)
Here:
+$8,230
State:
+$44,925
(% of AGI for various income ranges: 210.0% for AGIs below $25k, 124.0% for AGIs $50k-75k, 1058.3% for AGIs $100k-200k)
Profit/loss from business: +$13,329 (reported on 15.6% of returns)
Here:
+$13,329
State:
+$14,940
(% of AGI for various income ranges: 158.3% for AGIs below $25k, 498.6% for AGIs $25k-50k, 815.0% for AGIs $100k-200k)
Taxable individual retirement arrangement distribution: $9,975 (reported on 8.9% of returns)
12156:
$9,975
New York:
$19,609
(% of AGI for various income ranges: 798.0% for AGIs $50k-75k)
Total itemized deductions: $24,200 (reported on 8.9% of returns)
Here:
$24,200
State:
$39,326
(% of AGI for various income ranges: 911.7% for AGIs below $25k, 1052.5% for AGIs $75k-100k)
Taxes paid: $9,500 (reported on 8.9% of returns)
12156:
$9,500
State:
$9,183
(% of AGI for various income ranges: 950.0% for AGIs $75k-100k)
Earned income credit: $1,533 (reported on 6.7% of returns)
Here:
$1,533
State:
$2,138
(% of AGI for various income ranges: 76.7% for AGIs below $25k)
Percentage of individuals using paid preparers for their 2020 taxes: 91.1%
Here:
91%
State:
95%
(% for various income ranges: 88.9% for AGIs below $25k, 90.0% for AGIs $25k-50k, 87.5% for AGIs $50k-75k, 100.0% for AGIs $75k-100k, 91.7% for AGIs $100k-200k)
Averages for the 2012 tax year for zip code 12156, filed in 2013:
Average Adjusted Gross Income (AGI) in 2012: $59,032 (Individual Income Tax Returns)
Here:
$59,032
State:
$77,088
Salary/wage: $52,525 (reported on 81.8% of returns)
Here:
$52,525
State:
$60,593
(% of AGI for various income ranges: 66.7% for AGIs below $25k, 76.1% for AGIs $25k-50k, 70.0% for AGIs $50k-75k, 75.1% for AGIs $75k-100k, 72.7% for AGIs $100k-200k)
Taxable interest for individuals: $476 (reported on 47.7% of returns)
This zip code:
$476
New York:
$3,125
(% of AGI for various income ranges: 0.2% for AGIs below $25k, 0.2% for AGIs $25k-50k, 0.6% for AGIs $50k-75k, 0.4% for AGIs $75k-100k, 0.4% for AGIs $100k-200k)
Ordinary dividends: $1,838 (reported on 29.5% of returns)
Here:
$1,838
State:
$10,299
(% of AGI for various income ranges: 1.6% for AGIs below $25k, 0.4% for AGIs $25k-50k, 1.1% for AGIs $50k-75k, 0.8% for AGIs $75k-100k, 1.0% for AGIs $100k-200k)
Net capital gain/loss in AGI: +$4,657 (reported on 15.9% of returns)
Here:
+$4,657
State:
+$42,474
(% of AGI for various income ranges: 6.1% for AGIs below $25k, 3.2% for AGIs $50k-75k, 0.7% for AGIs $100k-200k)
Profit/loss from business: +$10,040 (reported on 11.4% of returns)
Here:
+$10,040
State:
+$16,168
Taxable individual retirement arrangement distribution: $10,440 (reported on 11.4% of returns)
12156:
$10,440
New York:
$17,621
Total itemized deductions: $22,637 (24% of AGI, reported on 43.2% of returns)
Here:
$22,637
State:
$34,985
Here:
24.3% of AGI
State:
21.3% of AGI
(% of AGI for various income ranges: 16.5% for AGIs $25k-50k, 16.8% for AGIs $50k-75k, 15.2% for AGIs $75k-100k, 19.9% for AGIs $100k-200k)
Charity contributions: $1,973 (reported on 34.1% of returns)
Here:
$1,973
State:
$5,572
(% of AGI for various income ranges: 0.8% for AGIs $25k-50k, 1.6% for AGIs $50k-75k, 0.9% for AGIs $75k-100k, 1.4% for AGIs $100k-200k)
Taxes paid: $12,905 (reported on 43.2% of returns)
12156:
$12,905
State:
$18,656
(% of AGI for various income ranges: 8.2% for AGIs $25k-50k, 7.9% for AGIs $50k-75k, 9.4% for AGIs $75k-100k, 12.2% for AGIs $100k-200k)
Earned income credit: $1,300 (reported on 9.1% of returns)
Here:
$1,300
State:
$2,230
(% of AGI for various income ranges: 3.1% for AGIs below $25k)
Percentage of individuals using paid preparers for their 2012 taxes: 54.5%
Here:
55%
State:
66%
(% for various income ranges: 42.9% for AGIs below $25k, 60.0% for AGIs $25k-50k, 50.0% for AGIs $50k-75k, 66.7% for AGIs $75k-100k, 66.7% for AGIs $100k-200k)
Averages for the 2004 tax year for zip code 12156, filed in 2005:
Average Adjusted Gross Income (AGI) in 2004: $48,326 (Individual Income Tax Returns)
Here:
$48,326
State:
$59,519
Salary/wage: $44,206 (reported on 84.5% of returns)
Here:
$44,206
State:
$50,673
(% of AGI for various income ranges: 103.0% for AGIs below $10k, 74.1% for AGIs $10k-25k, 83.6% for AGIs $25k-50k, 84.6% for AGIs $50k-75k, 82.9% for AGIs $75k-100k, 67.3% for AGIs over 100k)
Taxable interest for individuals: $635 (reported on 60.7% of returns)
This zip code:
$635
New York:
$2,377
(% of AGI for various income ranges: 6.6% for AGIs below $10k, 1.3% for AGIs $10k-25k, 0.5% for AGIs $25k-50k, 0.7% for AGIs $50k-75k, 0.6% for AGIs $75k-100k, 0.7% for AGIs over 100k)
Taxable dividends: $2,993 (reported on 32.9% of returns)
Here:
$2,993
State:
$5,394
(% of AGI for various income ranges: 3.9% for AGIs below $10k, 0.9% for AGIs $10k-25k, 1.5% for AGIs $25k-50k, 0.9% for AGIs $50k-75k, 0.3% for AGIs $75k-100k, 3.7% for AGIs over 100k)
Net capital gain/loss: +$2,453 (reported on 22.6% of returns)
Here:
+$2,453
State:
+$23,581
(% of AGI for various income ranges: -1.8% for AGIs below $10k, 1.0% for AGIs $25k-50k, -0.3% for AGIs $50k-75k, 2.8% for AGIs over 100k)
Profit/loss from business: +$6,830 (reported on 11.2% of returns)
Here:
+$6,830
State:
+$13,809
Total itemized deductions: $17,250 (21% of AGI, reported on 41.0% of returns)
Here:
$17,250
State:
$25,864
Here:
21.1% of AGI
State:
21.9% of AGI
(% of AGI for various income ranges: 33.8% for AGIs below $10k, 13.1% for AGIs $25k-50k, 16.9% for AGIs $50k-75k, 16.3% for AGIs $75k-100k, 15.3% for AGIs over 100k)
Charity contributions deductions: $1,911 (2% of AGI, reported on 37.4% of returns)
Here:
$1,911
State:
$4,439
Here:
2.3% of AGI
State:
3.6% of AGI
(% of AGI for various income ranges: 1.0% for AGIs $25k-50k, 1.5% for AGIs $50k-75k, 1.8% for AGIs $75k-100k, 1.9% for AGIs over 100k)
Total tax: $7,009 (reported on 77.4% of returns)
12156:
$7,009
State:
$11,730
(% of AGI for various income ranges: 2.7% for AGIs below $10k, 4.7% for AGIs $10k-25k, 7.1% for AGIs $25k-50k, 8.3% for AGIs $50k-75k, 11.2% for AGIs $75k-100k, 16.5% for AGIs over 100k)
Earned income credit: $1,463 (reported on 9.8% of returns)
Here:
$1,463
State:
$1,757
Percentage of individuals using paid preparers for their 2004 taxes: 52.6%
Here:
53%
State:
67%
(% for various income ranges: 37.9% for AGIs below $10k, 59.7% for AGIs $10k-25k, 45.6% for AGIs $25k-50k, 65.2% for AGIs $50k-75k, 60.0% for AGIs $75k-100k, 59.6% for AGIs over 100k)
Household received Food Stamps/SNAP in the past 12 months: 10 Household did not receive Food Stamps/SNAP in the past 12 months: 269
Women who did not have a birth in the past 12 months: 184 (83 now married, 99 unmarried)
Housing units in zip code 12156 with a mortgage: 153 (33 second mortgage, 34 both second mortgage and home equity loan) Median monthly owner costs for units with a mortgage: $1,920 Median monthly owner costs for units without a mortgage: $760
Residents with income below the poverty level in 2022:
This zip code:
4.9%
Whole state:
14.3%
Residents with income below 50% of the poverty level in 2022:
This zip code:
1.3%
Whole state:
6.8%
Median number of rooms in houses and condos:
Here:
6.1
State:
6.3
Notable locations in this zip code not listed on our city pages
Size of family households: 69 2-persons, 49 3-persons, 53 4-persons, 42 5-persons
Size of nonfamily households: 65 1-person
144 married couples with children.
62 single-parent households (44 men, 18 women).
99.0% of residents of 12156 zip code speak English at home.
1.0% of residents speak other Indo-European language at home (100% well).
Foreign born population: 19 (2.3%) (0.0% of them are naturalized citizens)
:
2.3%
Whole state:
22.7%
18%English
13%Italian
9%German
7%Dutch
6%French Canadian
2%Irish
Year of entry for the foreign-born population
02010 or later
02000 to 2009
181990 to 1999
0Before 1990
Facilities with environmental interests located in this zip code:
CROCCO RESIDENCE (421 CROCCO LANE in SCHODACK LANDING, NY)
Conditionally Exempt Small Quantity Generators, less than 100 kg/month of hazardous waste (Resource Conservation and Recovery Act (tracking hazardous waste)) - notification Organizations: CHANCY CROCCO (CONTACT/OWNER)
Housing units lacking complete plumbing facilities: 9.4% Housing units lacking complete kitchen facilities: 9.5%
77.6%Fuel oil, kerosene, etc.
10.5%Electricity
6.9%Wood
3.6%Utility gas
2.2%Bottled, tank, or LP gas
Population in 1990: 902. Population change in the 1990s: +21 (+2.3%).
Place of birth for U.S.-born residents:
This state: 589
Northeast: 67
South: 136
63% of the 12156 zip code residents lived in the same house 5 years ago. Out of people who lived in different houses, 27% lived in this county. Out of people who lived in different counties, 50% lived in New York.
98% of the 12156 zip code residents lived in the same house 1 year ago. Out of people who lived in different houses, 80% moved from this county.
Private vs. public school enrollment:
Students in private schools in grades 1 to 8 (elementary and middle school):
Here:
0.0%
New York:
15.6%
Students in private schools in grades 9 to 12 (high school):
Here:
0.0%
New York:
15.0%
Students in private undergraduate colleges: 18
Here:
42.5%
New York:
39.2%
Occupation by median earnings in the past 12 months ($)
70,412Management occupations
35,187Office and administrative support occupations
Companies with federal contracts located in this zip code:
C E J J INC (939 RT 9 in SCHODACK LANDI, NY; small business)
$46,151 with Army for Miscellaneous Service and Trade Equipment. Signed on 2006-03-08. Completion date: 2006-04-10.
Top industries in this zip code by the number of employees in 2005:
Management of Companies and Enterprises: Corporate, Subsidiary, and Regional Managing Offices (20-49 employees: 1 establishment, 10-19 employees: 1 establishment)
Real Estate and Rental and Leasing: Truck, Utility Trailer, and RV (Recreational Vehicle) Rental and Leasing (10-19: 1)
Administrative and Support and Waste Management and Remediation Services: Janitorial Services (10-19: 1)
Administrative and Support and Waste Management and Remediation Services: Landscaping Services (5-9: 1)
Professional, Scientific, and Technical Services: Other Accounting Services (1-4: 3)
Professional, Scientific, and Technical Services: Title Abstract and Settlement Offices (1-4: 1)
Fatal accident statistics in 2011:
Fatal accident count: 1
Vehicles involved in fatal accidents: 1
Fatal accidents caused by drunken drivers: 0
Fatalities: 1
Persons involved in fatal accidents: 1
Pedestrians involved in fatal accidents: 0
Home Mortgage Disclosure Act Aggregated Statistics For Year 2009 (Based on 2 partial tracts)
A) FHA, FSA/RHS & VA Home Purchase Loans
B) Conventional Home Purchase Loans
C) Refinancings
D) Home Improvement Loans
F) Non-occupant Loans on < 5 Family Dwellings (A B C & D)
G) Loans On Manufactured Home Dwelling (A B C & D)
Number
Average Value
Number
Average Value
Number
Average Value
Number
Average Value
Number
Average Value
Number
Average Value
LOANS ORIGINATED
12
$197,454
14
$173,833
79
$164,870
9
$32,967
1
$106,150
0
$0
APPLICATIONS APPROVED, NOT ACCEPTED
3
$202,287
1
$190,550
6
$212,298
2
$18,125
0
$0
1
$12,950
APPLICATIONS DENIED
2
$97,345
2
$100,195
26
$179,278
6
$84,402
1
$103,560
0
$0
APPLICATIONS WITHDRAWN
2
$162,330
2
$181,750
16
$179,256
0
$0
1
$79,740
0
$0
FILES CLOSED FOR INCOMPLETENESS
1
$89,060
0
$0
2
$154,565
1
$6,210
0
$0
0
$0
Aggregated Statistics For Year 2008 (Based on 2 partial tracts)
A) FHA, FSA/RHS & VA Home Purchase Loans
B) Conventional Home Purchase Loans
C) Refinancings
D) Home Improvement Loans
F) Non-occupant Loans on < 5 Family Dwellings (A B C & D)
G) Loans On Manufactured Home Dwelling (A B C & D)
Number
Average Value
Number
Average Value
Number
Average Value
Number
Average Value
Number
Average Value
Number
Average Value
LOANS ORIGINATED
7
$199,427
21
$175,707
42
$151,407
13
$60,662
1
$105,630
1
$45,570
APPLICATIONS APPROVED, NOT ACCEPTED
1
$152,750
2
$171,135
9
$150,794
2
$86,730
0
$0
0
$0
APPLICATIONS DENIED
1
$177,090
3
$175,880
16
$204,984
10
$90,719
1
$12,950
0
$0
APPLICATIONS WITHDRAWN
1
$136,180
1
$216,960
13
$196,047
2
$75,340
0
$0
0
$0
FILES CLOSED FOR INCOMPLETENESS
1
$204,530
1
$64,210
4
$230,940
1
$102,520
0
$0
0
$0
Aggregated Statistics For Year 2007 (Based on 2 partial tracts)
A) FHA, FSA/RHS & VA Home Purchase Loans
B) Conventional Home Purchase Loans
C) Refinancings
D) Home Improvement Loans
F) Non-occupant Loans on < 5 Family Dwellings (A B C & D)
G) Loans On Manufactured Home Dwelling (A B C & D)
Number
Average Value
Number
Average Value
Number
Average Value
Number
Average Value
Number
Average Value
Number
Average Value
LOANS ORIGINATED
2
$103,820
38
$178,041
54
$154,362
8
$46,926
2
$84,660
1
$22,270
APPLICATIONS APPROVED, NOT ACCEPTED
1
$92,170
8
$199,741
12
$187,142
2
$17,085
1
$51,260
1
$10,870
APPLICATIONS DENIED
0
$0
5
$316,480
31
$176,336
7
$59,399
1
$157,930
1
$17,090
APPLICATIONS WITHDRAWN
1
$95,280
2
$214,370
15
$186,097
3
$104,767
0
$0
0
$0
FILES CLOSED FOR INCOMPLETENESS
0
$0
2
$105,115
6
$173,118
1
$51,780
0
$0
0
$0
Aggregated Statistics For Year 2006 (Based on 2 partial tracts)
A) FHA, FSA/RHS & VA Home Purchase Loans
B) Conventional Home Purchase Loans
C) Refinancings
D) Home Improvement Loans
E) Loans on Dwellings For 5+ Families
F) Non-occupant Loans on < 5 Family Dwellings (A B C & D)
G) Loans On Manufactured Home Dwelling (A B C & D)
Number
Average Value
Number
Average Value
Number
Average Value
Number
Average Value
Number
Average Value
Number
Average Value
Number
Average Value
LOANS ORIGINATED
2
$131,780
48
$171,241
46
$140,504
14
$71,124
1
$108,220
2
$198,060
1
$8,800
APPLICATIONS APPROVED, NOT ACCEPTED
1
$65,760
6
$161,813
11
$180,477
5
$36,350
0
$0
1
$80,780
0
$0
APPLICATIONS DENIED
1
$81,810
6
$129,537
31
$173,062
19
$61,046
0
$0
1
$2,070
1
$45,570
APPLICATIONS WITHDRAWN
1
$46,080
6
$160,087
21
$157,707
1
$15,530
0
$0
1
$77,670
0
$0
FILES CLOSED FOR INCOMPLETENESS
0
$0
3
$99,763
9
$196,879
1
$119,090
0
$0
0
$0
0
$0
Aggregated Statistics For Year 2005 (Based on 2 partial tracts)
A) FHA, FSA/RHS & VA Home Purchase Loans
B) Conventional Home Purchase Loans
C) Refinancings
D) Home Improvement Loans
E) Loans on Dwellings For 5+ Families
F) Non-occupant Loans on < 5 Family Dwellings (A B C & D)
G) Loans On Manufactured Home Dwelling (A B C & D)
Number
Average Value
Number
Average Value
Number
Average Value
Number
Average Value
Number
Average Value
Number
Average Value
Number
Average Value
LOANS ORIGINATED
4
$125,308
51
$163,076
66
$127,575
25
$52,401
1
$93,200
5
$158,136
2
$41,425
APPLICATIONS APPROVED, NOT ACCEPTED
1
$189,510
4
$123,882
11
$120,930
4
$26,150
0
$0
0
$0
1
$9,320
APPLICATIONS DENIED
0
$0
8
$95,470
40
$132,207
14
$26,556
0
$0
1
$75,600
4
$32,623
APPLICATIONS WITHDRAWN
1
$173,460
5
$105,320
44
$165,955
3
$97,173
0
$0
0
$0
2
$67,315
FILES CLOSED FOR INCOMPLETENESS
0
$0
3
$201,770
5
$166,420
1
$12,950
0
$0
0
$0
0
$0
Aggregated Statistics For Year 2004 (Based on 2 partial tracts)
A) FHA, FSA/RHS & VA Home Purchase Loans
B) Conventional Home Purchase Loans
C) Refinancings
D) Home Improvement Loans
F) Non-occupant Loans on < 5 Family Dwellings (A B C & D)
G) Loans On Manufactured Home Dwelling (A B C & D)
Number
Average Value
Number
Average Value
Number
Average Value
Number
Average Value
Number
Average Value
Number
Average Value
LOANS ORIGINATED
5
$126,032
61
$141,631
66
$118,490
14
$58,919
3
$190,207
0
$0
APPLICATIONS APPROVED, NOT ACCEPTED
2
$100,970
5
$136,078
13
$88,026
4
$72,492
1
$31,070
0
$0
APPLICATIONS DENIED
1
$82,850
4
$131,392
38
$107,607
6
$35,038
1
$25,890
2
$26,925
APPLICATIONS WITHDRAWN
2
$132,300
3
$124,963
34
$134,537
2
$67,055
0
$0
1
$27,440
FILES CLOSED FOR INCOMPLETENESS
0
$0
5
$116,506
3
$64,553
1
$11,910
0
$0
0
$0
Aggregated Statistics For Year 2003 (Based on 2 partial tracts)
A) FHA, FSA/RHS & VA Home Purchase Loans
B) Conventional Home Purchase Loans
C) Refinancings
D) Home Improvement Loans
F) Non-occupant Loans on < 5 Family Dwellings (A B C & D)
Number
Average Value
Number
Average Value
Number
Average Value
Number
Average Value
Number
Average Value
LOANS ORIGINATED
6
$100,625
47
$135,267
132
$113,151
3
$79,740
1
$179,680
APPLICATIONS APPROVED, NOT ACCEPTED
1
$131,520
7
$96,977
20
$101,489
2
$17,865
1
$46,600
APPLICATIONS DENIED
1
$77,670
4
$80,260
46
$108,648
3
$36,937
1
$75,600
APPLICATIONS WITHDRAWN
2
$128,155
3
$102,180
26
$105,113
1
$20,710
1
$31,070
FILES CLOSED FOR INCOMPLETENESS
1
$31,070
0
$0
5
$155,444
0
$0
1
$86,990
Aggregated Statistics For Year 2002 (Based on 2 partial tracts)
A) FHA, FSA/RHS & VA Home Purchase Loans
B) Conventional Home Purchase Loans
C) Refinancings
D) Home Improvement Loans
F) Non-occupant Loans on < 5 Family Dwellings (A B C & D)
Number
Average Value
Number
Average Value
Number
Average Value
Number
Average Value
Number
Average Value
LOANS ORIGINATED
8
$106,796
45
$118,001
67
$113,035
5
$14,498
3
$92,340
APPLICATIONS APPROVED, NOT ACCEPTED
1
$50,740
1
$88,540
14
$91,429
3
$18,987
1
$38,320
APPLICATIONS DENIED
0
$0
9
$69,270
17
$84,371
2
$16,570
1
$16,050
APPLICATIONS WITHDRAWN
1
$147,570
3
$145,157
17
$108,677
1
$44,010
1
$64,730
FILES CLOSED FOR INCOMPLETENESS
0
$0
0
$0
3
$102,007
0
$0
0
$0
Aggregated Statistics For Year 2001 (Based on 2 partial tracts)
A) FHA, FSA/RHS & VA Home Purchase Loans
B) Conventional Home Purchase Loans
C) Refinancings
D) Home Improvement Loans
F) Non-occupant Loans on < 5 Family Dwellings (A B C & D)
Number
Average Value
Number
Average Value
Number
Average Value
Number
Average Value
Number
Average Value
LOANS ORIGINATED
8
$114,434
31
$105,180
60
$108,997
7
$14,129
1
$89,060
APPLICATIONS APPROVED, NOT ACCEPTED
1
$62,140
3
$86,127
6
$86,042
3
$23,990
1
$77,150
APPLICATIONS DENIED
1
$46,080
5
$46,912
20
$93,282
4
$22,655
1
$105,110
APPLICATIONS WITHDRAWN
2
$71,455
4
$104,338
11
$97,817
2
$17,345
1
$15,530
FILES CLOSED FOR INCOMPLETENESS
0
$0
0
$0
3
$65,070
1
$22,780
0
$0
Aggregated Statistics For Year 2000 (Based on 2 partial tracts)
A) FHA, FSA/RHS & VA Home Purchase Loans
B) Conventional Home Purchase Loans
C) Refinancings
D) Home Improvement Loans
F) Non-occupant Loans on < 5 Family Dwellings (A B C & D)
Number
Average Value
Number
Average Value
Number
Average Value
Number
Average Value
Number
Average Value
LOANS ORIGINATED
6
$98,468
38
$118,603
20
$86,887
12
$13,808
1
$103,040
APPLICATIONS APPROVED, NOT ACCEPTED
1
$39,870
3
$33,830
8
$107,314
3
$22,437
0
$0
APPLICATIONS DENIED
1
$42,980
5
$16,984
17
$73,071
7
$30,846
0
$0
APPLICATIONS WITHDRAWN
2
$63,690
4
$94,758
9
$65,070
2
$15,535
1
$30,030
FILES CLOSED FOR INCOMPLETENESS
0
$0
0
$0
4
$44,530
0
$0
0
$0
Aggregated Statistics For Year 1999 (Based on 1 partial tract)
A) FHA, FSA/RHS & VA Home Purchase Loans
B) Conventional Home Purchase Loans
C) Refinancings
D) Home Improvement Loans
F) Non-occupant Loans on < 5 Family Dwellings (A B C & D)


 Nearest zip codes: 12045, 12124, 12033, 12158, 12130, 12106.


