Estimated zip code population in 2022: 2,299
Zip code population in 2010: 1,948
Zip code population in 2000: 2,187
Houses and condos: 1,582
Renter-occupied apartments: 1,309
% of renters here:
97%State:
46%
March 2022 cost of living index in zip code 12207: 106.0
(more than average, U.S. average is 100)
Land area: 1.1
sq. mi.
Water area: 0.2
sq. mi.
Population density: 2,168 people per square mile (low).
OSM Map
General Map
Google Map
MSN Map
OSM Map
General Map
Google Map
MSN Map
OSM Map
General Map
Google Map
MSN Map
OSM Map
General Map
Google Map
MSN Map
Please wait while loading the map...
Real estate property taxes paid for housing units in 2022:
This zip code:
2.4% ($5,230)New York:
1.5% ($6,180)
Profiles of local businesses
Business Search - 14 Million verified businesses
Males: 1,396 Females: 903
For population 25 years and over in 12207:
High school or higher: 88.0%Bachelor's degree or higher: 33.5%Graduate or professional degree: 22.5%Unemployed: 2.6%Mean travel time to work (commute): 19.6 minutes
For population 15 years and over in 12207:
Never married: 64.8%Now married: 18.5%Separated: 2.6%Widowed: 4.8%Divorced: 9.4%
Zip code 12207 compared to state average:
Median household income below state average. Median house value significantly below state average. Unemployed percentage below state average. Black race population percentage significantly above state average. Hispanic race population percentage significantly below state average. Median age below state average. Foreign-born population percentage significantly below state average. Renting percentage above state average. Length of stay since moving in significantly above state average. Number of rooms per house significantly below state average. 1,050 45.7% Black 1,025 44.6% White 152 6.6% Hispanic or Latino 54 2.3% Two or more races 17 0.7% Asian
Data:
Median household income ($)
Median household income (% change since 2000)
Household income diversity
Ratio of average income to average house value (%)
Ratio of average income to average rent
Median household income ($) - White
Median household income ($) - Black or African American
Median household income ($) - Asian
Median household income ($) - Hispanic or Latino
Median household income ($) - American Indian and Alaska Native
Median household income ($) - Multirace
Median household income ($) - Other Race
Median household income for houses/condos with a mortgage ($)
Median household income for apartments without a mortgage ($)
Races - White alone (%)
Races - White alone (% change since 2000)
Races - Black alone (%)
Races - Black alone (% change since 2000)
Races - American Indian alone (%)
Races - American Indian alone (% change since 2000)
Races - Asian alone (%)
Races - Asian alone (% change since 2000)
Races - Hispanic (%)
Races - Hispanic (% change since 2000)
Races - Native Hawaiian and Other Pacific Islander alone (%)
Races - Native Hawaiian and Other Pacific Islander alone (% change since 2000)
Races - Two or more races (%)
Races - Two or more races (% change since 2000)
Races - Other race alone (%)
Races - Other race alone (% change since 2000)
Racial diversity
Unemployment (%)
Unemployment (% change since 2000)
Unemployment (%) - White
Unemployment (%) - Black or African American
Unemployment (%) - Asian
Unemployment (%) - Hispanic or Latino
Unemployment (%) - American Indian and Alaska Native
Unemployment (%) - Multirace
Unemployment (%) - Other Race
Population density (people per square mile)
Population - Males (%)
Population - Females (%)
Population - Males (%) - White
Population - Males (%) - Black or African American
Population - Males (%) - Asian
Population - Males (%) - Hispanic or Latino
Population - Males (%) - American Indian and Alaska Native
Population - Males (%) - Multirace
Population - Males (%) - Other Race
Population - Females (%) - White
Population - Females (%) - Black or African American
Population - Females (%) - Asian
Population - Females (%) - Hispanic or Latino
Population - Females (%) - American Indian and Alaska Native
Population - Females (%) - Multirace
Population - Females (%) - Other Race
Coronavirus confirmed cases (May 21, 2024)
Deaths caused by coronavirus (May 21, 2024)
Coronavirus confirmed cases (per 100k population) (May 21, 2024)
Deaths caused by coronavirus (per 100k population) (May 21, 2024)
Daily increase in number of cases (May 21, 2024)
Weekly increase in number of cases (May 21, 2024)
Cases doubled (in days) (May 21, 2024)
Hospitalized patients (Apr 18, 2022)
Negative test results (Apr 18, 2022)
Total test results (Apr 18, 2022)
COVID Vaccine doses distributed (per 100k population) (Sep 19, 2023)
COVID Vaccine doses administered (per 100k population) (Sep 19, 2023)
COVID Vaccine doses distributed (Sep 19, 2023)
COVID Vaccine doses administered (Sep 19, 2023)
Likely homosexual households (%)
Likely homosexual households (% change since 2000)
Likely homosexual households - Lesbian couples (%)
Likely homosexual households - Lesbian couples (% change since 2000)
Likely homosexual households - Gay men (%)
Likely homosexual households - Gay men (% change since 2000)
Cost of living index
Median gross rent ($)
Median contract rent ($)
Median monthly housing costs ($)
Median house or condo value ($)
Median house or condo value ($ change since 2000)
Mean house or condo value by units in structure - 1, detached ($)
Mean house or condo value by units in structure - 1, attached ($)
Mean house or condo value by units in structure - 2 ($)
Mean house or condo value by units in structure by units in structure - 3 or 4 ($)
Mean house or condo value by units in structure - 5 or more ($)
Mean house or condo value by units in structure - Boat, RV, van, etc. ($)
Mean house or condo value by units in structure - Mobile home ($)
Median house or condo value ($) - White
Median house or condo value ($) - Black or African American
Median house or condo value ($) - Asian
Median house or condo value ($) - Hispanic or Latino
Median house or condo value ($) - American Indian and Alaska Native
Median house or condo value ($) - Multirace
Median house or condo value ($) - Other Race
Median resident age
Resident age diversity
Median resident age - Males
Median resident age - Females
Median resident age - White
Median resident age - Black or African American
Median resident age - Asian
Median resident age - Hispanic or Latino
Median resident age - American Indian and Alaska Native
Median resident age - Multirace
Median resident age - Other Race
Median resident age - Males - White
Median resident age - Males - Black or African American
Median resident age - Males - Asian
Median resident age - Males - Hispanic or Latino
Median resident age - Males - American Indian and Alaska Native
Median resident age - Males - Multirace
Median resident age - Males - Other Race
Median resident age - Females - White
Median resident age - Females - Black or African American
Median resident age - Females - Asian
Median resident age - Females - Hispanic or Latino
Median resident age - Females - American Indian and Alaska Native
Median resident age - Females - Multirace
Median resident age - Females - Other Race
Commute - mean travel time to work (minutes)
Travel time to work - Less than 5 minutes (%)
Travel time to work - Less than 5 minutes (% change since 2000)
Travel time to work - 5 to 9 minutes (%)
Travel time to work - 5 to 9 minutes (% change since 2000)
Travel time to work - 10 to 19 minutes (%)
Travel time to work - 10 to 19 minutes (% change since 2000)
Travel time to work - 20 to 29 minutes (%)
Travel time to work - 20 to 29 minutes (% change since 2000)
Travel time to work - 30 to 39 minutes (%)
Travel time to work - 30 to 39 minutes (% change since 2000)
Travel time to work - 40 to 59 minutes (%)
Travel time to work - 40 to 59 minutes (% change since 2000)
Travel time to work - 60 to 89 minutes (%)
Travel time to work - 60 to 89 minutes (% change since 2000)
Travel time to work - 90 or more minutes (%)
Travel time to work - 90 or more minutes (% change since 2000)
Marital status - Never married (%)
Marital status - Now married (%)
Marital status - Separated (%)
Marital status - Widowed (%)
Marital status - Divorced (%)
Median family income ($)
Median family income (% change since 2000)
Median non-family income ($)
Median non-family income (% change since 2000)
Median per capita income ($)
Median per capita income (% change since 2000)
Median family income ($) - White
Median family income ($) - Black or African American
Median family income ($) - Asian
Median family income ($) - Hispanic or Latino
Median family income ($) - American Indian and Alaska Native
Median family income ($) - Multirace
Median family income ($) - Other Race
Median year house/condo built
Median year apartment built
Year house built - Built 2005 or later (%)
Year house built - Built 2000 to 2004 (%)
Year house built - Built 1990 to 1999 (%)
Year house built - Built 1980 to 1989 (%)
Year house built - Built 1970 to 1979 (%)
Year house built - Built 1960 to 1969 (%)
Year house built - Built 1950 to 1959 (%)
Year house built - Built 1940 to 1949 (%)
Year house built - Built 1939 or earlier (%)
Average household size
Household density (households per square mile)
Average household size - White
Average household size - Black or African American
Average household size - Asian
Average household size - Hispanic or Latino
Average household size - American Indian and Alaska Native
Average household size - Multirace
Average household size - Other Race
Occupied housing units (%)
Vacant housing units (%)
Owner occupied housing units (%)
Renter occupied housing units (%)
Vacancy status - For rent (%)
Vacancy status - For sale only (%)
Vacancy status - Rented or sold, not occupied (%)
Vacancy status - For seasonal, recreational, or occasional use (%)
Vacancy status - For migrant workers (%)
Vacancy status - Other vacant (%)
Residents with income below the poverty level (%)
Residents with income below 50% of the poverty level (%)
Children below poverty level (%)
Poor families by family type - Married-couple family (%)
Poor families by family type - Male, no wife present (%)
Poor families by family type - Female, no husband present (%)
Poverty status for native-born residents (%)
Poverty status for foreign-born residents (%)
Poverty among high school graduates not in families (%)
Poverty among people who did not graduate high school not in families (%)
Residents with income below the poverty level (%) - White
Residents with income below the poverty level (%) - Black or African American
Residents with income below the poverty level (%) - Asian
Residents with income below the poverty level (%) - Hispanic or Latino
Residents with income below the poverty level (%) - American Indian and Alaska Native
Residents with income below the poverty level (%) - Multirace
Residents with income below the poverty level (%) - Other Race
Air pollution - Air Quality Index (AQI)
Air pollution - CO
Air pollution - NO2
Air pollution - SO2
Air pollution - Ozone
Air pollution - PM10
Air pollution - PM25
Air pollution - Pb
Crime - Murders per 100,000 population
Crime - Rapes per 100,000 population
Crime - Robberies per 100,000 population
Crime - Assaults per 100,000 population
Crime - Burglaries per 100,000 population
Crime - Thefts per 100,000 population
Crime - Auto thefts per 100,000 population
Crime - Arson per 100,000 population
Crime - City-data.com crime index
Crime - Violent crime index
Crime - Property crime index
Crime - Murders per 100,000 population (5 year average)
Crime - Rapes per 100,000 population (5 year average)
Crime - Robberies per 100,000 population (5 year average)
Crime - Assaults per 100,000 population (5 year average)
Crime - Burglaries per 100,000 population (5 year average)
Crime - Thefts per 100,000 population (5 year average)
Crime - Auto thefts per 100,000 population (5 year average)
Crime - Arson per 100,000 population (5 year average)
Crime - City-data.com crime index (5 year average)
Crime - Violent crime index (5 year average)
Crime - Property crime index (5 year average)
1996 Presidential Elections Results (%) - Democratic Party (Clinton)
1996 Presidential Elections Results (%) - Republican Party (Dole)
1996 Presidential Elections Results (%) - Other
2000 Presidential Elections Results (%) - Democratic Party (Gore)
2000 Presidential Elections Results (%) - Republican Party (Bush)
2000 Presidential Elections Results (%) - Other
2004 Presidential Elections Results (%) - Democratic Party (Kerry)
2004 Presidential Elections Results (%) - Republican Party (Bush)
2004 Presidential Elections Results (%) - Other
2008 Presidential Elections Results (%) - Democratic Party (Obama)
2008 Presidential Elections Results (%) - Republican Party (McCain)
2008 Presidential Elections Results (%) - Other
2012 Presidential Elections Results (%) - Democratic Party (Obama)
2012 Presidential Elections Results (%) - Republican Party (Romney)
2012 Presidential Elections Results (%) - Other
2016 Presidential Elections Results (%) - Democratic Party (Clinton)
2016 Presidential Elections Results (%) - Republican Party (Trump)
2016 Presidential Elections Results (%) - Other
2020 Presidential Elections Results (%) - Democratic Party (Biden)
2020 Presidential Elections Results (%) - Republican Party (Trump)
2020 Presidential Elections Results (%) - Other
Ancestries Reported - Arab (%)
Ancestries Reported - Czech (%)
Ancestries Reported - Danish (%)
Ancestries Reported - Dutch (%)
Ancestries Reported - English (%)
Ancestries Reported - French (%)
Ancestries Reported - French Canadian (%)
Ancestries Reported - German (%)
Ancestries Reported - Greek (%)
Ancestries Reported - Hungarian (%)
Ancestries Reported - Irish (%)
Ancestries Reported - Italian (%)
Ancestries Reported - Lithuanian (%)
Ancestries Reported - Norwegian (%)
Ancestries Reported - Polish (%)
Ancestries Reported - Portuguese (%)
Ancestries Reported - Russian (%)
Ancestries Reported - Scotch-Irish (%)
Ancestries Reported - Scottish (%)
Ancestries Reported - Slovak (%)
Ancestries Reported - Subsaharan African (%)
Ancestries Reported - Swedish (%)
Ancestries Reported - Swiss (%)
Ancestries Reported - Ukrainian (%)
Ancestries Reported - United States (%)
Ancestries Reported - Welsh (%)
Ancestries Reported - West Indian (%)
Ancestries Reported - Other (%)
Educational Attainment - No schooling completed (%)
Educational Attainment - Less than high school (%)
Educational Attainment - High school or equivalent (%)
Educational Attainment - Less than 1 year of college (%)
Educational Attainment - 1 or more years of college (%)
Educational Attainment - Associate degree (%)
Educational Attainment - Bachelor's degree (%)
Educational Attainment - Master's degree (%)
Educational Attainment - Professional school degree (%)
Educational Attainment - Doctorate degree (%)
School Enrollment - Nursery, preschool (%)
School Enrollment - Kindergarten (%)
School Enrollment - Grade 1 to 4 (%)
School Enrollment - Grade 5 to 8 (%)
School Enrollment - Grade 9 to 12 (%)
School Enrollment - College undergrad (%)
School Enrollment - Graduate or professional (%)
School Enrollment - Not enrolled in school (%)
School enrollment - Public schools (%)
School enrollment - Private schools (%)
School enrollment - Not enrolled (%)
Median number of rooms in houses and condos
Median number of rooms in apartments
Housing units lacking complete plumbing facilities (%)
Housing units lacking complete kitchen facilities (%)
Density of houses
Urban houses (%)
Rural houses (%)
Households with people 60 years and over (%)
Households with people 65 years and over (%)
Households with people 75 years and over (%)
Households with one or more nonrelatives (%)
Households with no nonrelatives (%)
Population in households (%)
Family households (%)
Nonfamily households (%)
Population in families (%)
Family households with own children (%)
Median number of bedrooms in owner occupied houses
Mean number of bedrooms in owner occupied houses
Median number of bedrooms in renter occupied houses
Mean number of bedrooms in renter occupied houses
Median number of vehichles in owner occupied houses
Mean number of vehichles in owner occupied houses
Median number of vehichles in renter occupied houses
Mean number of vehichles in renter occupied houses
Mortgage status - with mortgage (%)
Mortgage status - with second mortgage (%)
Mortgage status - with home equity loan (%)
Mortgage status - with both second mortgage and home equity loan (%)
Mortgage status - without a mortgage (%)
Average family size
Average family size - White
Average family size - Black or African American
Average family size - Asian
Average family size - Hispanic or Latino
Average family size - American Indian and Alaska Native
Average family size - Multirace
Average family size - Other Race
Geographical mobility - Same house 1 year ago (%)
Geographical mobility - Moved within same county (%)
Geographical mobility - Moved from different county within same state (%)
Geographical mobility - Moved from different state (%)
Geographical mobility - Moved from abroad (%)
Place of birth - Born in state of residence (%)
Place of birth - Born in other state (%)
Place of birth - Native, outside of US (%)
Place of birth - Foreign born (%)
Housing units in structures - 1, detached (%)
Housing units in structures - 1, attached (%)
Housing units in structures - 2 (%)
Housing units in structures - 3 or 4 (%)
Housing units in structures - 5 to 9 (%)
Housing units in structures - 10 to 19 (%)
Housing units in structures - 20 to 49 (%)
Housing units in structures - 50 or more (%)
Housing units in structures - Mobile home (%)
Housing units in structures - Boat, RV, van, etc. (%)
House/condo owner moved in on average (years ago)
Renter moved in on average (years ago)
Year householder moved into unit - Moved in 1999 to March 2000 (%)
Year householder moved into unit - Moved in 1995 to 1998 (%)
Year householder moved into unit - Moved in 1990 to 1994 (%)
Year householder moved into unit - Moved in 1980 to 1989 (%)
Year householder moved into unit - Moved in 1970 to 1979 (%)
Year householder moved into unit - Moved in 1969 or earlier (%)
Means of transportation to work - Drove car alone (%)
Means of transportation to work - Carpooled (%)
Means of transportation to work - Public transportation (%)
Means of transportation to work - Bus or trolley bus (%)
Means of transportation to work - Streetcar or trolley car (%)
Means of transportation to work - Subway or elevated (%)
Means of transportation to work - Railroad (%)
Means of transportation to work - Ferryboat (%)
Means of transportation to work - Taxicab (%)
Means of transportation to work - Motorcycle (%)
Means of transportation to work - Bicycle (%)
Means of transportation to work - Walked (%)
Means of transportation to work - Other means (%)
Working at home (%)
Industry diversity
Most Common Industries - Agriculture, forestry, fishing and hunting, and mining (%)
Most Common Industries - Agriculture, forestry, fishing and hunting (%)
Most Common Industries - Mining, quarrying, and oil and gas extraction (%)
Most Common Industries - Construction (%)
Most Common Industries - Manufacturing (%)
Most Common Industries - Wholesale trade (%)
Most Common Industries - Retail trade (%)
Most Common Industries - Transportation and warehousing, and utilities (%)
Most Common Industries - Transportation and warehousing (%)
Most Common Industries - Utilities (%)
Most Common Industries - Information (%)
Most Common Industries - Finance and insurance, and real estate and rental and leasing (%)
Most Common Industries - Finance and insurance (%)
Most Common Industries - Real estate and rental and leasing (%)
Most Common Industries - Professional, scientific, and management, and administrative and waste management services (%)
Most Common Industries - Professional, scientific, and technical services (%)
Most Common Industries - Management of companies and enterprises (%)
Most Common Industries - Administrative and support and waste management services (%)
Most Common Industries - Educational services, and health care and social assistance (%)
Most Common Industries - Educational services (%)
Most Common Industries - Health care and social assistance (%)
Most Common Industries - Arts, entertainment, and recreation, and accommodation and food services (%)
Most Common Industries - Arts, entertainment, and recreation (%)
Most Common Industries - Accommodation and food services (%)
Most Common Industries - Other services, except public administration (%)
Most Common Industries - Public administration (%)
Occupation diversity
Most Common Occupations - Management, business, science, and arts occupations (%)
Most Common Occupations - Management, business, and financial occupations (%)
Most Common Occupations - Management occupations (%)
Most Common Occupations - Business and financial operations occupations (%)
Most Common Occupations - Computer, engineering, and science occupations (%)
Most Common Occupations - Computer and mathematical occupations (%)
Most Common Occupations - Architecture and engineering occupations (%)
Most Common Occupations - Life, physical, and social science occupations (%)
Most Common Occupations - Education, legal, community service, arts, and media occupations (%)
Most Common Occupations - Community and social service occupations (%)
Most Common Occupations - Legal occupations (%)
Most Common Occupations - Education, training, and library occupations (%)
Most Common Occupations - Arts, design, entertainment, sports, and media occupations (%)
Most Common Occupations - Healthcare practitioners and technical occupations (%)
Most Common Occupations - Health diagnosing and treating practitioners and other technical occupations (%)
Most Common Occupations - Health technologists and technicians (%)
Most Common Occupations - Service occupations (%)
Most Common Occupations - Healthcare support occupations (%)
Most Common Occupations - Protective service occupations (%)
Most Common Occupations - Fire fighting and prevention, and other protective service workers including supervisors (%)
Most Common Occupations - Law enforcement workers including supervisors (%)
Most Common Occupations - Food preparation and serving related occupations (%)
Most Common Occupations - Building and grounds cleaning and maintenance occupations (%)
Most Common Occupations - Personal care and service occupations (%)
Most Common Occupations - Sales and office occupations (%)
Most Common Occupations - Sales and related occupations (%)
Most Common Occupations - Office and administrative support occupations (%)
Most Common Occupations - Natural resources, construction, and maintenance occupations (%)
Most Common Occupations - Farming, fishing, and forestry occupations (%)
Most Common Occupations - Construction and extraction occupations (%)
Most Common Occupations - Installation, maintenance, and repair occupations (%)
Most Common Occupations - Production, transportation, and material moving occupations (%)
Most Common Occupations - Production occupations (%)
Most Common Occupations - Transportation occupations (%)
Most Common Occupations - Material moving occupations (%)
People in Group quarters - Institutionalized population (%)
People in Group quarters - Correctional institutions (%)
People in Group quarters - Federal prisons and detention centers (%)
People in Group quarters - Halfway houses (%)
People in Group quarters - Local jails and other confinement facilities (including police lockups) (%)
People in Group quarters - Military disciplinary barracks (%)
People in Group quarters - State prisons (%)
People in Group quarters - Other types of correctional institutions (%)
People in Group quarters - Nursing homes (%)
People in Group quarters - Hospitals/wards, hospices, and schools for the handicapped (%)
People in Group quarters - Hospitals/wards and hospices for chronically ill (%)
People in Group quarters - Hospices or homes for chronically ill (%)
People in Group quarters - Military hospitals or wards for chronically ill (%)
People in Group quarters - Other hospitals or wards for chronically ill (%)
People in Group quarters - Hospitals or wards for drug/alcohol abuse (%)
People in Group quarters - Mental (Psychiatric) hospitals or wards (%)
People in Group quarters - Schools, hospitals, or wards for the mentally retarded (%)
People in Group quarters - Schools, hospitals, or wards for the physically handicapped (%)
People in Group quarters - Institutions for the deaf (%)
People in Group quarters - Institutions for the blind (%)
People in Group quarters - Orthopedic wards and institutions for the physically handicapped (%)
People in Group quarters - Wards in general hospitals for patients who have no usual home elsewhere (%)
People in Group quarters - Wards in military hospitals for patients who have no usual home elsewhere (%)
People in Group quarters - Juvenile institutions (%)
People in Group quarters - Long-term care (%)
People in Group quarters - Homes for abused, dependent, and neglected children (%)
People in Group quarters - Residential treatment centers for emotionally disturbed children (%)
People in Group quarters - Training schools for juvenile delinquents (%)
People in Group quarters - Short-term care, detention or diagnostic centers for delinquent children (%)
People in Group quarters - Type of juvenile institution unknown (%)
People in Group quarters - Noninstitutionalized population (%)
People in Group quarters - College dormitories (includes college quarters off campus) (%)
People in Group quarters - Military quarters (%)
People in Group quarters - On base (%)
People in Group quarters - Barracks, unaccompanied personnel housing (UPH), (Enlisted/Officer), ;and similar group living quarters for military personnel (%)
People in Group quarters - Transient quarters for temporary residents (%)
People in Group quarters - Military ships (%)
People in Group quarters - Group homes (%)
People in Group quarters - Homes or halfway houses for drug/alcohol abuse (%)
People in Group quarters - Homes for the mentally ill (%)
People in Group quarters - Homes for the mentally retarded (%)
People in Group quarters - Homes for the physically handicapped (%)
People in Group quarters - Other group homes (%)
People in Group quarters - Religious group quarters (%)
People in Group quarters - Dormitories (%)
People in Group quarters - Agriculture workers' dormitories on farms (%)
People in Group quarters - Job Corps and vocational training facilities (%)
People in Group quarters - Other workers' dormitories (%)
People in Group quarters - Crews of maritime vessels (%)
People in Group quarters - Other nonhousehold living situations (%)
People in Group quarters - Other noninstitutional group quarters (%)
Residents speaking English at home (%)
Residents speaking English at home - Born in the United States (%)
Residents speaking English at home - Native, born elsewhere (%)
Residents speaking English at home - Foreign born (%)
Residents speaking Spanish at home (%)
Residents speaking Spanish at home - Born in the United States (%)
Residents speaking Spanish at home - Native, born elsewhere (%)
Residents speaking Spanish at home - Foreign born (%)
Residents speaking other language at home (%)
Residents speaking other language at home - Born in the United States (%)
Residents speaking other language at home - Native, born elsewhere (%)
Residents speaking other language at home - Foreign born (%)
Class of Workers - Employee of private company (%)
Class of Workers - Self-employed in own incorporated business (%)
Class of Workers - Private not-for-profit wage and salary workers (%)
Class of Workers - Local government workers (%)
Class of Workers - State government workers (%)
Class of Workers - Federal government workers (%)
Class of Workers - Self-employed workers in own not incorporated business and Unpaid family workers (%)
House heating fuel used in houses and condos - Utility gas (%)
House heating fuel used in houses and condos - Bottled, tank, or LP gas (%)
House heating fuel used in houses and condos - Electricity (%)
House heating fuel used in houses and condos - Fuel oil, kerosene, etc. (%)
House heating fuel used in houses and condos - Coal or coke (%)
House heating fuel used in houses and condos - Wood (%)
House heating fuel used in houses and condos - Solar energy (%)
House heating fuel used in houses and condos - Other fuel (%)
House heating fuel used in houses and condos - No fuel used (%)
House heating fuel used in apartments - Utility gas (%)
House heating fuel used in apartments - Bottled, tank, or LP gas (%)
House heating fuel used in apartments - Electricity (%)
House heating fuel used in apartments - Fuel oil, kerosene, etc. (%)
House heating fuel used in apartments - Coal or coke (%)
House heating fuel used in apartments - Wood (%)
House heating fuel used in apartments - Solar energy (%)
House heating fuel used in apartments - Other fuel (%)
House heating fuel used in apartments - No fuel used (%)
Armed forces status - In Armed Forces (%)
Armed forces status - Civilian (%)
Armed forces status - Civilian - Veteran (%)
Armed forces status - Civilian - Nonveteran (%)
Fatal accidents locations in years 2005-2021
Fatal accidents locations in 2005
Fatal accidents locations in 2006
Fatal accidents locations in 2007
Fatal accidents locations in 2008
Fatal accidents locations in 2009
Fatal accidents locations in 2010
Fatal accidents locations in 2011
Fatal accidents locations in 2012
Fatal accidents locations in 2013
Fatal accidents locations in 2014
Fatal accidents locations in 2015
Fatal accidents locations in 2016
Fatal accidents locations in 2017
Fatal accidents locations in 2018
Fatal accidents locations in 2019
Fatal accidents locations in 2020
Fatal accidents locations in 2021
Alcohol use - People drinking some alcohol every month (%)
Alcohol use - People not drinking at all (%)
Alcohol use - Average days/month drinking alcohol
Alcohol use - Average drinks/week
Alcohol use - Average days/year people drink much
Audiometry - Average condition of hearing (%)
Audiometry - People that can hear a whisper from across a quiet room (%)
Audiometry - People that can hear normal voice from across a quiet room (%)
Audiometry - Ears ringing, roaring, buzzing (%)
Audiometry - Had a job exposure to loud noise (%)
Audiometry - Had off-work exposure to loud noise (%)
Blood Pressure & Cholesterol - Has high blood pressure (%)
Blood Pressure & Cholesterol - Checking blood pressure at home (%)
Blood Pressure & Cholesterol - Frequently checking blood cholesterol (%)
Blood Pressure & Cholesterol - Has high cholesterol level (%)
Consumer Behavior - Money monthly spent on food at supermarket/grocery store
Consumer Behavior - Money monthly spent on food at other stores
Consumer Behavior - Money monthly spent on eating out
Consumer Behavior - Money monthly spent on carryout/delivered foods
Consumer Behavior - Income spent on food at supermarket/grocery store (%)
Consumer Behavior - Income spent on food at other stores (%)
Consumer Behavior - Income spent on eating out (%)
Consumer Behavior - Income spent on carryout/delivered foods (%)
Current Health Status - General health condition (%)
Current Health Status - Blood donors (%)
Current Health Status - Has blood ever tested for HIV virus (%)
Current Health Status - Left-handed people (%)
Dermatology - People using sunscreen (%)
Diabetes - Diabetics (%)
Diabetes - Had a blood test for high blood sugar (%)
Diabetes - People taking insulin (%)
Diet Behavior & Nutrition - Diet health (%)
Diet Behavior & Nutrition - Milk product consumption (# of products/month)
Diet Behavior & Nutrition - Meals not home prepared (#/week)
Diet Behavior & Nutrition - Meals from fast food or pizza place (#/week)
Diet Behavior & Nutrition - Ready-to-eat foods (#/month)
Diet Behavior & Nutrition - Frozen meals/pizza (#/month)
Drug Use - People that ever used marijuana or hashish (%)
Drug Use - Ever used hard drugs (%)
Drug Use - Ever used any form of cocaine (%)
Drug Use - Ever used heroin (%)
Drug Use - Ever used methamphetamine (%)
Health Insurance - People covered by health insurance (%)
Kidney Conditions-Urology - Avg. # of times urinating at night
Medical Conditions - People with asthma (%)
Medical Conditions - People with anemia (%)
Medical Conditions - People with psoriasis (%)
Medical Conditions - People with overweight (%)
Medical Conditions - Elderly people having difficulties in thinking or remembering (%)
Medical Conditions - People who ever received blood transfusion (%)
Medical Conditions - People having trouble seeing even with glass/contacts (%)
Medical Conditions - People with arthritis (%)
Medical Conditions - People with gout (%)
Medical Conditions - People with congestive heart failure (%)
Medical Conditions - People with coronary heart disease (%)
Medical Conditions - People with angina pectoris (%)
Medical Conditions - People who ever had heart attack (%)
Medical Conditions - People who ever had stroke (%)
Medical Conditions - People with emphysema (%)
Medical Conditions - People with thyroid problem (%)
Medical Conditions - People with chronic bronchitis (%)
Medical Conditions - People with any liver condition (%)
Medical Conditions - People who ever had cancer or malignancy (%)
Mental Health - People who have little interest in doing things (%)
Mental Health - People feeling down, depressed, or hopeless (%)
Mental Health - People who have trouble sleeping or sleeping too much (%)
Mental Health - People feeling tired or having little energy (%)
Mental Health - People with poor appetite or overeating (%)
Mental Health - People feeling bad about themself (%)
Mental Health - People who have trouble concentrating on things (%)
Mental Health - People moving or speaking slowly or too fast (%)
Mental Health - People having thoughts they would be better off dead (%)
Oral Health - Average years since last visit a dentist
Oral Health - People embarrassed because of mouth (%)
Oral Health - People with gum disease (%)
Oral Health - General health of teeth and gums (%)
Oral Health - Average days a week using dental floss/device
Oral Health - Average days a week using mouthwash for dental problem
Oral Health - Average number of teeth
Pesticide Use - Households using pesticides to control insects (%)
Pesticide Use - Households using pesticides to kill weeds (%)
Physical Activity - People doing vigorous-intensity work activities (%)
Physical Activity - People doing moderate-intensity work activities (%)
Physical Activity - People walking or bicycling (%)
Physical Activity - People doing vigorous-intensity recreational activities (%)
Physical Activity - People doing moderate-intensity recreational activities (%)
Physical Activity - Average hours a day doing sedentary activities
Physical Activity - Average hours a day watching TV or videos
Physical Activity - Average hours a day using computer
Physical Functioning - People having limitations keeping them from working (%)
Physical Functioning - People limited in amount of work they can do (%)
Physical Functioning - People that need special equipment to walk (%)
Physical Functioning - People experiencing confusion/memory problems (%)
Physical Functioning - People requiring special healthcare equipment (%)
Prescription Medications - Average number of prescription medicines taking
Preventive Aspirin Use - Adults 40+ taking low-dose aspirin (%)
Reproductive Health - Vaginal deliveries (%)
Reproductive Health - Cesarean deliveries (%)
Reproductive Health - Deliveries resulted in a live birth (%)
Reproductive Health - Pregnancies resulted in a delivery (%)
Reproductive Health - Women breastfeeding newborns (%)
Reproductive Health - Women that had a hysterectomy (%)
Reproductive Health - Women that had both ovaries removed (%)
Reproductive Health - Women that have ever taken birth control pills (%)
Reproductive Health - Women taking birth control pills (%)
Reproductive Health - Women that have ever used Depo-Provera or injectables (%)
Reproductive Health - Women that have ever used female hormones (%)
Sexual Behavior - People 18+ that ever had sex (vaginal, anal, or oral) (%)
Sexual Behavior - Males 18+ that ever had vaginal sex with a woman (%)
Sexual Behavior - Males 18+ that ever performed oral sex on a woman (%)
Sexual Behavior - Males 18+ that ever had anal sex with a woman (%)
Sexual Behavior - Males 18+ that ever had any sex with a man (%)
Sexual Behavior - Females 18+ that ever had vaginal sex with a man (%)
Sexual Behavior - Females 18+ that ever performed oral sex on a man (%)
Sexual Behavior - Females 18+ that ever had anal sex with a man (%)
Sexual Behavior - Females 18+ that ever had any kind of sex with a woman (%)
Sexual Behavior - Average age people first had sex
Sexual Behavior - Average number of female sex partners in lifetime (males 18+)
Sexual Behavior - Average number of female vaginal sex partners in lifetime (males 18+)
Sexual Behavior - Average age people first performed oral sex on a woman (18+)
Sexual Behavior - Average number of woman performed oral sex on in lifetime (18+)
Sexual Behavior - Average number of male sex partners in lifetime (males 18+)
Sexual Behavior - Average number of male anal sex partners in lifetime (males 18+)
Sexual Behavior - Average age people first performed oral sex on a man (18+)
Sexual Behavior - Average number of male oral sex partners in lifetime (18+)
Sexual Behavior - People using protection when performing oral sex (%)
Sexual Behavior - Average number of times people have vaginal or anal sex a year
Sexual Behavior - People having sex without condom (%)
Sexual Behavior - Average number of male sex partners in lifetime (females 18+)
Sexual Behavior - Average number of male vaginal sex partners in lifetime (females 18+)
Sexual Behavior - Average number of female sex partners in lifetime (females 18+)
Sexual Behavior - Circumcised males 18+ (%)
Sleep Disorders - Average hours sleeping at night
Sleep Disorders - People that has trouble sleeping (%)
Smoking-Cigarette Use - People smoking cigarettes (%)
Taste & Smell - People 40+ having problems with smell (%)
Taste & Smell - People 40+ having problems with taste (%)
Taste & Smell - People 40+ that ever had wisdom teeth removed (%)
Taste & Smell - People 40+ that ever had tonsils teeth removed (%)
Taste & Smell - People 40+ that ever had a loss of consciousness because of a head injury (%)
Taste & Smell - People 40+ that ever had a broken nose or other serious injury to face or skull (%)
Taste & Smell - People 40+ that ever had two or more sinus infections (%)
Weight - Average height (inches)
Weight - Average weight (pounds)
Weight - Average BMI
Weight - People that are obese (%)
Weight - People that ever were obese (%)
Weight - People trying to lose weight (%)
100%
urban population.
Median resident age: This zip code:
34.0 yearsNew York median age:
40.0 years
Average household size: This zip code:
1.5 peopleNew York:
2.5 people
Averages for the 2020 tax year for zip code 12207, filed in 2021:
Average Adjusted Gross Income (AGI) in 2020: $49,566 (Individual Income Tax Returns) Here:
$49,566State:
$90,930
Salary/wage: $42,277 (reported on 91.5% of returns )Here:
$42,277State:
$72,104
(% of AGI for various income ranges: 1189.7% for AGIs below $25k , 3669.6% for AGIs $25k-50k , 8196.2% for AGIs $50k-75k , 11826.0% for AGIs $75k-100k , 22186.0% for AGIs $100k-200k ) Taxable interest for individuals: $573 (reported on 14.2% of returns )This zip code:
$573New York:
$3,075
(% of AGI for various income ranges: 0.9% for AGIs below $25k , 2.7% for AGIs $25k-50k , 7.7% for AGIs $50k-75k , 132.0% for AGIs $100k-200k ) Ordinary dividends: $3,300 (reported on 8.5% of returns )(% of AGI for various income ranges: 29.2% for AGIs $50k-75k , 518.0% for AGIs $100k-200k ) Net capital gain/loss in AGI: +$9,842 (reported on 11.3% of returns )Here:
+$9,842State:
+$44,925
(% of AGI for various income ranges: 7.8% for AGIs below $25k , 43.1% for AGIs $50k-75k , 2200.0% for AGIs $100k-200k ) Profit/loss from business: +$8,767 (reported on 8.5% of returns )Here:
+$8,767State:
+$14,940
(% of AGI for various income ranges: 71.9% for AGIs below $25k , 77.3% for AGIs $25k-50k , 275.4% for AGIs $50k-75k ) Total itemized deductions: $35,700 (reported on 1.9% of returns )Here:
$35,700State:
$39,326
(% of AGI for various income ranges: 274.6% for AGIs $25k-50k ) Taxes paid: $5,100 (reported on 2.8% of returns )(% of AGI for various income ranges: 58.8% for AGIs $25k-50k ) Earned income credit: $2,093 (reported on 26.4% of returns )(% of AGI for various income ranges: 127.8% for AGIs below $25k , 68.1% for AGIs $25k-50k ) Percentage of individuals using paid preparers for their 2020 taxes: 96.2%(% for various income ranges: 95.0% for AGIs below $25k , 96.8% for AGIs $25k-50k , 94.4% for AGIs $50k-75k , 100.0% for AGIs $75k-100k , 100.0% for AGIs $100k-200k )
Averages for the 2012 tax year for zip code 12207, filed in 2013:
Average Adjusted Gross Income (AGI) in 2012: $28,052 (Individual Income Tax Returns) Here:
$28,052State:
$77,088
Salary/wage: $23,180 (reported on 84.5% of returns )Here:
$23,180State:
$60,593
(% of AGI for various income ranges: 80.8% for AGIs below $25k , 88.3% for AGIs $25k-50k , 84.8% for AGIs $50k-75k , 167.2% for AGIs $75k-100k ) Taxable interest for individuals: $660 (reported on 14.1% of returns )This zip code:
$660New York:
$3,125
(% of AGI for various income ranges: 0.3% for AGIs below $25k , 0.4% for AGIs $25k-50k , 1.8% for AGIs $75k-100k ) Ordinary dividends: $5,000 (reported on 7.0% of returns )Net capital gain/loss in AGI: +$1,275 (reported on 5.6% of returns )Here:
+$1,275State:
+$42,474
Profit/loss from business: +$8,100 (reported on 8.5% of returns )Here:
+$8,100State:
+$16,168
Total itemized deductions: $26,550 (28% of AGI, reported on 11.3% of returns )Here:
$26,550State:
$34,985
Here:
27.7% of AGIState:
21.3% of AGI
(% of AGI for various income ranges: 11.0% for AGIs $25k-50k , 24.3% for AGIs $50k-75k , 19.4% for AGIs $100k-200k ) Charity contributions: $2,075 (reported on 5.6% of returns )Taxes paid: $7,288 (reported on 11.3% of returns )12207:
$7,288State:
$18,656
(% of AGI for various income ranges: 1.7% for AGIs $25k-50k , 6.1% for AGIs $50k-75k , 6.9% for AGIs $100k-200k ) Earned income credit: $1,967 (reported on 42.3% of returns )(% of AGI for various income ranges: 8.9% for AGIs below $25k , 1.7% for AGIs $25k-50k ) Percentage of individuals using paid preparers for their 2012 taxes: 46.5%(% for various income ranges: 44.7% for AGIs below $25k , 46.7% for AGIs $25k-50k , 75.0% for AGIs $50k-75k , 66.7% for AGIs $100k-200k )
Averages for the 2004 tax year for zip code 12207, filed in 2005:
Average Adjusted Gross Income (AGI) in 2004: $35,079 (Individual Income Tax Returns) Here:
$35,079State:
$59,519
Salary/wage: $22,064 (reported on 88.2% of returns )Here:
$22,064State:
$50,673
(% of AGI for various income ranges: 82.2% for AGIs below $10k , 89.6% for AGIs $10k-25k , 88.7% for AGIs $25k-50k , 81.5% for AGIs $50k-75k , 23.8% for AGIs over 100k ) Taxable interest for individuals: $2,056 (reported on 17.5% of returns )This zip code:
$2,056New York:
$2,377
(% of AGI for various income ranges: 2.6% for AGIs below $10k , 0.3% for AGIs $10k-25k , 0.7% for AGIs $25k-50k , 2.7% for AGIs $50k-75k , 1.0% for AGIs over 100k ) Taxable dividends: $10,574 (reported on 7.6% of returns )Net capital gain/loss: +$55,372 (reported on 6.0% of returns )Here:
+$55,372State:
+$23,581
Profit/loss from business: +$12,000 (reported on 6.3% of returns )Here:
+$12,000State:
+$13,809
Total itemized deductions: $54,081 (24% of AGI, reported on 8.7% of returns )Here:
$54,081State:
$25,864
Here:
23.9% of AGIState:
21.9% of AGI
(% of AGI for various income ranges: 2.7% for AGIs $10k-25k , 10.9% for AGIs $25k-50k , 7.7% for AGIs $50k-75k , 20.7% for AGIs over 100k ) Charity contributions deductions: $7,340 (3% of AGI, reported on 7.0% of returns )Here:
3.4% of AGIState:
3.6% of AGI
Total tax: $7,595 (reported on 50.2% of returns )12207:
$7,595State:
$11,730
(% of AGI for various income ranges: 1.5% for AGIs below $10k , 3.3% for AGIs $10k-25k , 6.8% for AGIs $25k-50k , 11.0% for AGIs $50k-75k , 16.2% for AGIs over 100k ) Earned income credit: $1,742 (reported on 45.7% of returns )Percentage of individuals using paid preparers for their 2004 taxes: 66.2%(% for various income ranges: 59.2% for AGIs below $10k , 69.9% for AGIs $10k-25k , 66.2% for AGIs $25k-50k , 70.4% for AGIs $50k-75k , 89.5% for AGIs over 100k )
Estimated median household income in 2022: This zip code:
$44,655New York:
$79,557
Nearest zip codes: 12210 ,
12202 ,
12204 ,
12206 ,
12144 ,
12209 .
Albany Zip Code Map
Percentage of family households: This zip code:
19.1%New York:
41.3%
Percentage of households with unmarried partners: This zip code:
7.7%New York:
42.3%
Likely homosexual households (counted as self-reported same-sex unmarried-partner households)
Lesbian couples: 0.5% of all households Gay men: 0.0% of all households
Household received Food Stamps/SNAP in the past 12 months: 553Household did not receive Food Stamps/SNAP in the past 12 months: 825
Women who had a birth in the past 12 months: 19 (19 now married , 0 unmarried) Women who did not have a birth in the past 12 months: 517 (101 now married , 419 unmarried)
Housing units in zip code 12207 with a mortgage: 7 (6
second mortgage , 6
both second mortgage and home equity loan )
Residents with income below the poverty level in 2022:
This zip code:
44.9%Whole state:
14.3%
Residents with income below 50% of the poverty level in 2022:
This zip code:
11.5%Whole state:
6.8%
Median number of rooms in houses and condos: Median number of rooms in apartments: Notable locations in this zip code not listed on our city pages
Click to draw/clear zip code borders Notable locations in zip code 12207: (A) , Times Union Center (B) , Leo W O'Brien Federal Building (C) , Kennedy Building (D) , State Hall (E) , Albany City Hall (F) , Albany Board of Education (G) , New York State Capitol Building (H) , The Egg Performing Arts Center (I) , Erastus Corning Tower (J) . Display/hide their locations on the map
Shopping Center: (1) . Display/hide its location on the map
Churches in zip code 12207 include: (A) , Saint Peter's Episcopal Church (B) , Saint Mary's Roman Catholic Church (C) . Display/hide their locations on the map
Parks in zip code 12207 include: (1) , Academy Park (2) , Capitol Park (3) . Display/hide their locations on the map
Year house built (houses)
0 2020 or later315 2010 to 20192 2000 to 200936 1990 to 1999277 1980 to 1989384 1970 to 197986 1960 to 196937 1950 to 195950 1940 to 1949450 1939 or earlier
Zip code 12207 household income distribution in 2022 319 Less than $10,000122 $10,000 to $14,99996 $15,000 to $19,99953 $20,000 to $24,99955 $25,000 to $29,9996 $30,000 to $34,99925 $35,000 to $39,99928 $40,000 to $44,99938 $45,000 to $49,999166 $50,000 to $59,99980 $60,000 to $74,99988 $75,000 to $99,999180 $100,000 to $124,99920 $125,000 to $149,99925 $150,000 to $199,99963 $200,000 or moreEstimate of home value of owner-occupied houses/condos in 2022 in zip code 12207 14 $90,000 to $99,9998 $175,000 to $199,9997 $300,000 to $399,999Rent paid by renters in 2022 in zip code 12207 129 $100 to $14926 $200 to $249142 $250 to $299111 $300 to $34916 $350 to $39940 $400 to $4499 $450 to $4992 $500 to $54985 $550 to $59927 $600 to $64916 $650 to $69910 $700 to $74914 $800 to $89978 $900 to $999112 $1,000 to $1,249109 $1,250 to $1,499243 $1,500 to $1,99970 $2,000 to $2,4996 $2,500 to $2,9997 No cash rent
Median gross rent in 2022: $823.
Median price asked for vacant for-sale houses and condos in 2022: $122,527.
Estimated median house (or condo) value in 2022 for: White Non-Hispanic householders: $221,100Mean price in 2022: Detached houses: $306,005Here:
$306,005State:
$476,719
Townhouses or other attached units: $195,436Here:
$195,436State:
$699,270
In 2-unit structures: $182,705Here:
$182,705State:
$713,077
In 3-to-4-unit structures: $108,970Here:
$108,970State:
$764,568
In 5-or-more-unit structures: $243,091Here:
$243,091State:
$912,009
Mobile homes: $68,381Here:
$68,381State:
$88,925
Housing units in structures:
One, detached: 9One, attached: 12Two: 573 or 4: 2165 to 9: 15310 to 19: 10520 to 49: 25650 or more: 793Unemployment : 2.6%
Means of transportation to work in zip code 12207 45.8% 538 Drove a car alone12.6% 148 Carpooled18.2% 214 Bus or trolley bus0.9% 10 Streetcar or trolley car10.5% 124 Walked12.9% 152 Worked at homeTravel time to work (commute) in zip code 12207 63 Less than 5 minutes217 5 to 9 minutes126 10 to 14 minutes191 15 to 19 minutes162 20 to 24 minutes143 30 to 34 minutes13 35 to 39 minutes49 40 to 44 minutes31 45 to 59 minutes18 90 or more minutes
Percentage of zip code residents living and working in this county: 99.5%
Household type by relationship:
Households: 2,299
Male householders: 692 (496 living alone ), Female householders: 646 (344 living alone )129 spouses (129 opposite-sex spouses ), 184 unmarried partners , (152 opposite-sex unmarried partners ), 295 children (296 natural , 0 adopted , 0 stepchildren ), 0 grandchildren , 16 brothers or sisters , 4 parents , 0 foster children , 0 other relatives , 60 non-relatives In group quarters: 338 (-1 institutionalized population )
Size of family households: 97 2-persons , 58 3-persons , 118 4-persons , 6 5-persons
Size of nonfamily households: 841 1-person , 230 2-persons , 16 3-persons
56 married couples with children. single-parent households (237 women ).
86.6% of residents of 12207 zip code speak English at home. of residents speak Spanish at home (37% very well, 50% well, 14% not well ).of residents speak other Indo-European language at home (100% very well ).of residents speak Asian or Pacific Island language at home (70% very well, 30% well ).of residents speak other language at home (73% very well, 27% well ).
Foreign born population: 98 (4.3%)
(61.2%
of them are naturalized citizens )
This zip code:
4.3%Whole state:
22.7%
17% Bosnia and Herzegovina 13% Colombia 12% Haiti 10% Barbados 8% Honduras 6% Dominica 5% Romania 9% Irish 7% American 5% Italian 5% English 1% German 1% Bulgarian 1% Polish
Year of entry for the foreign-born population
44 2010 or later 31 2000 to 2009 24 1990 to 1999 55 Before 1990
There are
71 Medical Specialists in Zip Code 12207 .
Major facilities with environmental interests located in this zip code:
CMP INDUSTRIES (413 N. PEARL ST. in ALBANY, NY)
AIR SYNTHETIC MINOR (AIRS/AFS) STATE MASTER (New York facility tracking) - AIR PROGRAM, HAZARDOUS WASTE PROGRAM (Integrated Compliance Information System) - ICIS-02-1994-0085, FORMAL ENFORCEMENT ACTION COMPLIANCE ACTIVITY (Tracking inspections of insecticide, fungicide, and rodenticide, and toxic substances) (Resource Conservation and Recovery Act (tracking hazardous waste)) TRI REPORTER (Tracking of toxic chemicals releasing facilities) Business SIC classification: PLASTICS MATERIALS, SYNTHETIC RESINS, AND NONVULCANIZABLE ELASTOMERS; PLASTICS PRODUCTS; DENTAL EQUIPMENT AND SUPPLIESBusiness NAICS classification: PLASTICS MATERIAL AND RESIN MANUFACTURING.Organizations: C M P INDUSTRIES INC (LEGALLY RESPONSIBLE PARTY)
Alternative names: C M P INDUSTRIES INC
ALBANY ACADEMY (ALBANY ST in ALBANY, NY)
(Integrated Compliance Information System) - ICIS-02-1987-0032, FORMAL ENFORCEMENT ACTION
ALBANY LABS (67 HOWARD ST in ALBANY, NY)
(Integrated Compliance Information System) - ICIS-02-1986-0168, FORMAL ENFORCEMENT ACTION
ADIRONDACK ENVIRONMENTAL SVC INC (314 N PEARL ST in ALBANY, NY)
ENFORCEMENT/COMPLIANCE ACTIVITY (Integrated Compliance Information System) COMPLIANCE ACTIVITY (Tracking inspections of insecticide, fungicide, and rodenticide, and toxic substances) Small Quantity Generators, between 100 kg and 1000 kg of hazardous waste/month (Resource Conservation and Recovery Act (tracking hazardous waste)) - notification Business SIC classification: BUSINESS SERVICESOrganizations: PAUL BATISTA (CONTACT/OWNER)
ALBANY NY LL CENTRAL OFFICE (158 STATE ST in ALBANY, NY)
(Resource Conservation and Recovery Act (tracking hazardous waste)) Organizations: OWNERNAME (CONTACT/OWNER)
ALBANK FSB (833 BROADWAY in ALBANY, NY)
Small Quantity Generators, between 100 kg and 1000 kg of hazardous waste/month (Resource Conservation and Recovery Act (tracking hazardous waste)) - notification TRANSPORTER (Resource Conservation and Recovery Act (tracking hazardous waste)) - notification Organizations: ALBANK FINANCIAL CORP (CONTACT/OWNER)
ALBANY PUBLIC SCHOOLS (ACADEMY PARK & ELK ST COR OF in ALBANY, NY)
(Resource Conservation and Recovery Act (tracking hazardous waste))
ASSOCIATED PRESS AT THE KN THE (51 S PEARL ST in ALBANY, NY)
(Resource Conservation and Recovery Act (tracking hazardous waste))
GOODRICH DISPLAYS INC (350 BROADWAY in ALBANY, NY)
(Resource Conservation and Recovery Act (tracking hazardous waste))
GREYHOUND LINES INC #150051 (34 HAMILTON ST in ALBANY, NY)
(Resource Conservation and Recovery Act (tracking hazardous waste))
HOTEL WELLINGTON (136 STATE ST in ALBANY, NY)
AIR MINOR (AIRS/AFS) Business SIC classification: HOTELS AND MOTELS
HUDSON SCRAP IRON & METAL CO (11 N FERRY ST in ALBANY, NY)
(Resource Conservation and Recovery Act (tracking hazardous waste))
ALBANY COUNTY SPRUCE STREET GARAGE (3 SPRUCE ST in ALBANY, NY)
Small Quantity Generators, between 100 kg and 1000 kg of hazardous waste/month (Resource Conservation and Recovery Act (tracking hazardous waste)) - notification Organizations: ALBANY COUNTY GENERAL SERVICES (CONTACT/OWNER)
Housing units lacking complete plumbing facilities: 0.4%
Housing units lacking complete kitchen facilities: 3.3%
68.4% Electricity 29.6% Utility gas 1.1% Bottled, tank, or LP gas 1.0% No fuel used
Population in 1990: 2,709.
Place of birth for U.S.-born residents:
This state: 1,909Northeast: 77Midwest: 22South: 107West: 19
54% of the 12207 zip code residents lived in the same house 5 years ago.
Out of people who lived in different houses, 67% lived in this county.
Out of people who lived in different counties, 50% lived in New York.
84% of the 12207 zip code residents lived in the same house 1 year ago.
Out of people who lived in different houses, 53% moved from this county.
Out of people who lived in different houses, 24% moved from different county within same state.
Out of people who lived in different houses, 20% moved from different state.
Out of people who lived in different houses, 3% moved from abroad.
Private vs. public school enrollment:
Students in private schools in grades 1 to 8 (elementary and middle school):
Students in private undergraduate colleges: 27
Occupation by median earnings in the past 12 months ($)
112,856 Legal occupations 105,709 Sales and related occupations 97,551 Arts, design, entertainment, sports, and media occupations 89,132 Business and financial operations occupations 53,315 Computer and mathematical occupations 46,126 Management occupations
Companies with federal contracts located in this zip code (ALBANY, NY):
NEW YORK STATE DEPT. OF HEALTH (STATE CAPITOL) employees , $0 revenue : $2,299,305 in 18 contracts from 2000 to 2005
Contracts for Other Quality Control, Testing and Inspection Services -- Miscellaneous, Program Evaluation Services, Other Professional Services by Food and Drug Administration, Food and Nutrition Service, Food and Nutrition Service (disused code, now 12F2)Signed by year: 2000: $550,770; 2001: $727,000; 2002: $571,000; 2003: $450,535; 2004: $0; 2005: $0; 2006: $0.
Biggest contracts: with Food and Drug Administration for Other Quality Control, Testing and Inspection Services -- Miscellaneous. Signed on 2003-08-15. Completion date: 2004-07-15.
, same as above. Signed on 2001-08-15. Completion date: 2002-07-15.
, same as above. Signed on 2002-07-15. Completion date: 2003-07-15.
, same as above. Signed on 2000-07-15. Completion date: 2001-07-15.
CYBER SECURITY & CRITICAL INFR (30 SOUTH PEARL ST) in 2 contracts from 2005 to 2006
$914,992 with Department of Defense for Other ADP and Telecommunications Services (includes data storage on tapes, compact disks, etc.). Signed on 2005-07-13. Completion date: 2006-04-12.
with Army for Aerial Photographic Services. Signed on 2006-03-24. Completion date: 2007-04-02.
SMG (51 S PEARL ST) in 3 contracts in 2004
$350,730 with Army for Construction of Structures and Facilities -- Museums and Exhibition Buildings. Taking place in VA. Signed on 2004-05-10. Completion date: 2004-09-25.
, same as above. Signed on 2004-09-24. Completion date: 2004-09-25.
, same as above. Signed on 2004-07-28. Completion date: 2004-09-25.
VICTORY CHILD CARE INC (1 CLINTON AVE; small business) in 6 contracts from 2000 to 2005
Contracts for Recreational Services by ArmySigned by year: 2000: $33,300; 2001: $34,000; 2002: $39,400; 2003: $39,000; 2004: $47,000; 2005: $49,500; 2006: $0.
Biggest contracts: with Army for Recreational Services. Signed on 2005-04-19. Completion date: 2005-09-02.
, same as above. Signed on 2004-03-17. Completion date: 2004-09-02.
, same as above. Signed on 2002-03-21. Completion date: 2002-08-30.
, same as above. Signed on 2003-03-24. Completion date: 2003-08-29.
ALL-LIFTS, INC (27-39 THATCHER ST; small business) in 12 contracts from 2002 to 2006
Contracts for Maintenance, Repair and Rebuilding of Equipment -- Materials Handling Equipment, Hardware, Commercial, Maintenance, Repair or Alteration of Real Property -- Production Buildings, Installation of Equipment -- Construction and Building Materials, and more by ArmySigned by year: 2000: $0; 2001: $0; 2002: $83,500; 2003: $1,000; 2004: $25,850; 2005: $64,322; 2006: $9,100.
Biggest contracts: with Army for Maintenance, Repair and Rebuilding of Equipment -- Materials Handling Equipment. Signed on 2002-08-08. Completion date: 2002-09-15.
with Army for Hardware, Commercial. Signed on 2005-03-15. Completion date: 2005-03-31.
with Army for Maintenance, Repair or Alteration of Real Property -- Production Buildings. Signed on 2002-03-01. Completion date: 2002-03-15.
with Army for Installation of Equipment -- Construction and Building Materials. Signed on 2004-08-16. Completion date: 2004-10-28.
ADIRONDACK ENVIRONMENTAL SERVI (314 N PEARL ST; small business) in 25 contracts from 2003 to 2006
Contracts for Hazardous Substance Analysis, Other Environmental Services, Studies, and Analytical Support, Engineering and Technical Services, Air Quality Support Services by ArmySigned by year: 2000: $0; 2001: $0; 2002: $0; 2003: -$9,452; 2004: $42,857; 2005: $27,000; 2006: $0.
Biggest contracts: with Army for Hazardous Substance Analysis. Signed on 2005-12-20. Completion date: 2006-09-30.
with Army for Other Environmental Services, Studies, and Analytical Support. Signed on 2004-10-08. Completion date: 2005-09-30.
with Army for Engineering and Technical Services. Signed on 2005-09-27. Completion date: 2006-09-30.
, same as above. Signed on 2004-08-26. Completion date: 2004-09-01.
FAMILY DANZ HEATING & AIR COND (404 NORTH PEARL ST; small business) in 2 contracts from 2002 to 2003
$24,995 with Army for Maintenance, Repair or Alteration of Real Property -- Miscellaneous Buildings. Signed on 2003-06-26. Completion date: 2003-07-14.
with U.S. Army Corps of Engineers - civil program financing only for Space and Water Heating Equipment. Signed on 2002-06-21. Completion date: 2002-04-30.
AMERICAN BOILER, TANK & WELDIN (53 PLEASANT ST; small business)
$30,190 with Army for Facilities Operations Support Services. Signed on 2005-12-27. Completion date: 2006-03-12.
ADIRONDACK MANUFACTURING CORPO (2 TIVOLI ST; small business)
$26,585 with Army for Maintenance, Repair or Alteration of Real Property -- Family Housing Facilities. Signed on 2000-09-26. Completion date: 2000-10-31.
ALL TYPE PROFESSIONAL DOOR SVC (405 NORTH PEARL ST; small business) in 2 contracts from 2002 to 2003
$15,675 with Navy for Maintenance, Repair or Alteration of Real Property -- Other Administrative Facilities and Service Buildings. Signed on 2002-07-24. Completion date: 2002-08-23.
, same as above. Signed on 2003-04-08. Completion date: 2003-06-07.
Top industries in this zip code by the number of employees in 2005:
Professional, Scientific, and Technical Services: Offices of Lawyers (50-99 employees: 3 establishments, 20-49 employees: 13 establishments, 10-19 employees: 14 establishments, 5-9 employees: 12 establishments, 1-4 employees: 52 establishments)Finance and Insurance: Commercial Banking (250-499: 1, 100-249: 2, 50-99: 1, 20-49: 1, 10-19: 2, 5-9: 5, 1-4: 5)Information: Wired Telecommunications Carriers (500-999: 1, 20-49: 1, 10-19: 2, 1-4: 8)Finance and Insurance: Securities Brokerage (100-249: 2, 50-99: 4, 20-49: 1, 10-19: 1, 1-4: 2)Finance and Insurance: Credit Card Issuing (100-249: 3, 50-99: 1)Accommodation and Food Services: Full-Service Restaurants (50-99: 2, 20-49: 7, 10-19: 5, 5-9: 5, 1-4: 9)Finance and Insurance: Insurance Agencies and Brokerages (250-499: 1, 20-49: 2, 10-19: 1, 1-4: 4)Arts, Entertainment, and Recreation: Promoters of Performing Arts, Sports, and Similar Events with Facilities (250-499: 1, 50-99: 1)Professional, Scientific, and Technical Services: Offices of Certified Public Accountants (100-249: 2, 50-99: 1, 5-9: 2, 1-4: 2)Accommodation and Food Services: Hotels (except Casino Hotels) and Motels (250-499: 1, 20-49: 1, 10-19: 1, 1-4: 1)
People in group quarters in 2010:
42 people in residential treatment centers for adults
20 people in emergency and transitional shelters (with sleeping facilities) for people experiencing homelessness
3 people in other noninstitutional facilities
People in group quarters in 2000:
76 people in other noninstitutional group quarters
40 people in homes or halfway houses for drug/alcohol abuse
3 people in religious group quarters
Fatal accident statistics in 2014:
Fatal accident count: 1Vehicles involved in fatal accidents: 1Fatal accidents caused by drunken drivers: 1Fatalities: 1Persons involved in fatal accidents: 1Pedestrians involved in fatal accidents: 0
Home Mortgage Disclosure Act Aggregated Statistics For Year 2009(Based on 6 partial tracts) A) FHA, FSA/RHS & VA B) Conventional C) Refinancings D) Home Improvement Loans F) Non-occupant Loans on Number Average Value Number Average Value Number Average Value Number Average Value Number Average Value
LOANS ORIGINATED 3 $81,863 7 $182,501 8 $105,845 1 $22,120 7 $151,664 APPLICATIONS APPROVED, NOT ACCEPTED 0 $0 1 $86,770 5 $98,972 0 $0 1 $112,390 APPLICATIONS DENIED 1 $165,750 7 $157,677 25 $126,882 5 $22,680 5 $99,468 APPLICATIONS WITHDRAWN 1 $134,040 1 $298,270 6 $94,023 0 $0 2 $121,060 FILES CLOSED FOR INCOMPLETENESS 0 $0 1 $118,140 2 $100,570 0 $0 1 $80,990
Aggregated Statistics For Year 2008(Based on 6 partial tracts) A) FHA, FSA/RHS & VA B) Conventional C) Refinancings D) Home Improvement Loans E) Loans on Dwellings For 5+ Families F) Non-occupant Loans on G) Loans On Manufactured Number Average Value Number Average Value Number Average Value Number Average Value Number Average Value Number Average Value Number Average Value
LOANS ORIGINATED 3 $127,973 11 $107,006 13 $141,900 4 $11,058 0 $0 10 $134,842 0 $0 APPLICATIONS APPROVED, NOT ACCEPTED 0 $0 4 $187,648 4 $112,922 3 $156,260 0 $0 2 $235,745 0 $0 APPLICATIONS DENIED 3 $79,803 60 $255,578 32 $151,525 13 $61,765 0 $0 17 $186,918 1 $263,960 APPLICATIONS WITHDRAWN 1 $183,750 3 $39,200 15 $116,288 1 $24,950 1 $1,121,830 2 $63,795 0 $0 FILES CLOSED FOR INCOMPLETENESS 1 $157,430 4 $268,992 4 $229,652 1 $40,480 0 $0 2 $293,615 0 $0
Aggregated Statistics For Year 2007(Based on 6 partial tracts) A) FHA, FSA/RHS & VA B) Conventional C) Refinancings D) Home Improvement Loans E) Loans on Dwellings For 5+ Families F) Non-occupant Loans on G) Loans On Manufactured Number Average Value Number Average Value Number Average Value Number Average Value Number Average Value Number Average Value Number Average Value
LOANS ORIGINATED 6 $136,045 28 $105,843 25 $105,234 6 $62,430 0 $0 17 $114,221 0 $0 APPLICATIONS APPROVED, NOT ACCEPTED 0 $0 8 $109,368 11 $96,902 1 $118,180 0 $0 6 $97,185 0 $0 APPLICATIONS DENIED 0 $0 22 $120,163 47 $100,127 23 $40,685 3 $439,933 20 $90,072 1 $14,860 APPLICATIONS WITHDRAWN 0 $0 9 $79,133 20 $91,376 1 $72,420 0 $0 8 $82,996 0 $0 FILES CLOSED FOR INCOMPLETENESS 0 $0 1 $144,390 3 $149,407 0 $0 0 $0 2 $202,350 0 $0
Aggregated Statistics For Year 2006(Based on 6 partial tracts) A) FHA, FSA/RHS & VA B) Conventional C) Refinancings D) Home Improvement Loans E) Loans on Dwellings For 5+ Families F) Non-occupant Loans on Number Average Value Number Average Value Number Average Value Number Average Value Number Average Value Number Average Value
LOANS ORIGINATED 5 $121,290 64 $90,994 29 $97,898 8 $30,716 1 $524,760 39 $88,563 APPLICATIONS APPROVED, NOT ACCEPTED 1 $101,870 16 $113,676 6 $83,697 2 $36,570 1 $314,030 7 $90,057 APPLICATIONS DENIED 2 $101,750 21 $109,893 28 $100,253 19 $37,545 0 $0 22 $94,740 APPLICATIONS WITHDRAWN 1 $138,770 21 $115,217 21 $106,033 3 $190,833 0 $0 14 $85,509 FILES CLOSED FOR INCOMPLETENESS 0 $0 10 $110,087 6 $150,108 0 $0 0 $0 3 $148,563
Aggregated Statistics For Year 2005(Based on 6 partial tracts) A) FHA, FSA/RHS & VA B) Conventional C) Refinancings D) Home Improvement Loans E) Loans on Dwellings For 5+ Families F) Non-occupant Loans on G) Loans On Manufactured Number Average Value Number Average Value Number Average Value Number Average Value Number Average Value Number Average Value Number Average Value
LOANS ORIGINATED 3 $113,107 49 $99,102 34 $104,519 6 $32,268 1 $2,639,600 39 $99,920 0 $0 APPLICATIONS APPROVED, NOT ACCEPTED 0 $0 16 $94,461 11 $81,447 5 $30,554 0 $0 12 $78,581 0 $0 APPLICATIONS DENIED 1 $195,330 28 $116,112 62 $105,542 22 $31,627 1 $214,860 25 $98,303 1 $29,340 APPLICATIONS WITHDRAWN 1 $96,020 12 $245,568 32 $106,662 3 $303,290 0 $0 12 $236,088 0 $0 FILES CLOSED FOR INCOMPLETENESS 0 $0 5 $142,196 10 $119,620 2 $70,280 0 $0 3 $74,893 0 $0
Aggregated Statistics For Year 2004(Based on 6 partial tracts) A) FHA, FSA/RHS & VA B) Conventional C) Refinancings D) Home Improvement Loans E) Loans on Dwellings For 5+ Families F) Non-occupant Loans on Number Average Value Number Average Value Number Average Value Number Average Value Number Average Value Number Average Value
LOANS ORIGINATED 4 $100,228 33 $79,255 40 $77,128 4 $20,090 7 $212,486 27 $71,909 APPLICATIONS APPROVED, NOT ACCEPTED 0 $0 9 $131,224 10 $80,372 1 $16,930 0 $0 4 $68,510 APPLICATIONS DENIED 1 $78,090 11 $95,494 54 $78,336 9 $34,681 3 $168,927 11 $82,303 APPLICATIONS WITHDRAWN 0 $0 7 $159,416 40 $85,246 1 $12,990 0 $0 9 $75,388 FILES CLOSED FOR INCOMPLETENESS 1 $130,660 4 $126,218 11 $82,075 0 $0 0 $0 2 $47,930
Aggregated Statistics For Year 2003(Based on 6 partial tracts) A) FHA, FSA/RHS & VA B) Conventional C) Refinancings D) Home Improvement Loans E) Loans on Dwellings For 5+ Families F) Non-occupant Loans on Number Average Value Number Average Value Number Average Value Number Average Value Number Average Value Number Average Value
LOANS ORIGINATED 4 $118,778 39 $89,662 39 $78,257 1 $35,450 1 $21,116,800 22 $71,536 APPLICATIONS APPROVED, NOT ACCEPTED 0 $0 7 $81,596 13 $71,588 1 $24,090 0 $0 5 $75,048 APPLICATIONS DENIED 1 $96,350 19 $75,755 34 $66,495 5 $18,542 0 $0 10 $74,187 APPLICATIONS WITHDRAWN 0 $0 6 $70,505 32 $78,425 1 $36,510 0 $0 8 $67,225 FILES CLOSED FOR INCOMPLETENESS 0 $0 2 $45,080 4 $174,502 0 $0 0 $0 1 $67,760
Aggregated Statistics For Year 2002(Based on 6 partial tracts) A) FHA, FSA/RHS & VA B) Conventional C) Refinancings D) Home Improvement Loans F) Non-occupant Loans on Number Average Value Number Average Value Number Average Value Number Average Value Number Average Value
LOANS ORIGINATED 7 $74,003 23 $73,601 19 $71,635 5 $28,090 15 $64,882 APPLICATIONS APPROVED, NOT ACCEPTED 0 $0 12 $55,739 5 $76,418 1 $17,640 3 $46,543 APPLICATIONS DENIED 1 $74,020 21 $63,312 40 $66,896 5 $20,328 10 $62,571 APPLICATIONS WITHDRAWN 1 $34,120 11 $97,463 30 $84,883 1 $11,900 3 $84,367 FILES CLOSED FOR INCOMPLETENESS 0 $0 0 $0 4 $92,288 0 $0 0 $0
Aggregated Statistics For Year 2001(Based on 6 partial tracts) A) FHA, FSA/RHS & VA B) Conventional C) Refinancings D) Home Improvement Loans E) Loans on Dwellings For 5+ Families F) Non-occupant Loans on Number Average Value Number Average Value Number Average Value Number Average Value Number Average Value Number Average Value
LOANS ORIGINATED 9 $84,339 14 $62,296 14 $62,851 2 $9,515 0 $0 6 $49,225 APPLICATIONS APPROVED, NOT ACCEPTED 0 $0 2 $45,415 5 $74,116 2 $12,215 0 $0 0 $0 APPLICATIONS DENIED 0 $0 17 $66,077 44 $72,445 7 $31,100 1 $560,910 10 $69,496 APPLICATIONS WITHDRAWN 0 $0 4 $66,578 16 $114,289 3 $24,063 0 $0 3 $66,673 FILES CLOSED FOR INCOMPLETENESS 0 $0 1 $45,480 4 $67,708 0 $0 0 $0 0 $0
Aggregated Statistics For Year 2000(Based on 6 partial tracts) A) FHA, FSA/RHS & VA B) Conventional C) Refinancings D) Home Improvement Loans F) Non-occupant Loans on Number Average Value Number Average Value Number Average Value Number Average Value Number Average Value
LOANS ORIGINATED 4 $57,178 27 $59,623 7 $60,203 6 $15,220 6 $43,482 APPLICATIONS APPROVED, NOT ACCEPTED 0 $0 5 $63,704 5 $72,162 7 $22,696 0 $0 APPLICATIONS DENIED 1 $41,430 20 $52,393 35 $61,691 21 $23,314 8 $57,065 APPLICATIONS WITHDRAWN 3 $58,307 3 $81,007 21 $55,694 1 $26,400 4 $39,942 FILES CLOSED FOR INCOMPLETENESS 0 $0 0 $0 2 $56,950 0 $0 1 $39,690
Aggregated Statistics For Year 1999(Based on 3 partial tracts) A) FHA, FSA/RHS & VA B) Conventional C) Refinancings D) Home Improvement Loans F) Non-occupant Loans on Number Average Value Number Average Value Number Average Value Number Average Value Number Average Value
LOANS ORIGINATED 3 $75,380 5 $52,732 13 $71,638 5 $11,260 5 $46,066 APPLICATIONS APPROVED, NOT ACCEPTED 0 $0 2 $49,255 5 $64,778 3 $11,810 0 $0 APPLICATIONS DENIED 0 $0 9 $53,178 21 $52,064 6 $15,757 3 $40,857 APPLICATIONS WITHDRAWN 1 $77,010 2 $129,675 12 $64,205 0 $0 1 $129,110 FILES CLOSED FOR INCOMPLETENESS 0 $0 1 $80,200 3 $78,797 0 $0 1 $53,500
Detailed HMDA statistics for the following Tracts:
0001.00
,
0002.00 ,
0011.00
Private Mortgage Insurance Companies Aggregated Statistics For Year 2009(Based on 6 partial tracts) A) Conventional Number Average Value
LOANS ORIGINATED 2 $221,670 APPLICATIONS APPROVED, NOT ACCEPTED 0 $0 APPLICATIONS DENIED 3 $158,040 APPLICATIONS WITHDRAWN 2 $124,005 FILES CLOSED FOR INCOMPLETENESS 0 $0
Aggregated Statistics For Year 2008(Based on 6 partial tracts) A) Conventional B) Refinancings C) Non-occupant Loans on Number Average Value Number Average Value Number Average Value
LOANS ORIGINATED 5 $86,122 0 $0 3 $106,693 APPLICATIONS APPROVED, NOT ACCEPTED 6 $162,045 2 $87,670 3 $201,423 APPLICATIONS DENIED 1 $124,770 0 $0 1 $157,000 APPLICATIONS WITHDRAWN 0 $0 0 $0 0 $0 FILES CLOSED FOR INCOMPLETENESS 0 $0 0 $0 0 $0
Aggregated Statistics For Year 2007(Based on 6 partial tracts) A) Conventional B) Refinancings C) Non-occupant Loans on Number Average Value Number Average Value Number Average Value
LOANS ORIGINATED 12 $133,738 1 $121,480 7 $151,710 APPLICATIONS APPROVED, NOT ACCEPTED 1 $122,490 0 $0 1 $77,860 APPLICATIONS DENIED 0 $0 0 $0 0 $0 APPLICATIONS WITHDRAWN 2 $81,430 0 $0 1 $93,640 FILES CLOSED FOR INCOMPLETENESS 0 $0 0 $0 0 $0
Aggregated Statistics For Year 2006(Based on 6 partial tracts) A) Conventional B) Refinancings C) Non-occupant Loans on Number Average Value Number Average Value Number Average Value
LOANS ORIGINATED 7 $101,000 1 $105,060 2 $74,350 APPLICATIONS APPROVED, NOT ACCEPTED 4 $83,098 0 $0 0 $0 APPLICATIONS DENIED 0 $0 0 $0 0 $0 APPLICATIONS WITHDRAWN 0 $0 0 $0 0 $0 FILES CLOSED FOR INCOMPLETENESS 0 $0 0 $0 0 $0
Aggregated Statistics For Year 2005(Based on 6 partial tracts) A) Conventional C) Non-occupant Loans on Number Average Value Number Average Value
LOANS ORIGINATED 14 $94,826 9 $105,264 APPLICATIONS APPROVED, NOT ACCEPTED 1 $105,570 1 $36,360 APPLICATIONS DENIED 0 $0 0 $0 APPLICATIONS WITHDRAWN 1 $95,030 0 $0 FILES CLOSED FOR INCOMPLETENESS 0 $0 0 $0
Aggregated Statistics For Year 2004(Based on 6 partial tracts) A) Conventional B) Refinancings C) Non-occupant Loans on Number Average Value Number Average Value Number Average Value
LOANS ORIGINATED 9 $87,746 1 $89,280 4 $57,288 APPLICATIONS APPROVED, NOT ACCEPTED 6 $137,632 0 $0 0 $0 APPLICATIONS DENIED 1 $80,510 0 $0 1 $80,510 APPLICATIONS WITHDRAWN 0 $0 0 $0 0 $0 FILES CLOSED FOR INCOMPLETENESS 0 $0 1 $80,990 1 $80,990
Aggregated Statistics For Year 2003(Based on 6 partial tracts) A) Conventional B) Refinancings C) Non-occupant Loans on Number Average Value Number Average Value Number Average Value
LOANS ORIGINATED 14 $91,459 2 $59,905 3 $85,810 APPLICATIONS APPROVED, NOT ACCEPTED 6 $114,575 2 $93,405 2 $93,405 APPLICATIONS DENIED 0 $0 0 $0 0 $0 APPLICATIONS WITHDRAWN 0 $0 0 $0 0 $0 FILES CLOSED FOR INCOMPLETENESS 0 $0 0 $0 0 $0
Aggregated Statistics For Year 2002(Based on 6 partial tracts) A) Conventional B) Refinancings C) Non-occupant Loans on Number Average Value Number Average Value Number Average Value
LOANS ORIGINATED 6 $81,743 5 $112,214 2 $71,830 APPLICATIONS APPROVED, NOT ACCEPTED 6 $90,727 0 $0 0 $0 APPLICATIONS DENIED 0 $0 0 $0 0 $0 APPLICATIONS WITHDRAWN 3 $214,343 0 $0 0 $0 FILES CLOSED FOR INCOMPLETENESS 0 $0 0 $0 0 $0
Aggregated Statistics For Year 2001(Based on 6 partial tracts) A) Conventional B) Refinancings C) Non-occupant Loans on Number Average Value Number Average Value Number Average Value
LOANS ORIGINATED 3 $144,487 3 $62,697 1 $52,990 APPLICATIONS APPROVED, NOT ACCEPTED 3 $93,037 0 $0 2 $54,750 APPLICATIONS DENIED 0 $0 0 $0 0 $0 APPLICATIONS WITHDRAWN 0 $0 0 $0 0 $0 FILES CLOSED FOR INCOMPLETENESS 0 $0 0 $0 0 $0
Aggregated Statistics For Year 2000(Based on 6 partial tracts) A) Conventional B) Refinancings C) Non-occupant Loans on Number Average Value Number Average Value Number Average Value
LOANS ORIGINATED 4 $64,865 1 $84,810 0 $0 APPLICATIONS APPROVED, NOT ACCEPTED 4 $79,305 0 $0 0 $0 APPLICATIONS DENIED 1 $81,490 0 $0 1 $48,340 APPLICATIONS WITHDRAWN 0 $0 0 $0 0 $0 FILES CLOSED FOR INCOMPLETENESS 0 $0 0 $0 0 $0
Aggregated Statistics For Year 1999(Based on 3 partial tracts) A) Conventional B) Refinancings C) Non-occupant Loans on Number Average Value Number Average Value Number Average Value
LOANS ORIGINATED 1 $89,710 0 $0 0 $0 APPLICATIONS APPROVED, NOT ACCEPTED 1 $16,040 0 $0 1 $16,040 APPLICATIONS DENIED 0 $0 1 $66,360 0 $0 APPLICATIONS WITHDRAWN 0 $0 0 $0 0 $0 FILES CLOSED FOR INCOMPLETENESS 0 $0 0 $0 0 $0
Detailed PMIC statistics for the following Tracts:
0001.00
,
0002.00 ,
0011.00
2002 - 2018 National Fire Incident Reporting System (NFIRS) incidents See full 2006 National Fire Incident Reporting System statistics for zip code 12207, New York
Most common first names in zip code 12207 among deceased individuals Name Count Lived (average)
John 70 72.0 years Mary 65 79.5 years William 53 73.1 years Helen 45 80.5 years James 43 70.2 years Joseph 38 71.3 years George 38 72.1 years Margaret 33 78.2 years Edward 32 70.8 years Elizabeth 26 79.3 years
Most common last names in zip code 12207 among deceased individuals Last name Count Lived (average)
Smith 31 73.2 years Williams 19 67.2 years Brown 14 66.8 years Miller 14 74.9 years Davis 11 56.2 years Jones 10 56.7 years Murphy 8 80.1 years Johnson 8 69.1 years Allen 7 72.3 years Thompson 6 76.3 years
Businesses in zip code 12207
Name Count Name Count
Ascend Collection 1 McDonald's 1 Dunkin Donuts 1 Nike 1 FedEx 13 Rite Aid 1 H&R Block 1 Starbucks 1 Holiday Inn 2 UPS 8

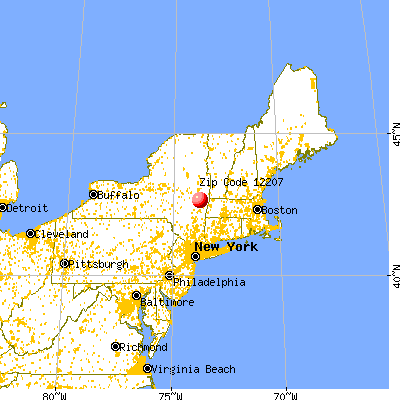


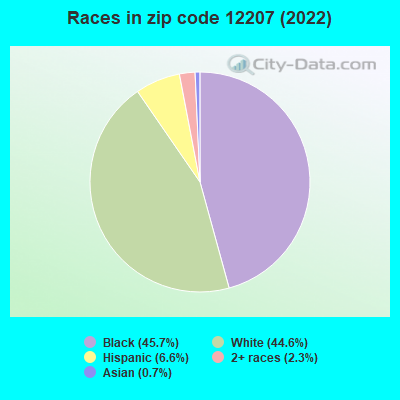


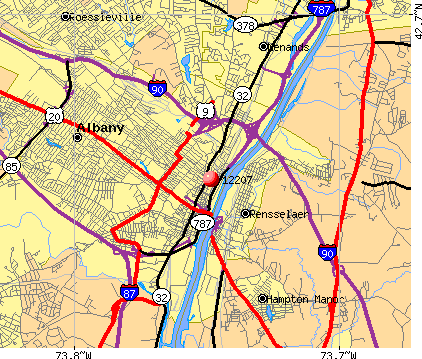 Nearest zip codes: 12210, 12202, 12204, 12206, 12144, 12209.

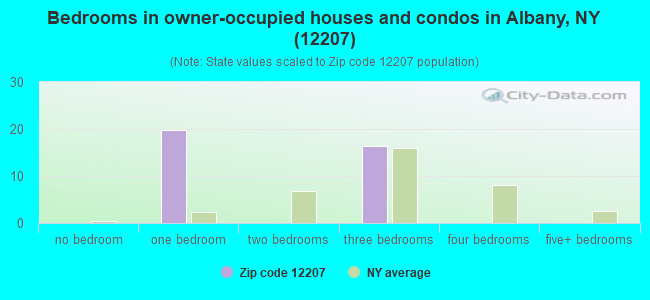
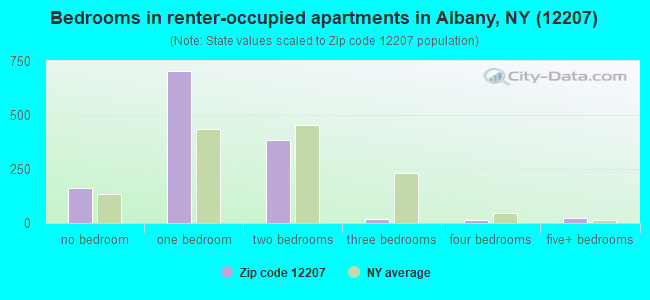
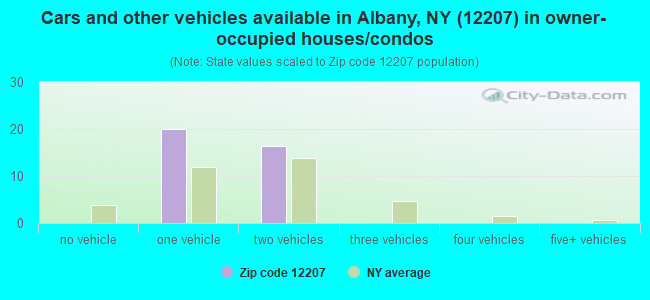
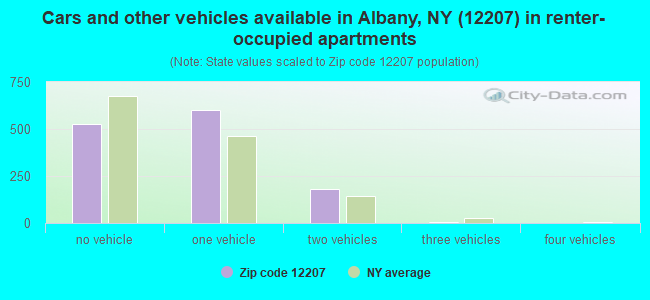


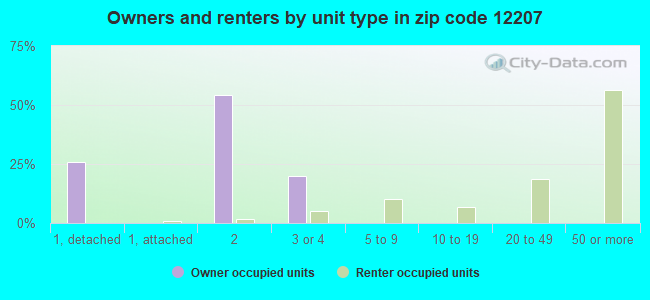


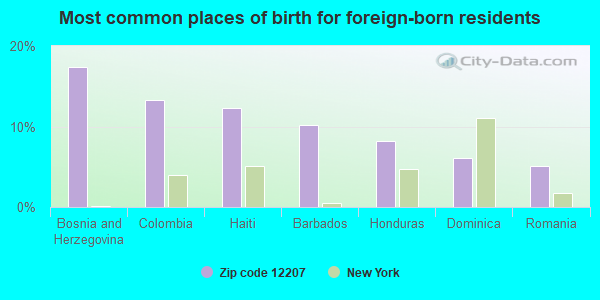
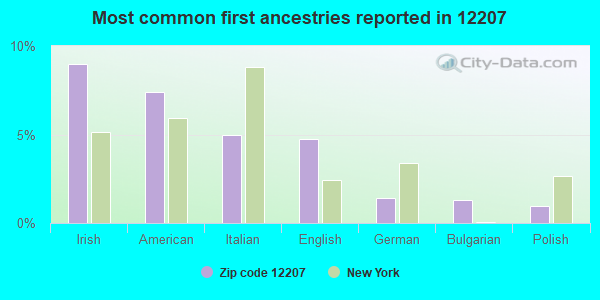
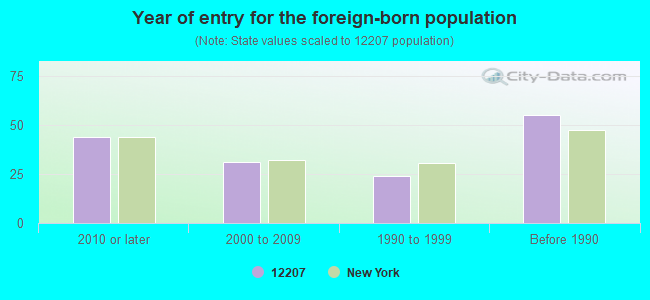


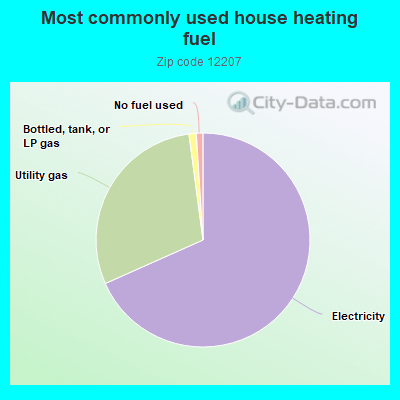
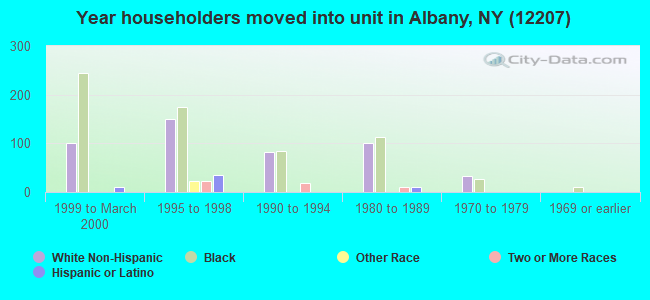
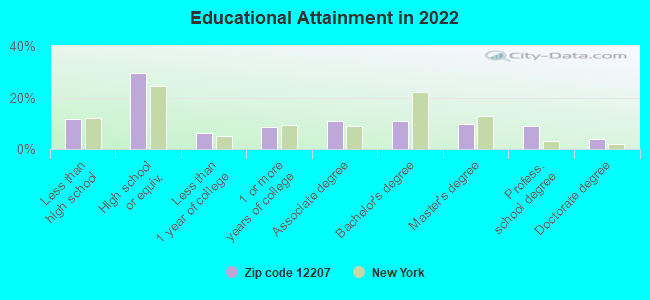
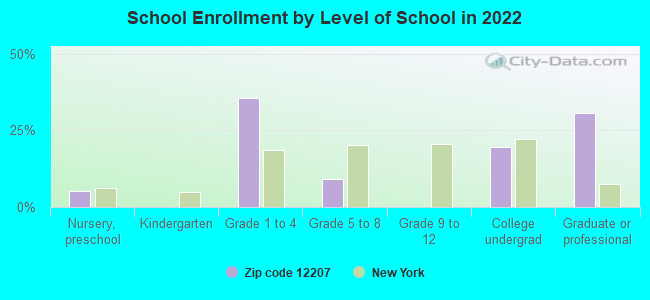
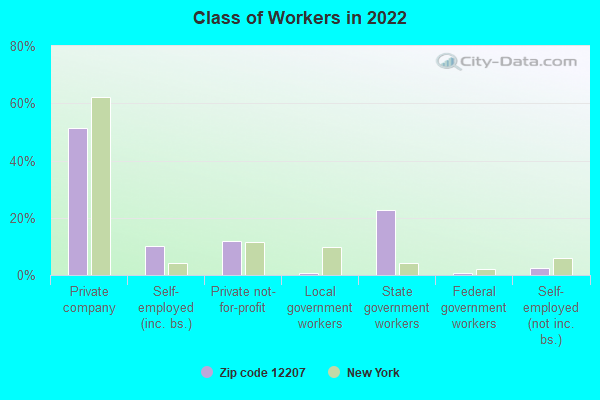
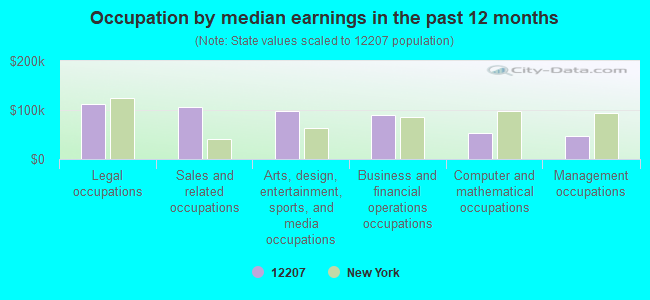
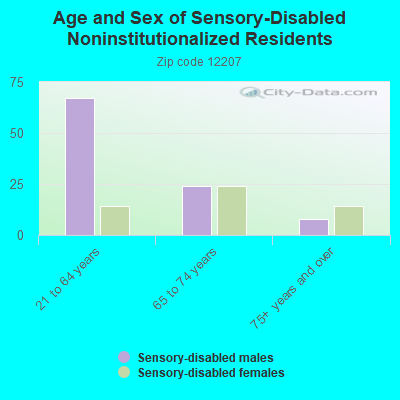
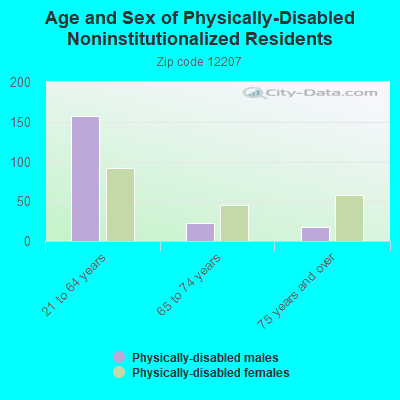
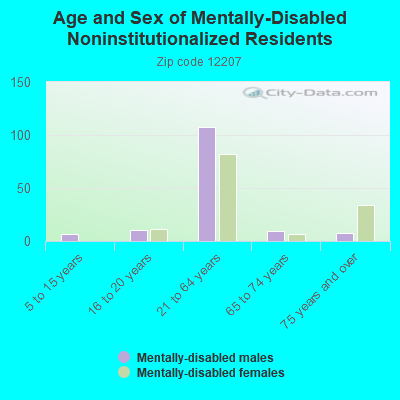
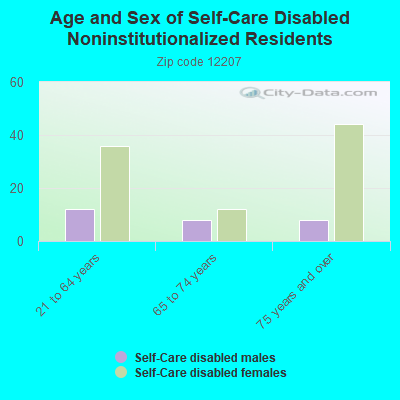
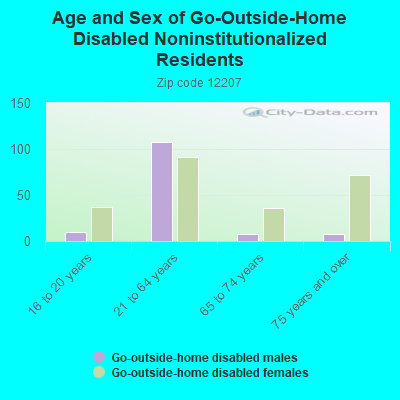
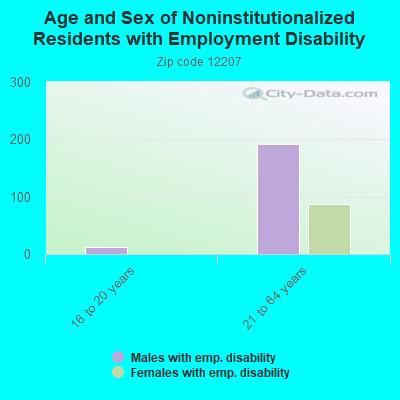
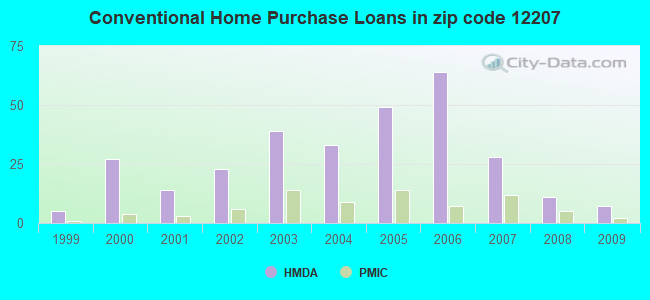
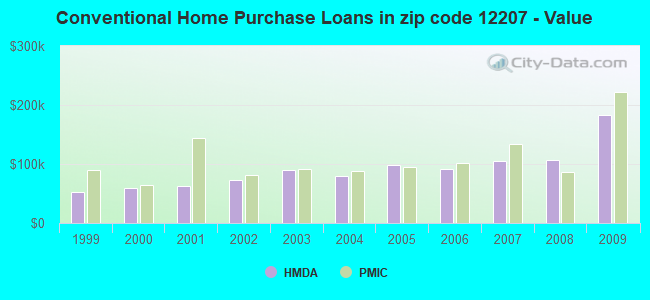
 Based on the data from the years 2002 - 2018 the average number of fire incidents per year is 17. The highest number of fire incidents - 42 took place in 2003, and the least - 0 in 2008. The data has a decreasing trend.
 When looking into fire subcategories, the most reports belonged to: Other (34.1%), and Structure Fires (27.7%).